Visualize organization hierarchy
This guide demonstrates how to:
- Model the hierarchy tiers in your company.
- Create dedicated views for each tier, displaying relevant information.
Data model overview
Port allows you to model your team structure by connecting teams in a hierarchy using a single Team blueprint:
- Team represents any level in the hierarchy, from high-level groups to leaf-level teams that directly own resources.
- Service is used as an example throughout this guide for an entity owned by a team. Any blueprint that connects to teams (repositories, cloud resources, projects, etc.) can serve this role.
Example hierarchies
The simplest hierarchy has two levels:
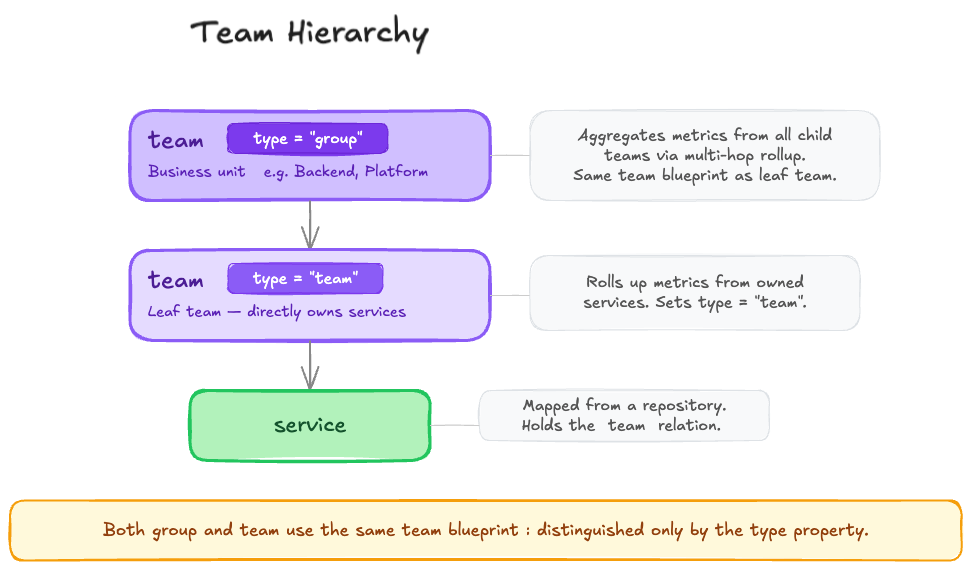
You can add more levels to match your needs by adding more enum values to the type property of the Team blueprint (which we will set up in the section below).
Throughout this guide, we will use Group > Team as our example hierarchy, with Service as an example of an entity owned by a team, but any blueprint that connects to teams can play this role.
Other possible hierarchies could look like the following:
Department > Domain > Tribe > Squad > ServiceDepartment > Group > Unit > Team > Service
Since every level is just a team entity with a parent_team relation, the setup works the same regardless of how many levels you have or what you call them.
Prerequisites
This guide assumes you have a Port account with admin access, and have completed the onboarding process.
Set up data model
To support hierarchy tiers, we will extend the Team blueprint with a self-relation and a type property.
If your Team blueprint already has a parent_team self-relation and a type property, you can skip ahead to Create dashboard to further use the hierarchy in dashboards and widgets, or to Next steps to see what else you can build on top of it.
Extend the Team blueprint
The Team blueprint is available by default in Port. We need to extend it with a self-relation and a type property.
Perform the following steps to extend the Team blueprint:
Add a self-relation
-
Go to the Builder page of your portal.
-
Search for the
Teamblueprint using the search bar. -
Click on
+ New relationat the bottom of the blueprint card. -
Fill out the form as seen below, then click
Create: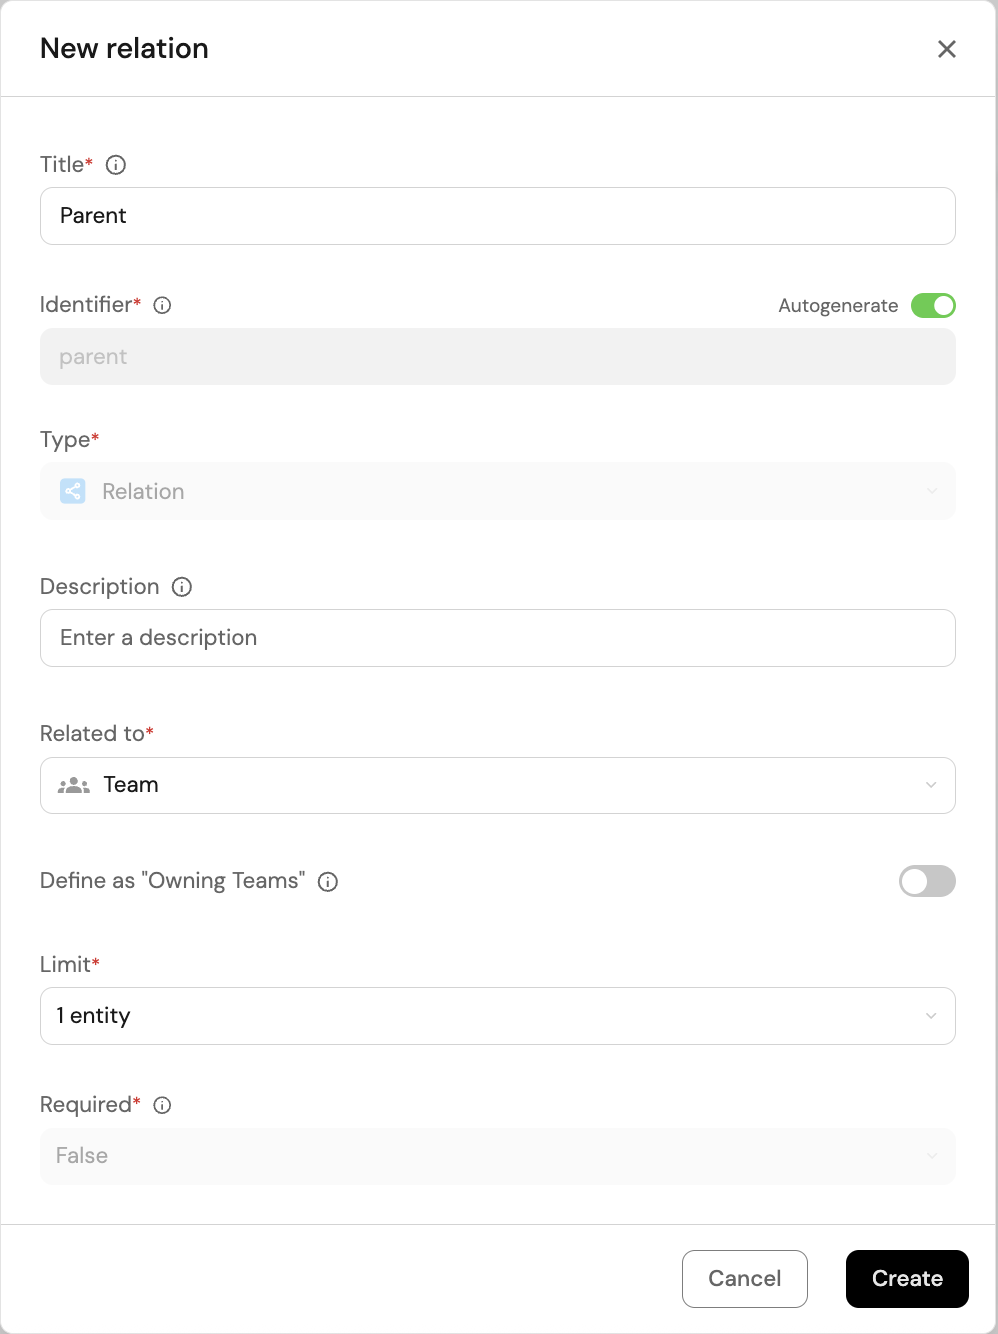
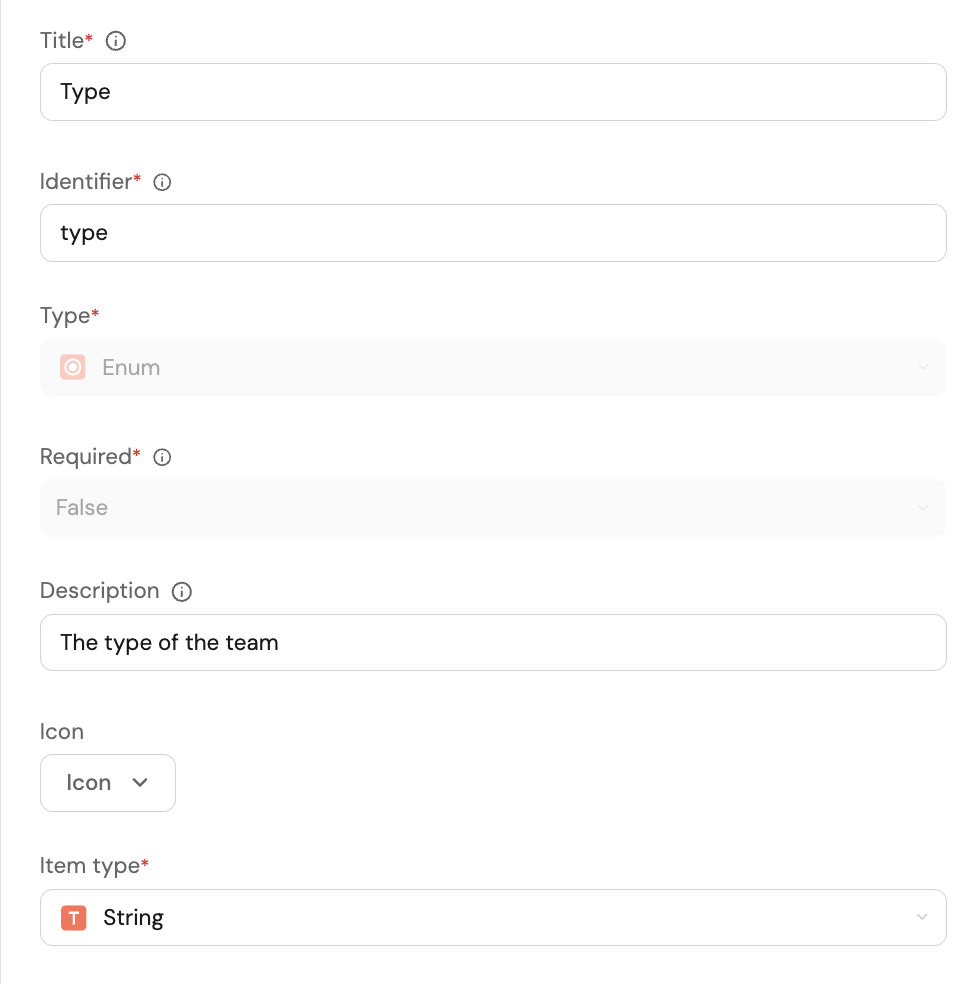
Add a "type" property
-
Click on
+ New propertyin theTeamblueprint card, and chooseEnumas the property type. -
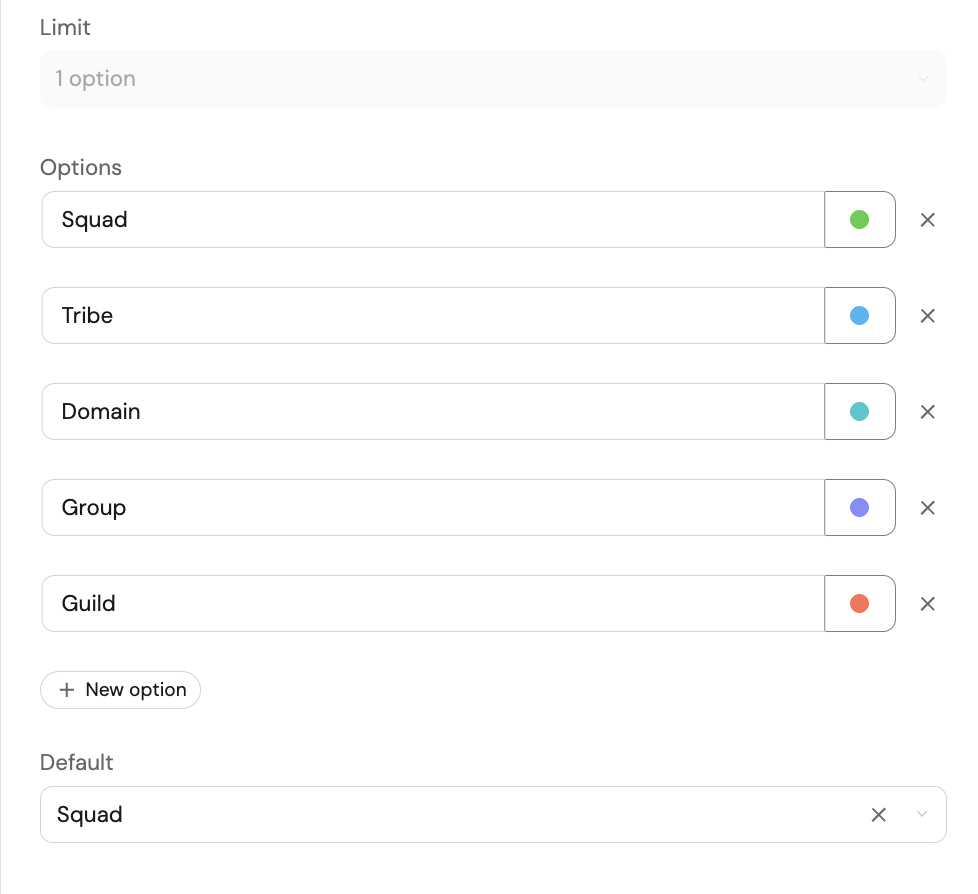
Fill out the form with the options matching your hierarchy tiers, then click
Create. This property is what distinguishes between hierarchy levels (e.g. "Group" vs "Team") and is also used for filtering in dashboard widgets.You can use the following example:
Assign types & parent teams
To finish setting up the data model, we need to assign each team a type and a parent team.
-
Click on the

 button in the
 Teamblueprint card to view all of your team entities. -
Assign a type and a parent team to each team by hovering over the relevant property and clicking on the

 button.
- Set groups to type
groupand teams to typeteam. - Set each team's
parent_teamto its parent group.
- Set groups to type
To make the process of assigning types and parent teams easier, you can use the ![]()
![]()
Manage properties button in the top-right corner of the table to hide other columns.
Create dashboard
Now that our data model is set up, let's create a dedicated dashboard for group leads.
-
Go to the catalog page of your portal.
-
In the left sidebar, click on
+, then selectNew dashboard. -
Name the dashboard "Group Lead". Optionally, give it a description and select an icon, then click
Create.
The filters rely on the logged-in user's team membership, so users must be assigned to a team at the level the dashboard is scoped to. For this guide's example, that means being a member of a Group-level team.
Next, let's add two useful tables to the dashboard:
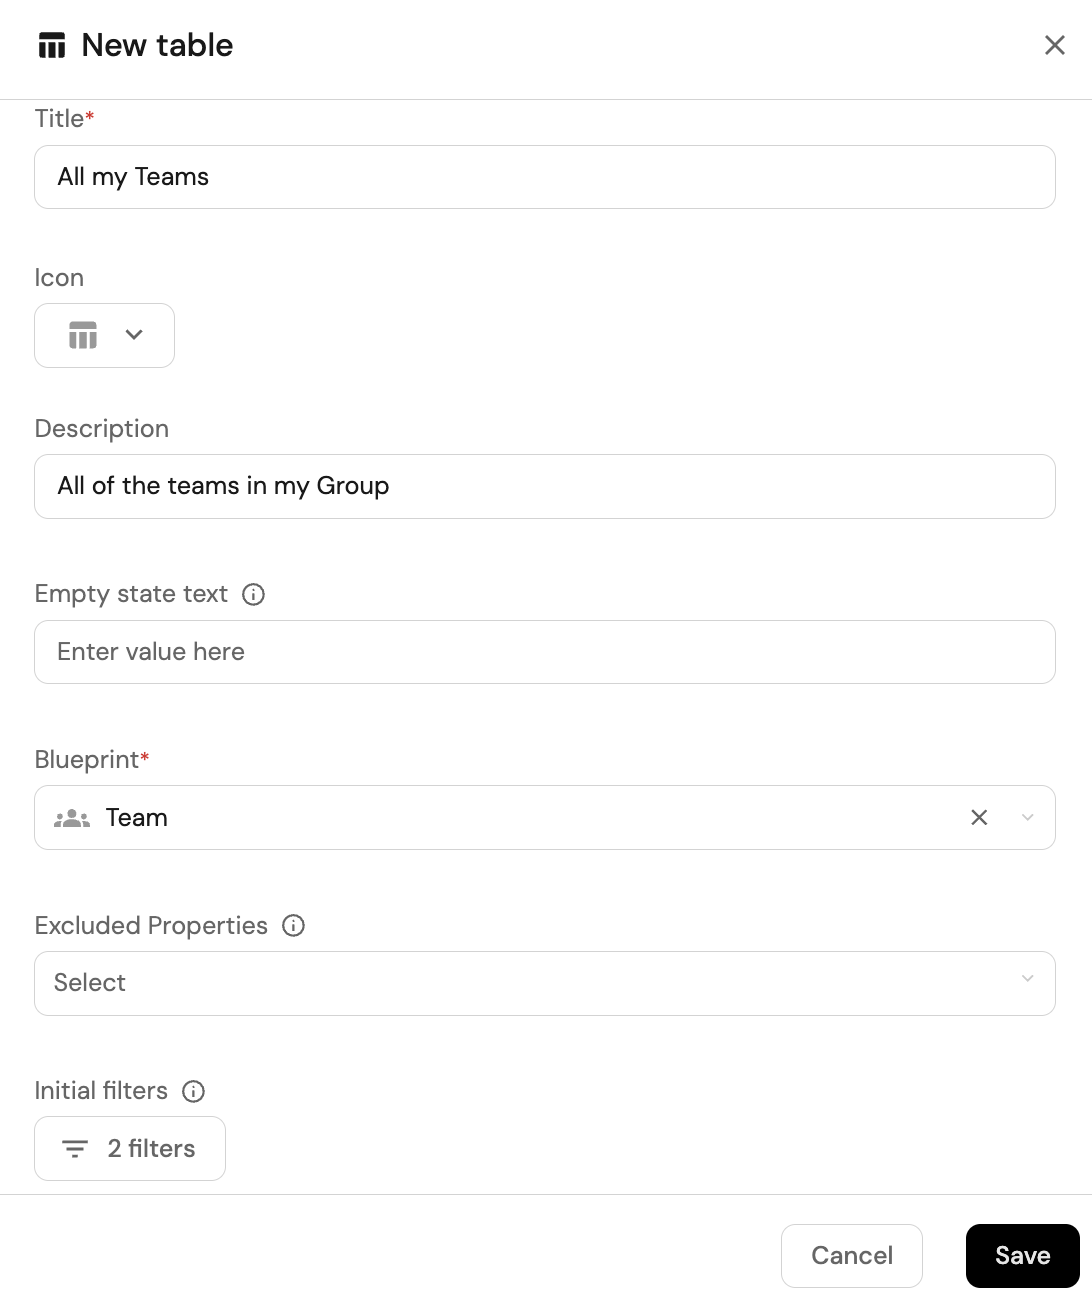
Table 1: all of the group's teams
The first table will display all of the teams under the group of the logged-in user.
-
Click on
+ Widgetin the top-right corner of the dashboard, then selectTable. -
Fill out the form as seen below:
-
Define filters to ensure that only the relevant teams are displayed. Click on the
Filtersbutton. -
Click on
Edit JSON, and paste the following JSON. Note: the filters in this table use contextual query rules, which can only be configured via JSON and not through the UI.{"combinator": "and","rules": [{"value": "Team","property": "type","operator": "="},{"operator": "matchAny","property": {"path": [{"relation": "parent_team","maxHops": 1}]},"value": {"context": "userTeams","property": "$identifier"}}]}This JSON object defines two filters with an
ANDoperator between them:- The first filter ensures that only teams (not groups) are displayed.
- The second filter uses
matchAnywithmaxHopsto find teams that are one level below in the hierarchy via theparent_teamself-relation. The value is resolved dynamically based on the logged-in user's team membership using a contextual query rule. The value of1reflects the single level between groups and teams in this example - increase it to match the depth of your own hierarchy.
-
Click
Saveto save the filters, then clickSaveagain to save the table.
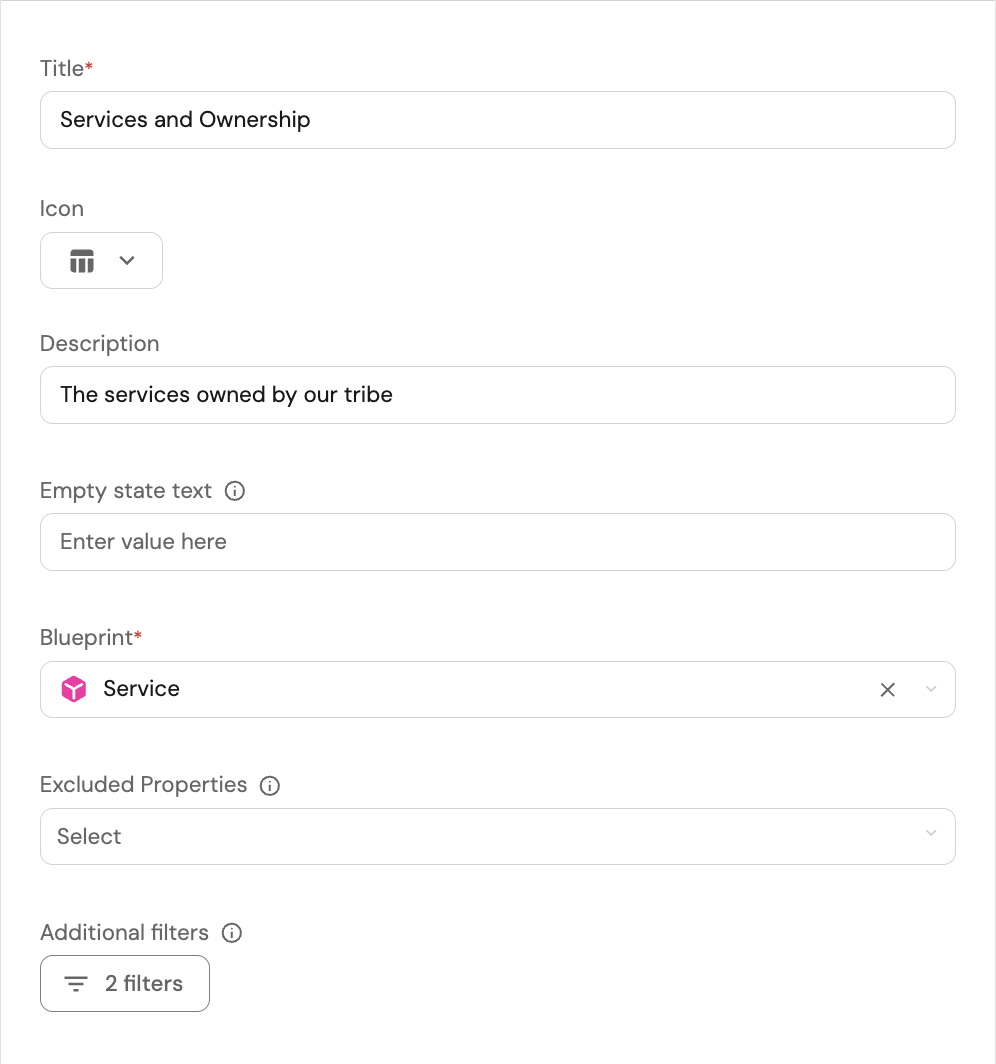
Table 2: all services owned by the group
-
Click on
+ Widgetin the top-right corner of the dashboard, then selectTable. -
Fill out the form as seen below:
-
Define filters to ensure that only the relevant services are displayed. Click on the
Filtersbutton. -
Click on
Edit JSON, and paste the following JSON. Note: the filters in this table use contextual query rules, which can only be configured via JSON and not through the UI.{"combinator": "or","rules": [{"value": {"context": "userTeams","property": "$identifier"},"property": "$team","operator": "containsAny"},{"operator": "matchAny","property": {"path": ["$team",{"relation": "parent_team","maxHops": 1}]},"value": {"context": "userTeams","property": "$identifier"}}]}This JSON object defines two filters with an
ORoperator between them:- The first filter matches services directly owned by one of the logged-in user's teams.
- The second filter uses
matchAnywithmaxHopsto find services whose owning team is one level below in the hierarchy via theparent_teamself-relation. The value is resolved dynamically based on the logged-in user's team membership using a contextual query rule.- The value of
1reflects the single level between groups and teams in this example - increase it to match the depth of your own hierarchy. - Avoid using the
relatedTooperator for this - it matches all paths between blueprints, not just the hierarchy path, which leads to unintended results and poor performance.
- The value of
-
Click
Saveto save the filters, then clickSaveagain to save the table.
If you want to apply a filter across all widgets displaying the same blueprint, you can define it once at the dashboard level instead of per widget.
Advanced filter patterns
The examples above use a simple hierarchy with services as the primary entity. This section covers how to adapt the same approach for more complex scenarios, different entity types, and visibility in both directions across the hierarchy.
Executive visibility
A CTO wants one dashboard with all services, incidents, and metrics across the entire org, without being manually added to every team downstream and re-added whenever teams change.
To achieve that, assign the executive as a member of the top-level team in your hierarchy, then use the same filter as above with maxHops set to the full depth of your hierarchy:
Filter: all services across the org (click to expand)
{
  "combinator": "or",
  "rules": [
    {
      "value": {
        "context": "userTeams",
        "property": "$identifier"
      },
      "property": "$team",
      "operator": "containsAny"
    },
    {
      "operator": "matchAny",
      "property": {
        "path": [
          "$team",
          {
            "relation": "parent_team",
            "maxHops": 10
          }
        ]
      },
      "value": {
        "context": "userTeams",
        "property": "$identifier"
      }
    }
  ]
}
- The first rule matches services directly owned by the executive's team.
- The second rule traverses up to 10 levels of
parent_teamrelations, capturing services owned by any team in the hierarchy below. As long as your hierarchy does not exceed 10 levels, the dashboard will update automatically whenever teams are added or reorganized.
Choosing the right filter property
The path in your filter defines how Port traverses relations to reach the entity's owning team. The right path depends on how each entity type connects to teams.
Filter by built-in $team relation
Some entities, such as services, relate to a team through the built-in $team property. In that case, use $team as the starting point in the path, as shown in the examples above. This is the most common case.
Filter by custom direct team relation
Some entities have a custom relation to a team. For example, an incident blueprint may have a supporting_team relation. Since $team does not exist on incidents, use the relation's identifier directly in the path:
Filter: incidents by custom team relation (click to expand)
{
  "combinator": "and",
  "rules": [
    {
      "operator": "matchAny",
      "property": {
        "path": [
          "supporting_team",
          {
            "relation": "parent_team",
            "maxHops": 10
          }
        ]
      },
      "value": {
        "context": "userTeams",
        "property": "$identifier"
      }
    }
  ]
}
Filter by user-to-team traversal
Some entities relate to a team indirectly through a user. For example, a pull request has an author relation to a User, and that user belongs to teams. To show a manager all pull requests by developers in their group, traverse from the entity through the user to the team:
Filter: pull requests by user-to-team traversal (click to expand)
{
  "combinator": "and",
  "rules": [
    {
      "operator": "matchAny",
      "property": {
        "path": [
          "author",
          "$team",
          {
            "relation": "parent_team",
            "maxHops": 10
          }
        ]
      },
      "value": {
        "context": "userTeams",
        "property": "$identifier"
      }
    }
  ]
}
Filter by mirror property (indirect relation)
If an entity relates to a team only through an intermediate entity, you cannot use matchAny to traverse that path. For example, a ServiceNow incident has no direct relation to a team - it relates to a ServiceNow service, which then relates to a team. In that case, matchAny path traversal will not work.
The solution is to add a mirror property on the incident blueprint that reflects the owning team from the service (e.g. service_owner mirroring service_now_service.$team). Once the mirror property exists, you can filter directly against it using containsAny:
Filter: incidents by mirror property (click to expand)
{
  "combinator": "and",
  "rules": [
    {
      "value": {
        "context": "userTeams",
        "property": "$identifier"
      },
      "property": "service_owner",
      "operator": "containsAny"
    }
  ]
}
This works because the mirror property surfaces the owning team's identifier directly on the incident, making it filterable without needing to traverse relations.
Filter by team lead relation
Some organizations track leadership via a dedicated relation on the Team blueprint (e.g. team_lead) rather than through team membership. If yours does, you can scope dashboards to whoever is set as the lead of a team.
The filter traverses from the service up through its owning team, up the hierarchy, and then to the team_lead relation, matching against the current user:
Filter: services by team lead (click to expand)
{
  "combinator": "and",
  "rules": [
    {
      "operator": "matchAny",
      "property": {
        "path": [
          "$team",
          {
            "relation": "parent_team",
            "maxHops": 10
          },
          "team_lead"
        ]
      },
      "value": {
        "context": "user",
        "property": "$identifier"
      }
    }
  ]
}
Next steps
Once your hierarchy is set up, you can:
- Create similar dashboards for managers of each tier in your hierarchy, where they can track and visualize useful information about the teams they are responsible for.
- Use the View as feature to verify the filters work correctly from each user's perspective.
- Add additional widgets to the dashboard, such as:
- A pie chart showing the distribution of incidents across teams in your group.
- Number charts displaying the number of resolved issues per team in a given time period.
- A chart/table displaying the members of each team in your group, by role/name.