Pipeline reliability
Why it matters
CI/CD pipelines are the backbone of software delivery but when they fail frequently or unpredictably, developer productivity suffers. Teams lose trust in the build system, start ignoring failures, or work around flaky pipelines with manual processes. Without a scorecard to grade pipeline health, reliability issues stay invisible until they cause a major delivery slowdown or outage.
What to track
- Pipeline success rate: Percentage of pipeline runs that complete successfully per service or team.
- Failure frequency: How often pipelines fail over a given period, highlighting services with chronic issues.
- Mean time to fix pipeline: How quickly teams resolve broken builds, graded against team targets.
- Flaky test rate: Percentage of pipeline failures caused by non-deterministic tests rather than real code issues.
- Pipeline duration: Build and deploy time trends, flagging services where pipelines are getting slower.
How Port helps
Port's pipeline reliability scorecards evaluate every service and team against CI/CD health metrics using Bronze, Silver, and Gold maturity levels. Pipeline data flows in from GitHub Actions, GitLab CI, Azure Pipelines, and other CI/CD tools, linked to services and teams in your software catalog & context lake. Teams see at a glance whether their pipelines meet reliability thresholds and which specific rules are pulling their score down. When a service drops below a tier, workflows can notify the owning team or create a remediation ticket automatically.
Example scenario
A platform team suspects that flaky pipelines are slowing down delivery but can't quantify the impact. They set up a Pipeline Reliability scorecard with thresholds: Gold requires 95%+ success rate and build times under 10 minutes, Silver allows up to 85% success rate, and Bronze flags anything below. The scorecard reveals that 6 of 20 services are at Bronze all with success rates below 80%. Three of those share a common test dependency that's been producing intermittent failures for months. The platform team fixes the shared dependency, and all three services jump to Silver within a week.
Example dashboard
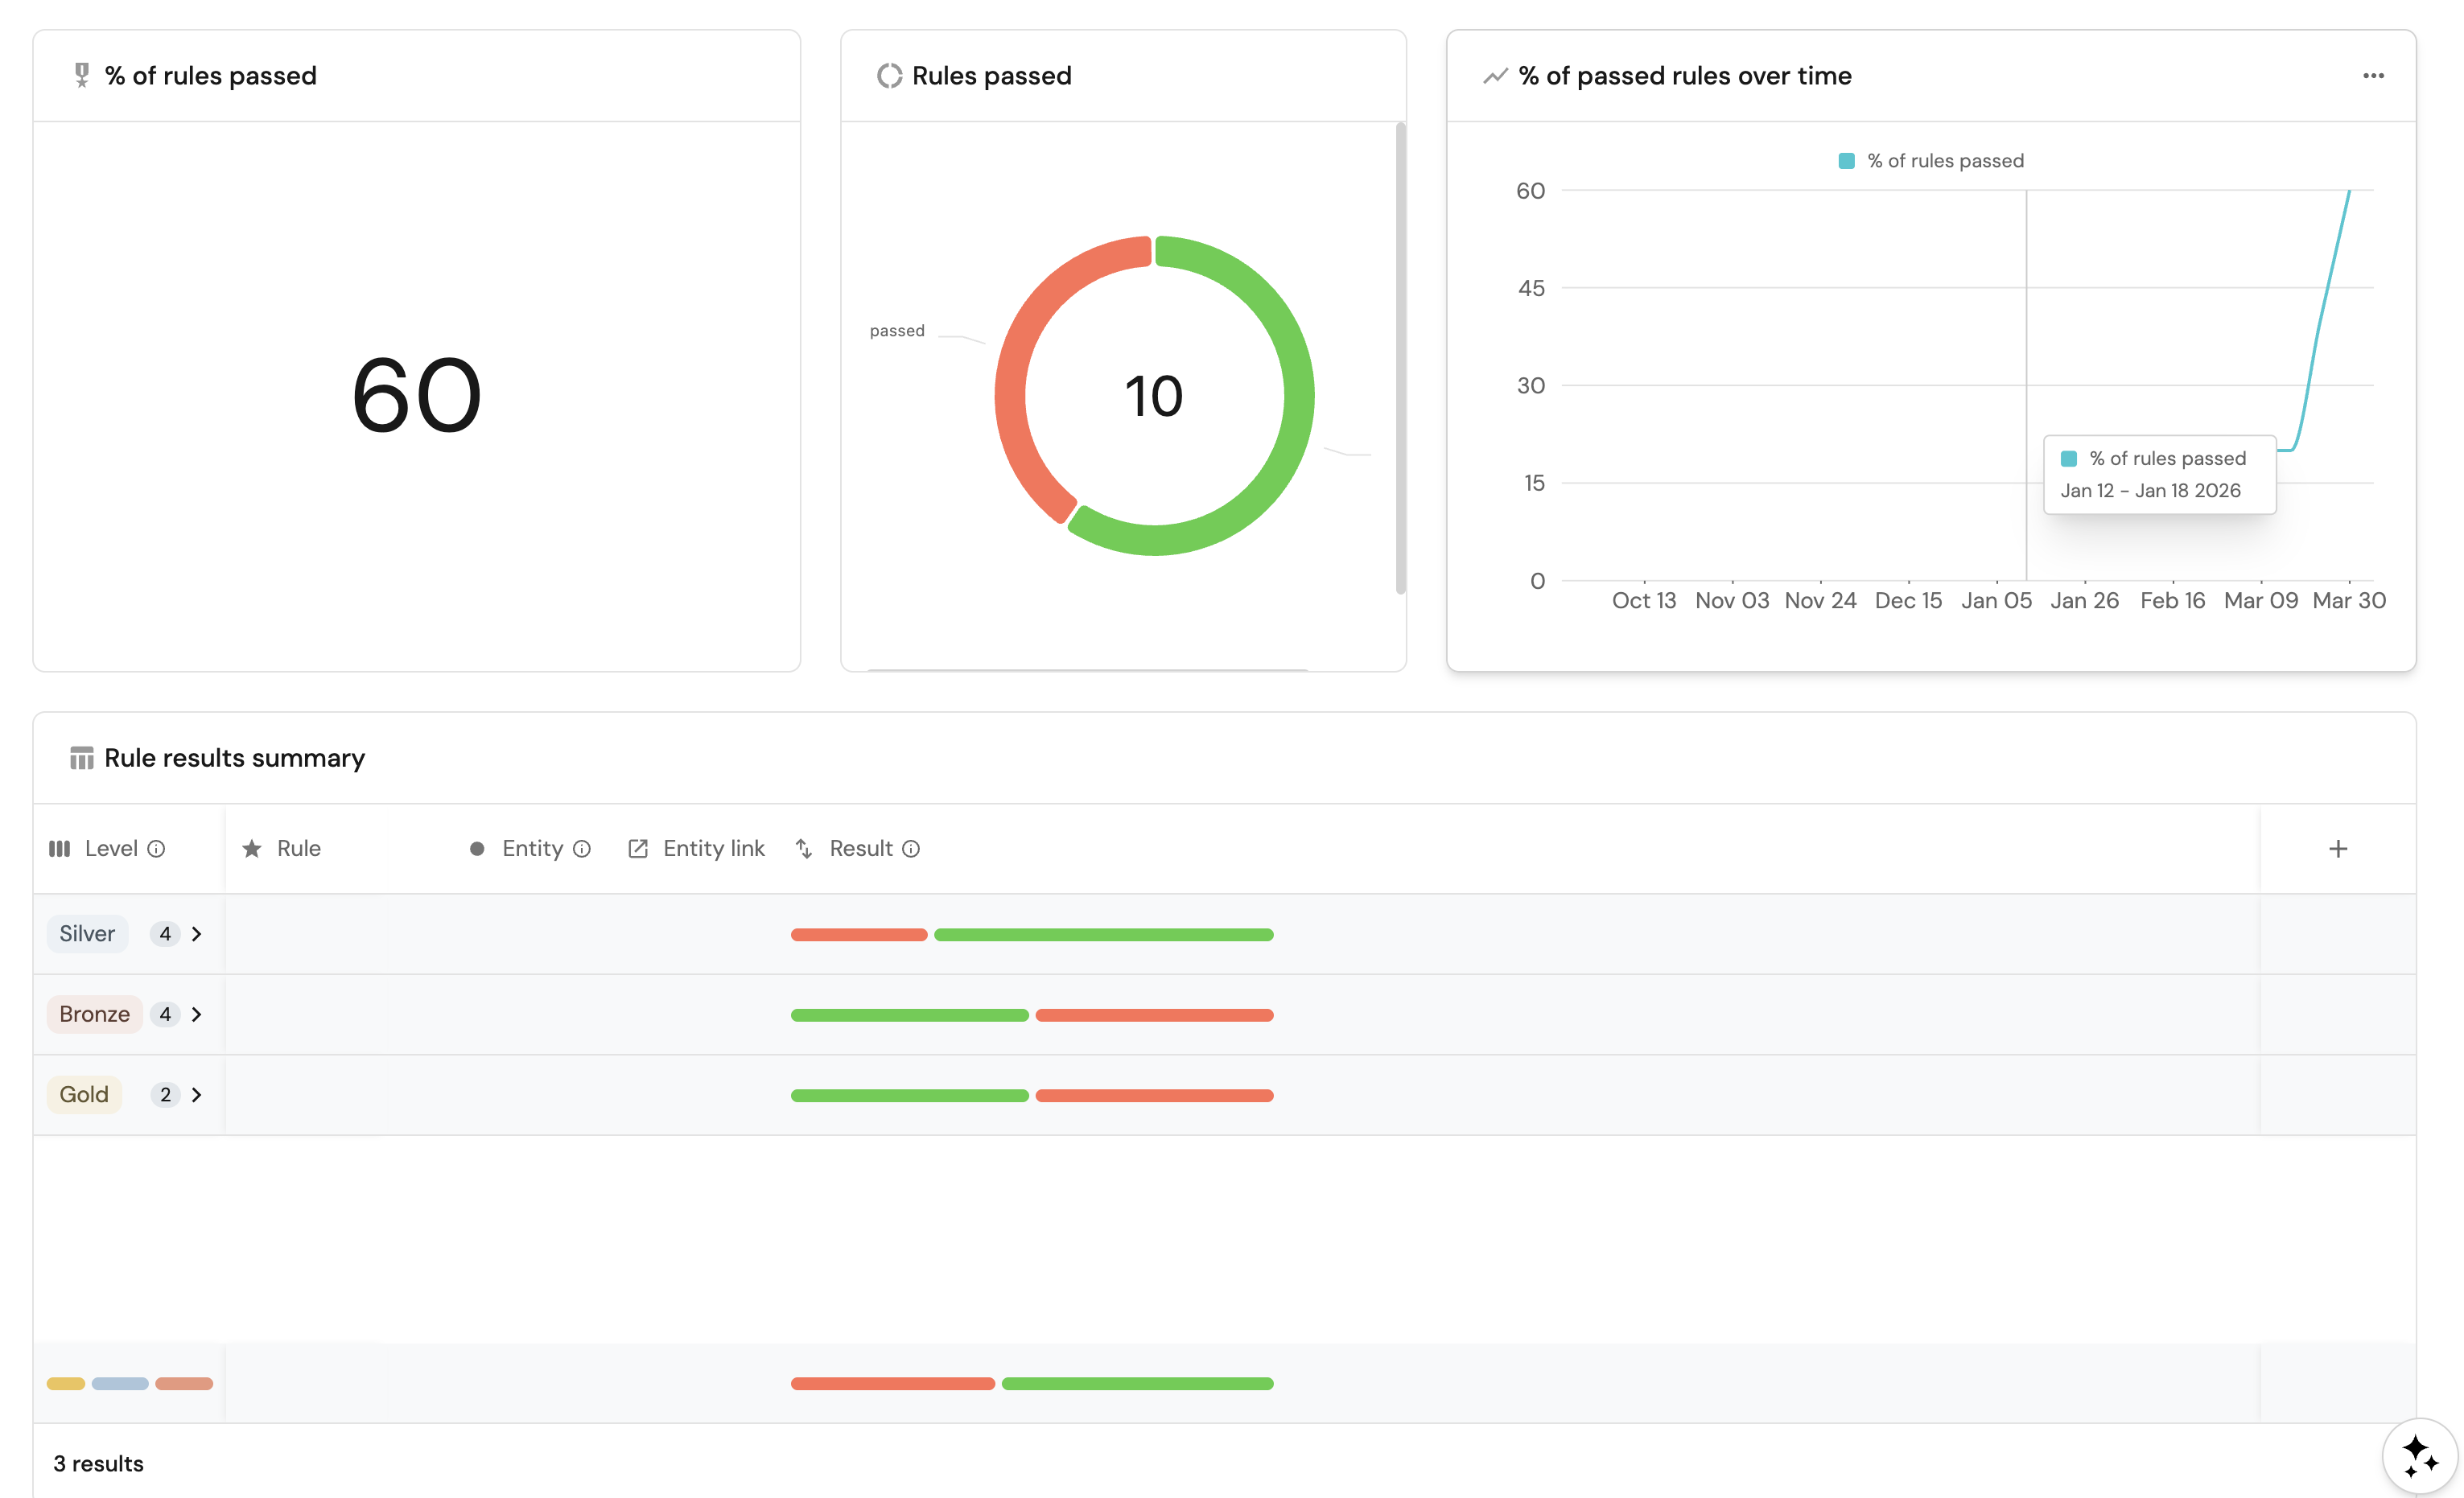
Example Pipeline Reliability scorecards dashboard based on Setup Pipeline Reliability scorecard guide.
Follow the recommended guides below to implement this use case.