Measure reliability & stability
Why it matters
Service reliability directly impacts user experience and business outcomes. Without visibility into SLOs, SLIs, and incident patterns, teams can't tell whether their services are meeting expectations or silently degrading. Tracking reliability at the service level not just the pipeline level gives engineering leaders a clear picture of production health and helps prioritize where to invest in stability.
What to track
- SLO compliance: Whether services are meeting their defined Service Level Objectives.
- SLI trends: How Service Level Indicators (latency, error rate, availability) change over time.
- Incident frequency: How often services experience production incidents, and whether the trend is improving.
- Service stability: Which services are consistently reliable and which are frequent sources of issues.
How Port helps
Port connects observability data from tools like New Relic, Datadog, and PagerDuty with your software catalog & context lake. SLOs and SLIs are linked to the services and teams that own them, so you see reliability in context not as isolated metrics in a monitoring tool. Dashboards show which services are meeting their objectives and which are at risk, while scorecards grade services against your reliability standards.
Example scenario
An SRE team notices that three services have breached their SLO targets over the past month, but incident tickets only captured one of them. By connecting New Relic SLI data to Port, they see that error rate SLIs for the other two services have been trending upward for weeks, slow enough to avoid triggering alerts but steady enough to erode the SLO budget. They proactively address the root causes before users are impacted.
Example dashboard
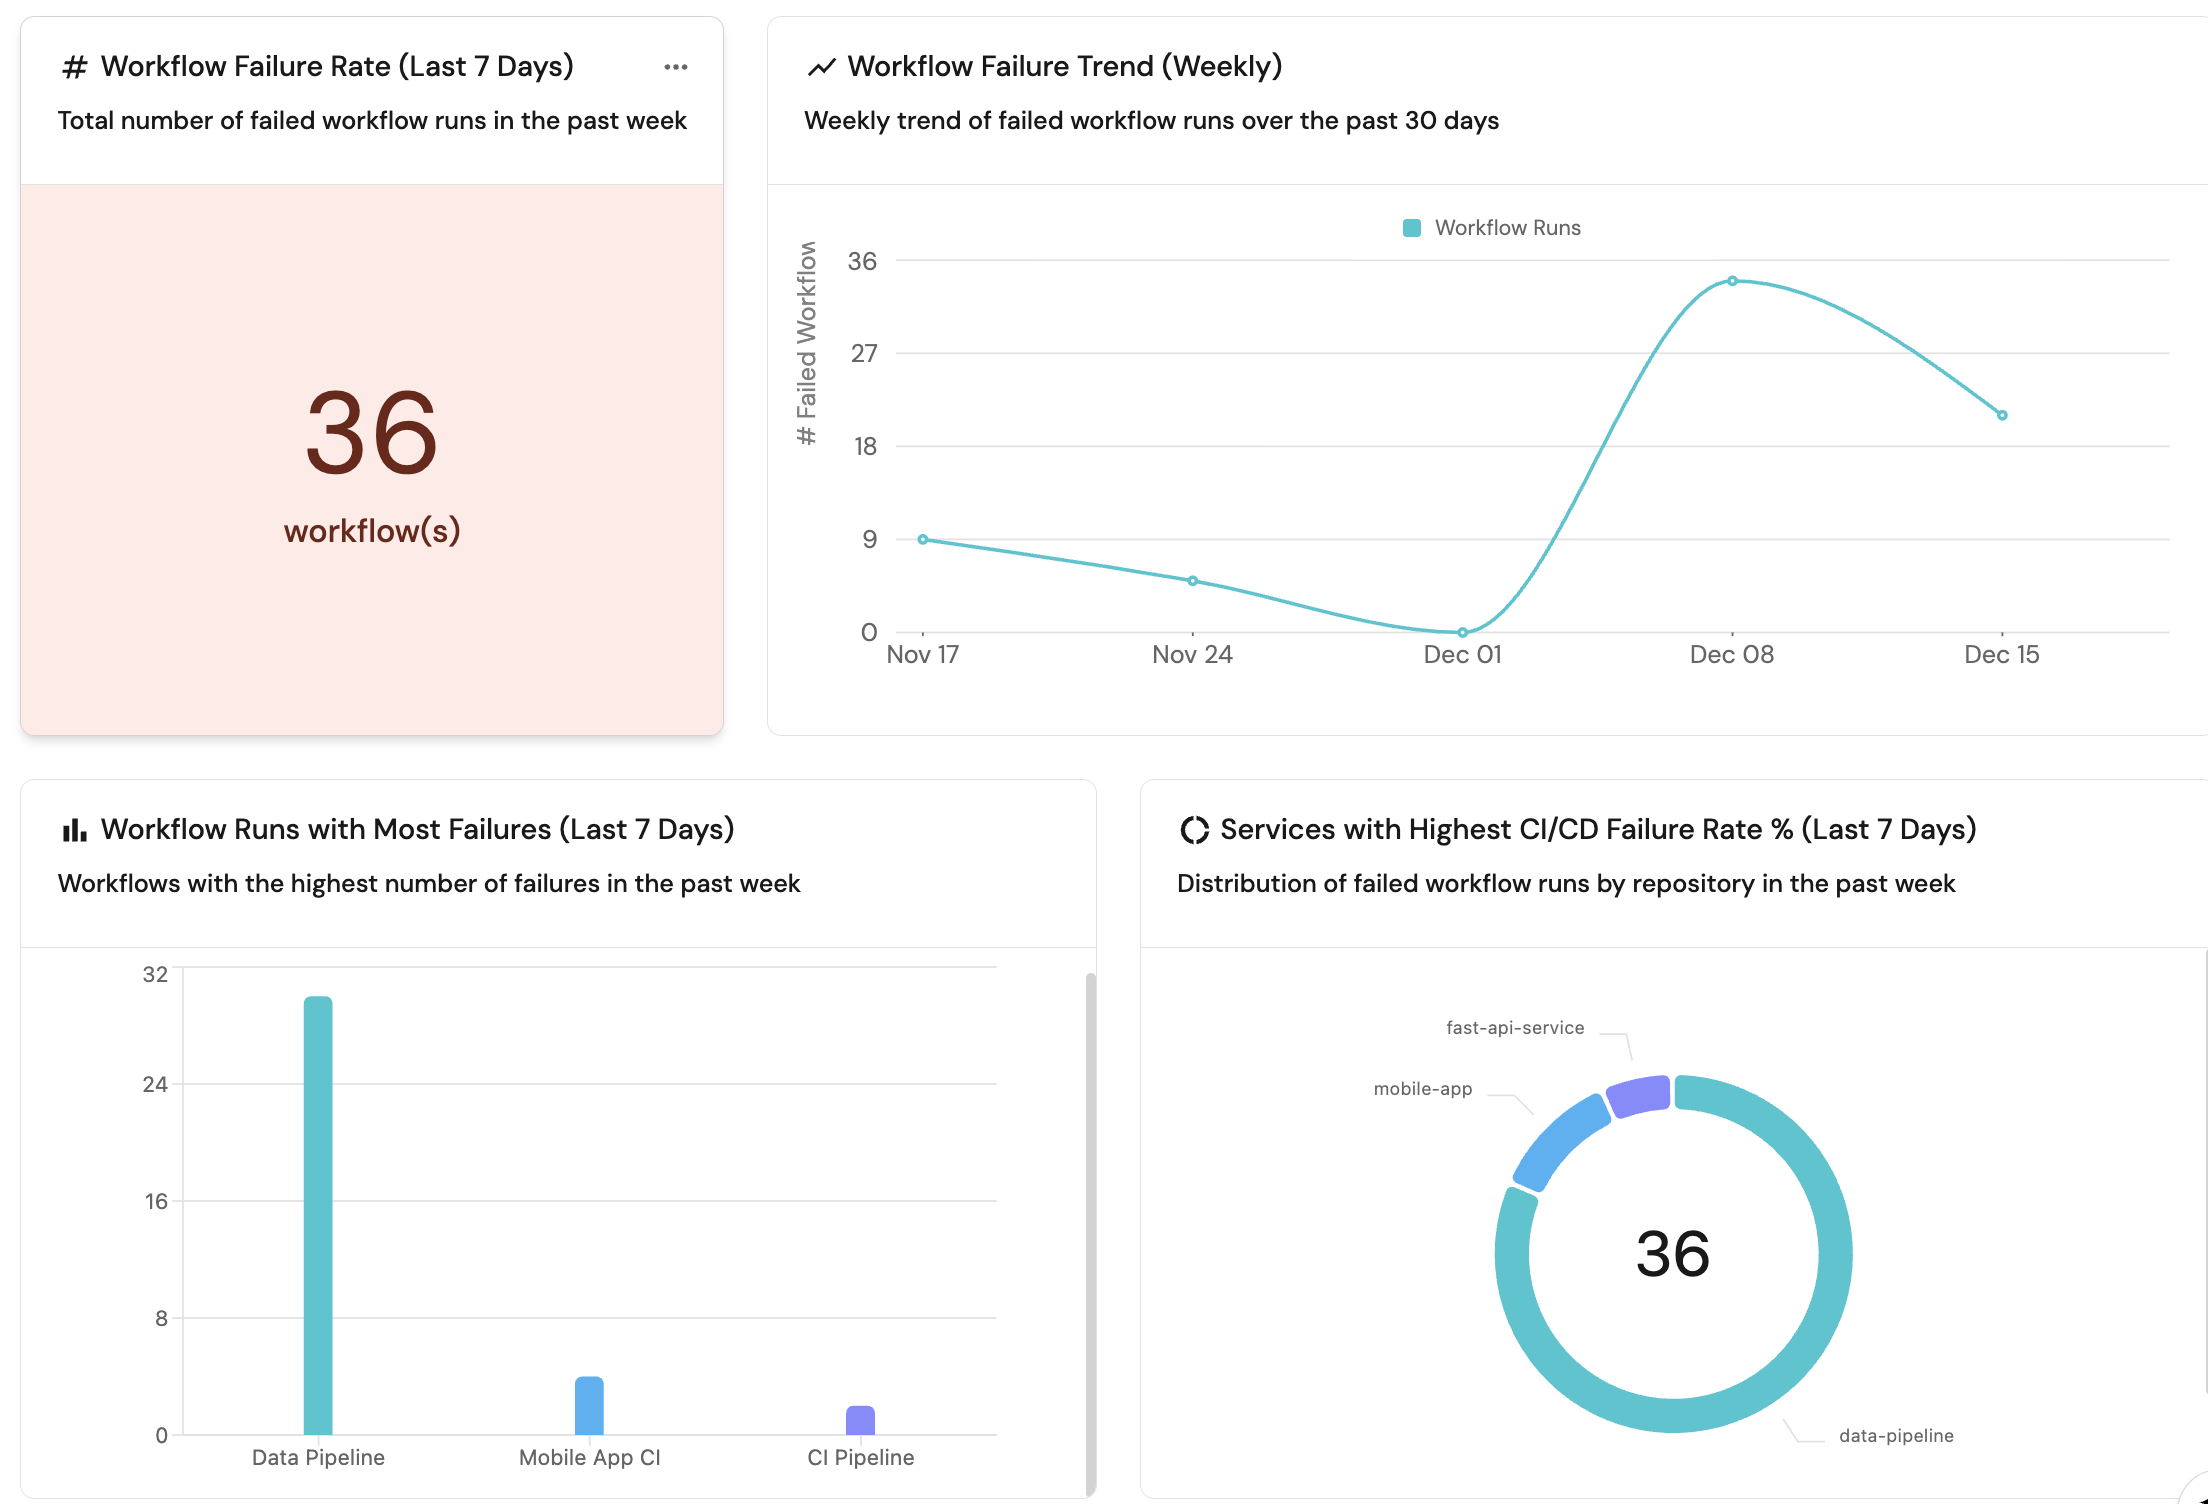
Example reliability dashboard based on Track SLOs and SLIs for services guide.
Follow the recommended guides below to implement this use case.