Run developer surveys
Why it matters
Quantitative metrics show what's happening. Surveys reveal why. Developers can tell you about pain points that metrics miss, unclear processes, poor tooling ergonomics, context-switching overhead, or cultural friction. Without surveys, engineering leaders optimize for what's measurable and miss what actually matters most to their teams.
What to track
- Participation rate: What percentage of developers completed the survey.
- Top pain points: Recurring themes across responses (slow reviews, flaky pipelines, unclear ownership).
- Satisfaction trends: How sentiment changes over time as improvements are made.
- Segment differences: Whether pain points vary by team, tenure, or role.
How Port helps
Port provides a native survey experience using self-service actions and the software software catalog & context lake. Responses are stored as catalog entities, so you can correlate sentiment with quantitative metrics, for example, comparing satisfaction scores with DORA metrics or pipeline failure rates. Port automations can also trigger surveys contextually at the right moment in a developer's workflow.
Example scenario
A platform team launches their first developer survey using Port. They trigger it contextually: new hires get an onboarding feedback survey after their 10th PR, and incident responders get a process feedback survey after each incident closes. Participation hits 78% far higher than the 30% they saw with their previous annual email survey because surveys arrive at moments when developers have something specific to say.
Example dashboard
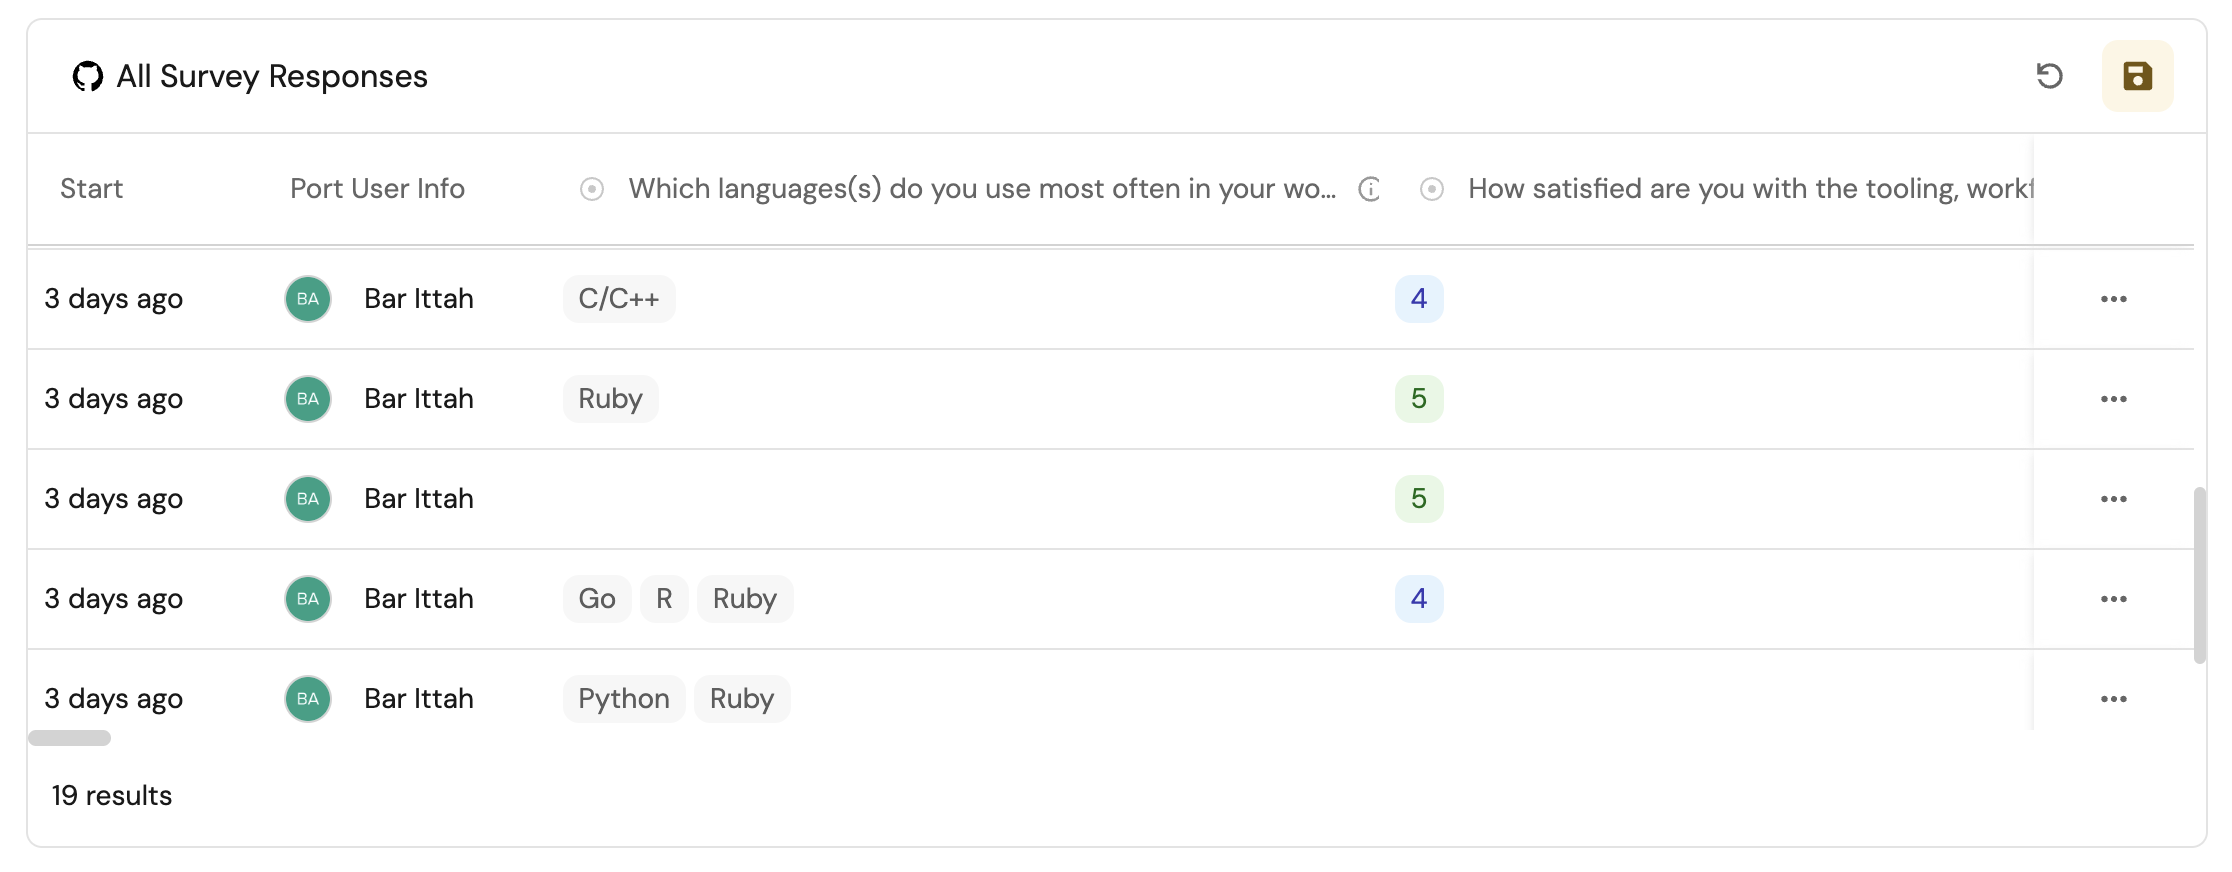
Example survey results dashboard based on Create and use surveys in Port guide.
Follow the recommended guides below to implement this use case.