Reliability
Why it matters
Unreliable CI/CD pipelines silently erode developer productivity. Every flaky test, intermittent build failure, or manual re-run costs time and breaks flow. Worse, teams learn to distrust their pipelines and work around them, skipping checks, batching changes, or delaying deployments. Tracking pipeline reliability exposes these hidden costs before they compound into delivery slowdowns.
Without a scorecard to grade pipeline health, reliability issues stay invisible until they cause a major delivery slowdown or outage. Pipeline reliability scorecards turn metrics into graded maturity levels so teams know exactly where they stand.
What to track
- Workflow failure rate: Percentage of pipeline runs that fail per service or team.
- Re-run rate: How often pipelines are manually retried, indicating flakiness rather than genuine failures.
- Pipeline duration: End-to-end time from trigger to completion, broken down by stage (build, test, deploy).
- Failure concentration: Whether failures are spread evenly or concentrated in specific services, stages, or times of day.
- Flaky test rate: Percentage of pipeline failures caused by non-deterministic tests rather than real code issues.
Measure pipeline reliability
Port ingests CI/CD workflow data from GitHub Actions, GitLab CI, and Azure Pipelines and links every run to the service, team, and recent changes in your software catalog & context lake.
Example scenario
A platform team sets up pipeline reliability tracking and discovers that 4 out of 30 services account for 60% of all workflow failures. Two of these services have re-run rates above 40%, pointing to flaky integration tests rather than real bugs. The team prioritizes stabilizing those test suites. Within a month, overall pipeline failure rate drops from 18% to 7%, and developers report noticeably fewer blocked PRs.
Example dashboard
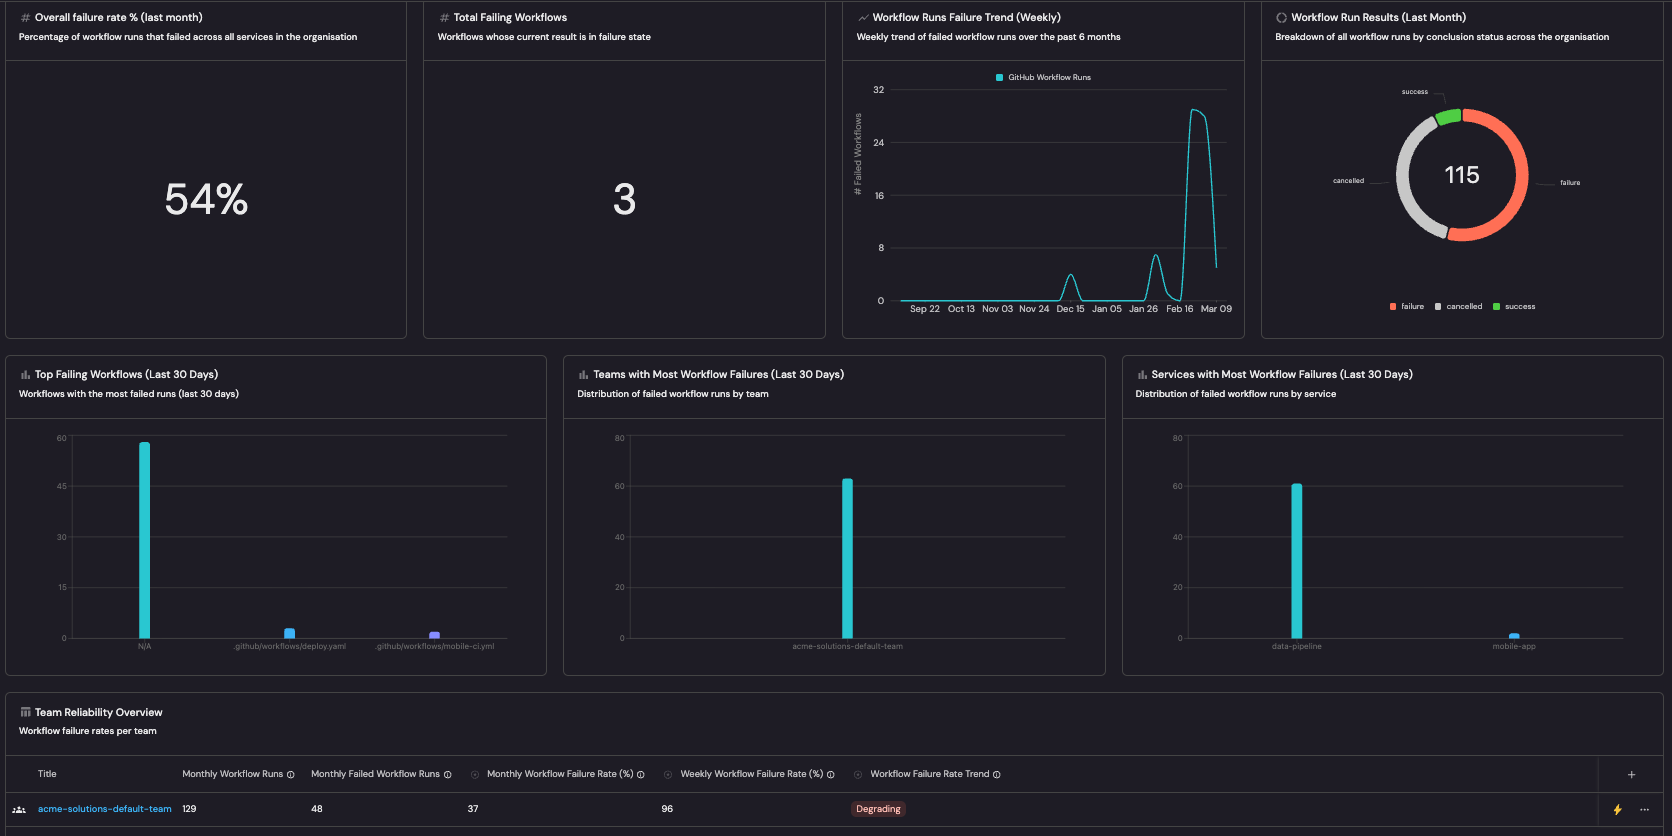
Example pipeline reliability dashboard based on Measure pipeline reliability guide.
Pipeline reliability scorecards
Port's pipeline reliability scorecards evaluate every service and team against CI/CD health metrics using Bronze, Silver, and Gold maturity levels. Pipeline data flows in from GitHub Actions, GitLab CI, Azure Pipelines, and other CI/CD tools, linked to services and teams in your software catalog & context lake. When a service drops below a tier, workflows can notify the owning team or create a remediation ticket automatically.
Example scenario
A platform team suspects that flaky pipelines are slowing down delivery but can't quantify the impact. They set up a Pipeline Reliability scorecard with thresholds: Gold requires 95%+ success rate and build times under 10 minutes, Silver allows up to 85% success rate, and Bronze flags anything below. The scorecard reveals that 6 of 20 services are at Bronze all with success rates below 80%. Three of those share a common test dependency that's been producing intermittent failures for months. The platform team fixes the shared dependency, and all three services jump to Silver within a week.
Example dashboard
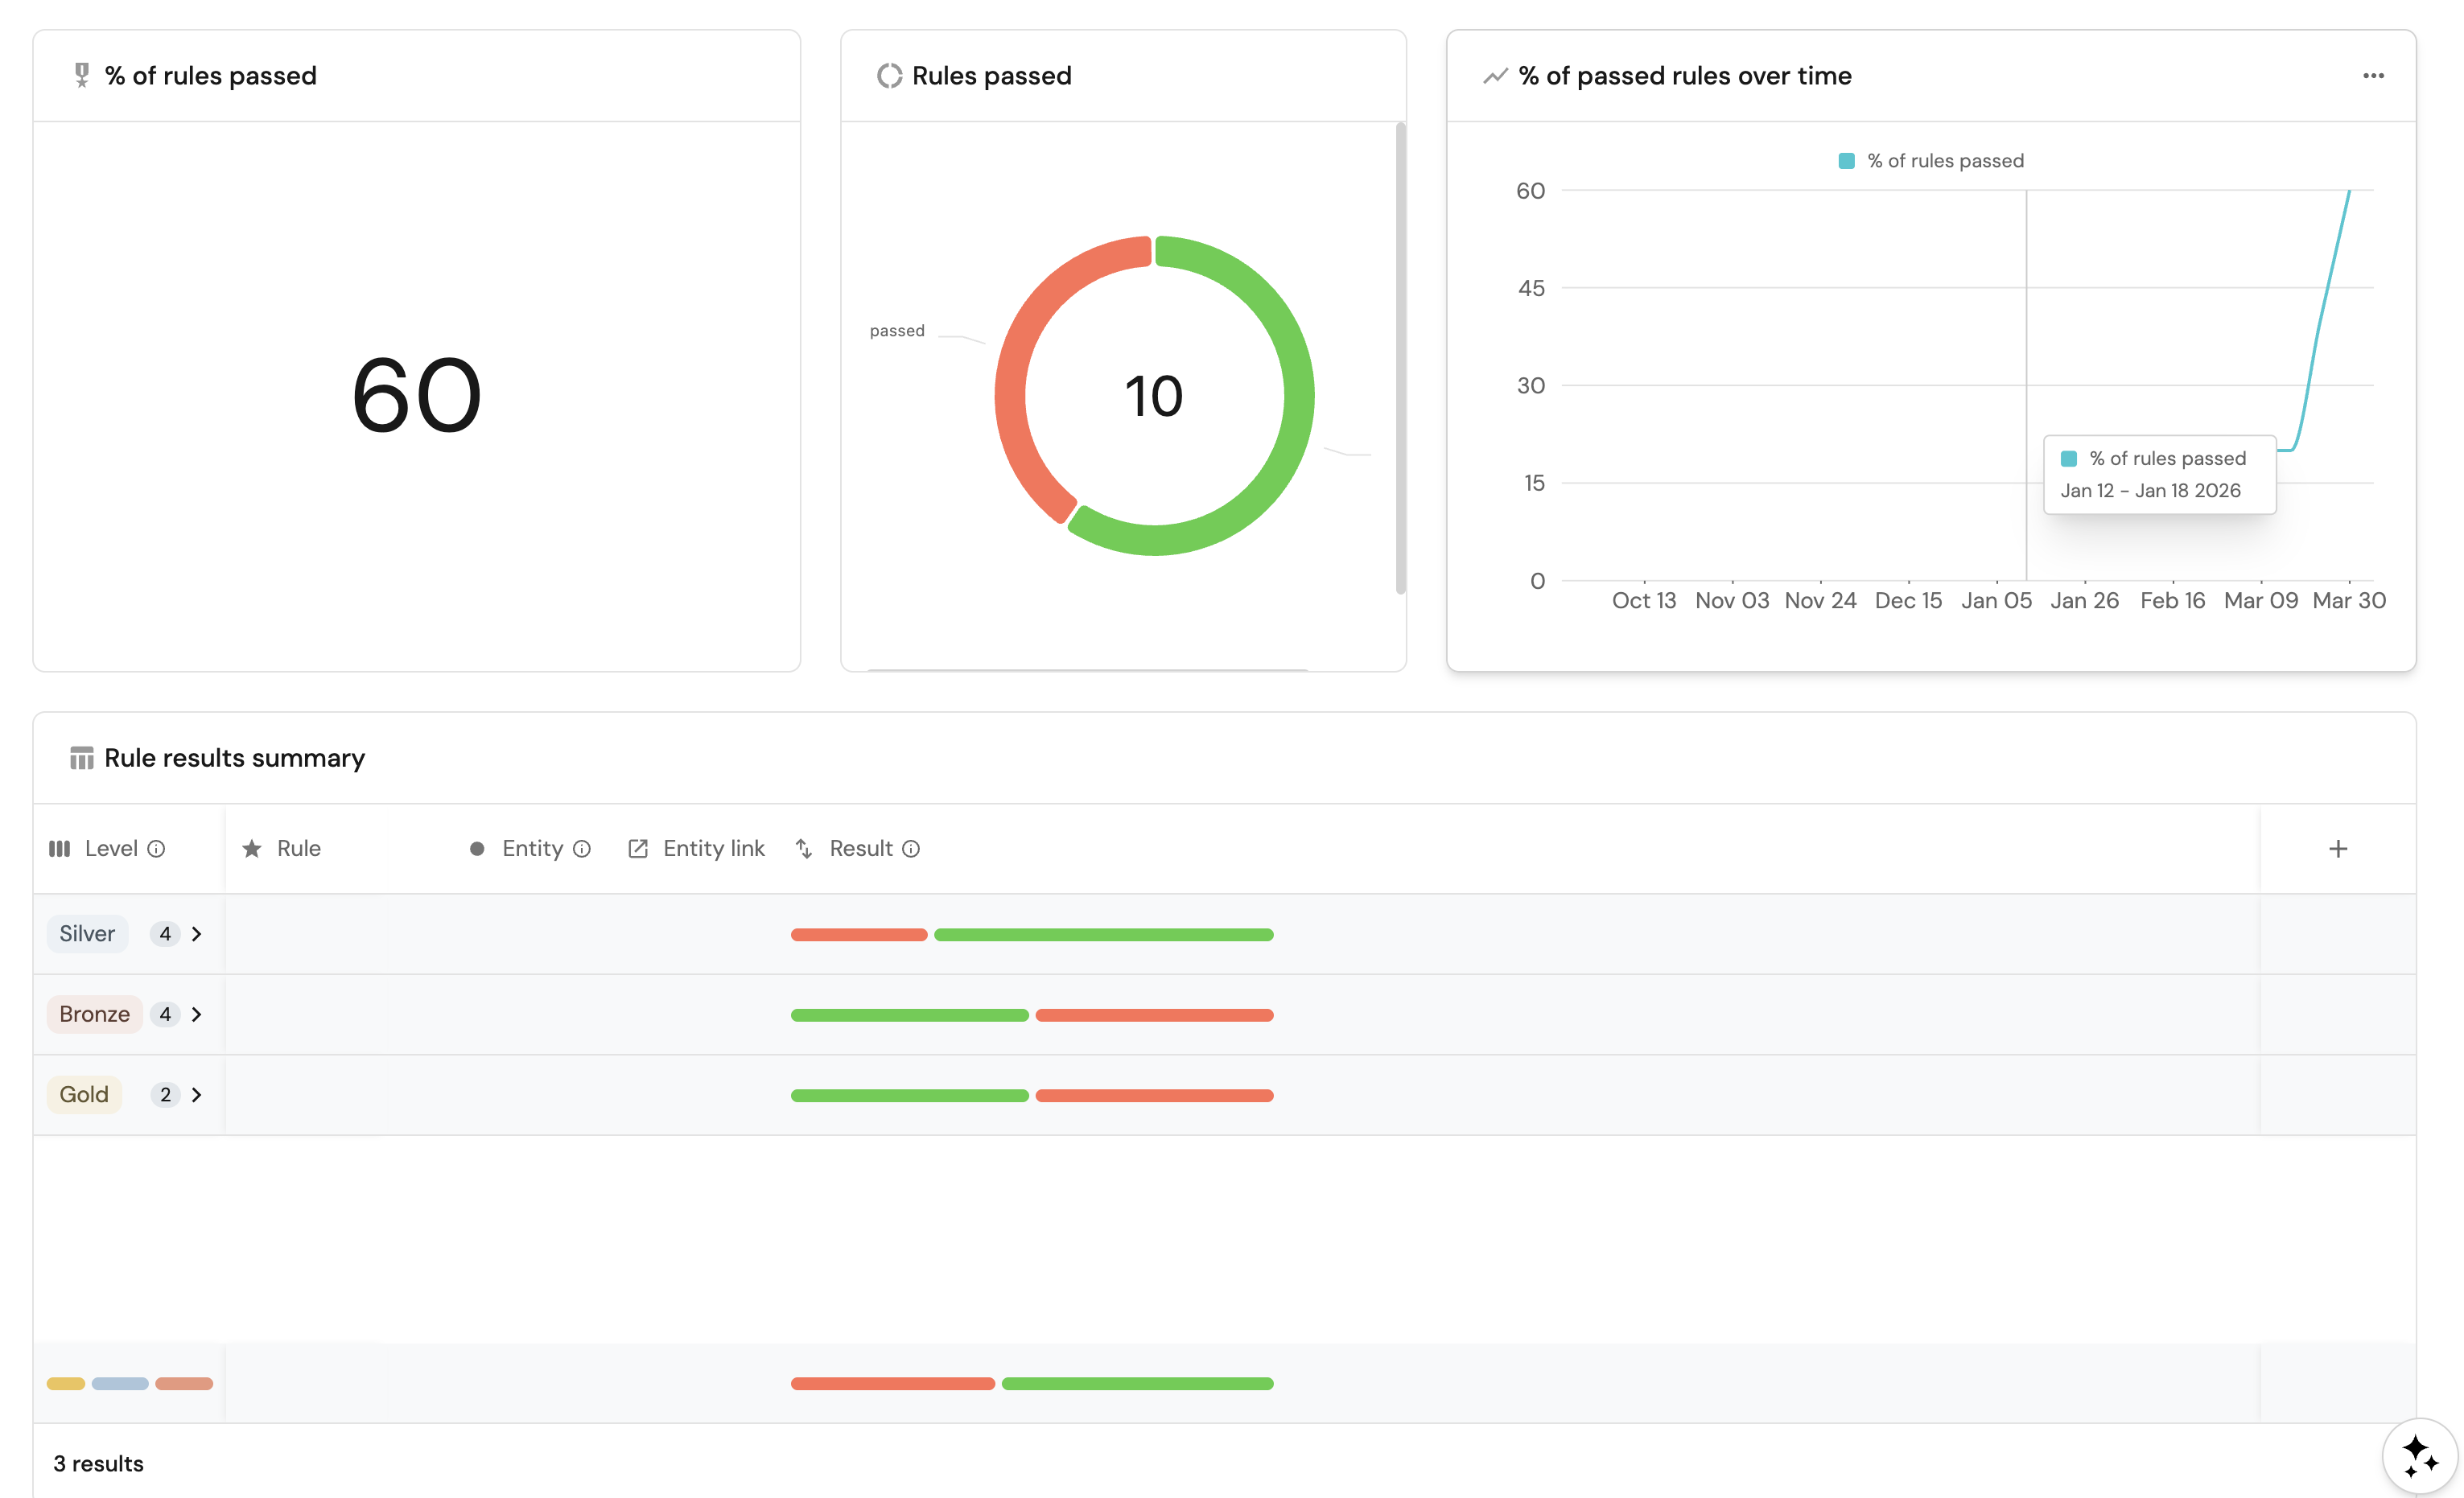
Example Pipeline Reliability scorecards dashboard based on Setup Pipeline Reliability scorecard guide.
Follow the recommended guides below to implement this use case.