Delivery performance
Why it matters
Pull request metrics are the most direct signal of how efficiently work moves through your development pipeline. High PR throughput with low cycle time indicates a healthy delivery process. Stale PRs and poor standards compliance signal bottlenecks that compound over time slowing delivery, frustrating developers, and hiding risks.
Teams can track PR throughput and cycle time all day, but without defined thresholds, there's no shared understanding of what "good" looks like. Delivery performance scorecards codify these expectations into measurable standards so every team knows where they stand and what to aim for.
What to track
- PR throughput: Number of pull requests opened and merged per team or service over time.
- Cycle time: Time from PR creation to merge, broken down by coding, review, and merge phases.
- Stale PRs: Pull requests open longer than your team's agreed threshold, indicating review bottlenecks or abandoned work.
- PR standards compliance: Whether PRs meet your team's conventions: description quality, labels, linked issues, and reviewer assignment.
Measure PR delivery metrics
Port ingests PR data from GitHub, GitLab, and Azure DevOps and links every PR to the service, team, and owner in your software catalog & context lake. Instead of aggregate numbers, you see throughput and cycle time per service and team making it easy to spot which teams are healthy and which are falling behind.
Example scenario
An engineering director reviews the Delivery Performance dashboard and notices that one team's PR cycle time has increased from 1 day to 4 days over the past month. Drilling in, they see that stale PRs have tripled and most are waiting on a single reviewer who's been pulled onto an incident response rotation. They redistribute review assignments and set up automated Slack alerts for PRs approaching the 48-hour SLA. Cycle time drops back to 1.5 days within two weeks.
Example dashboard
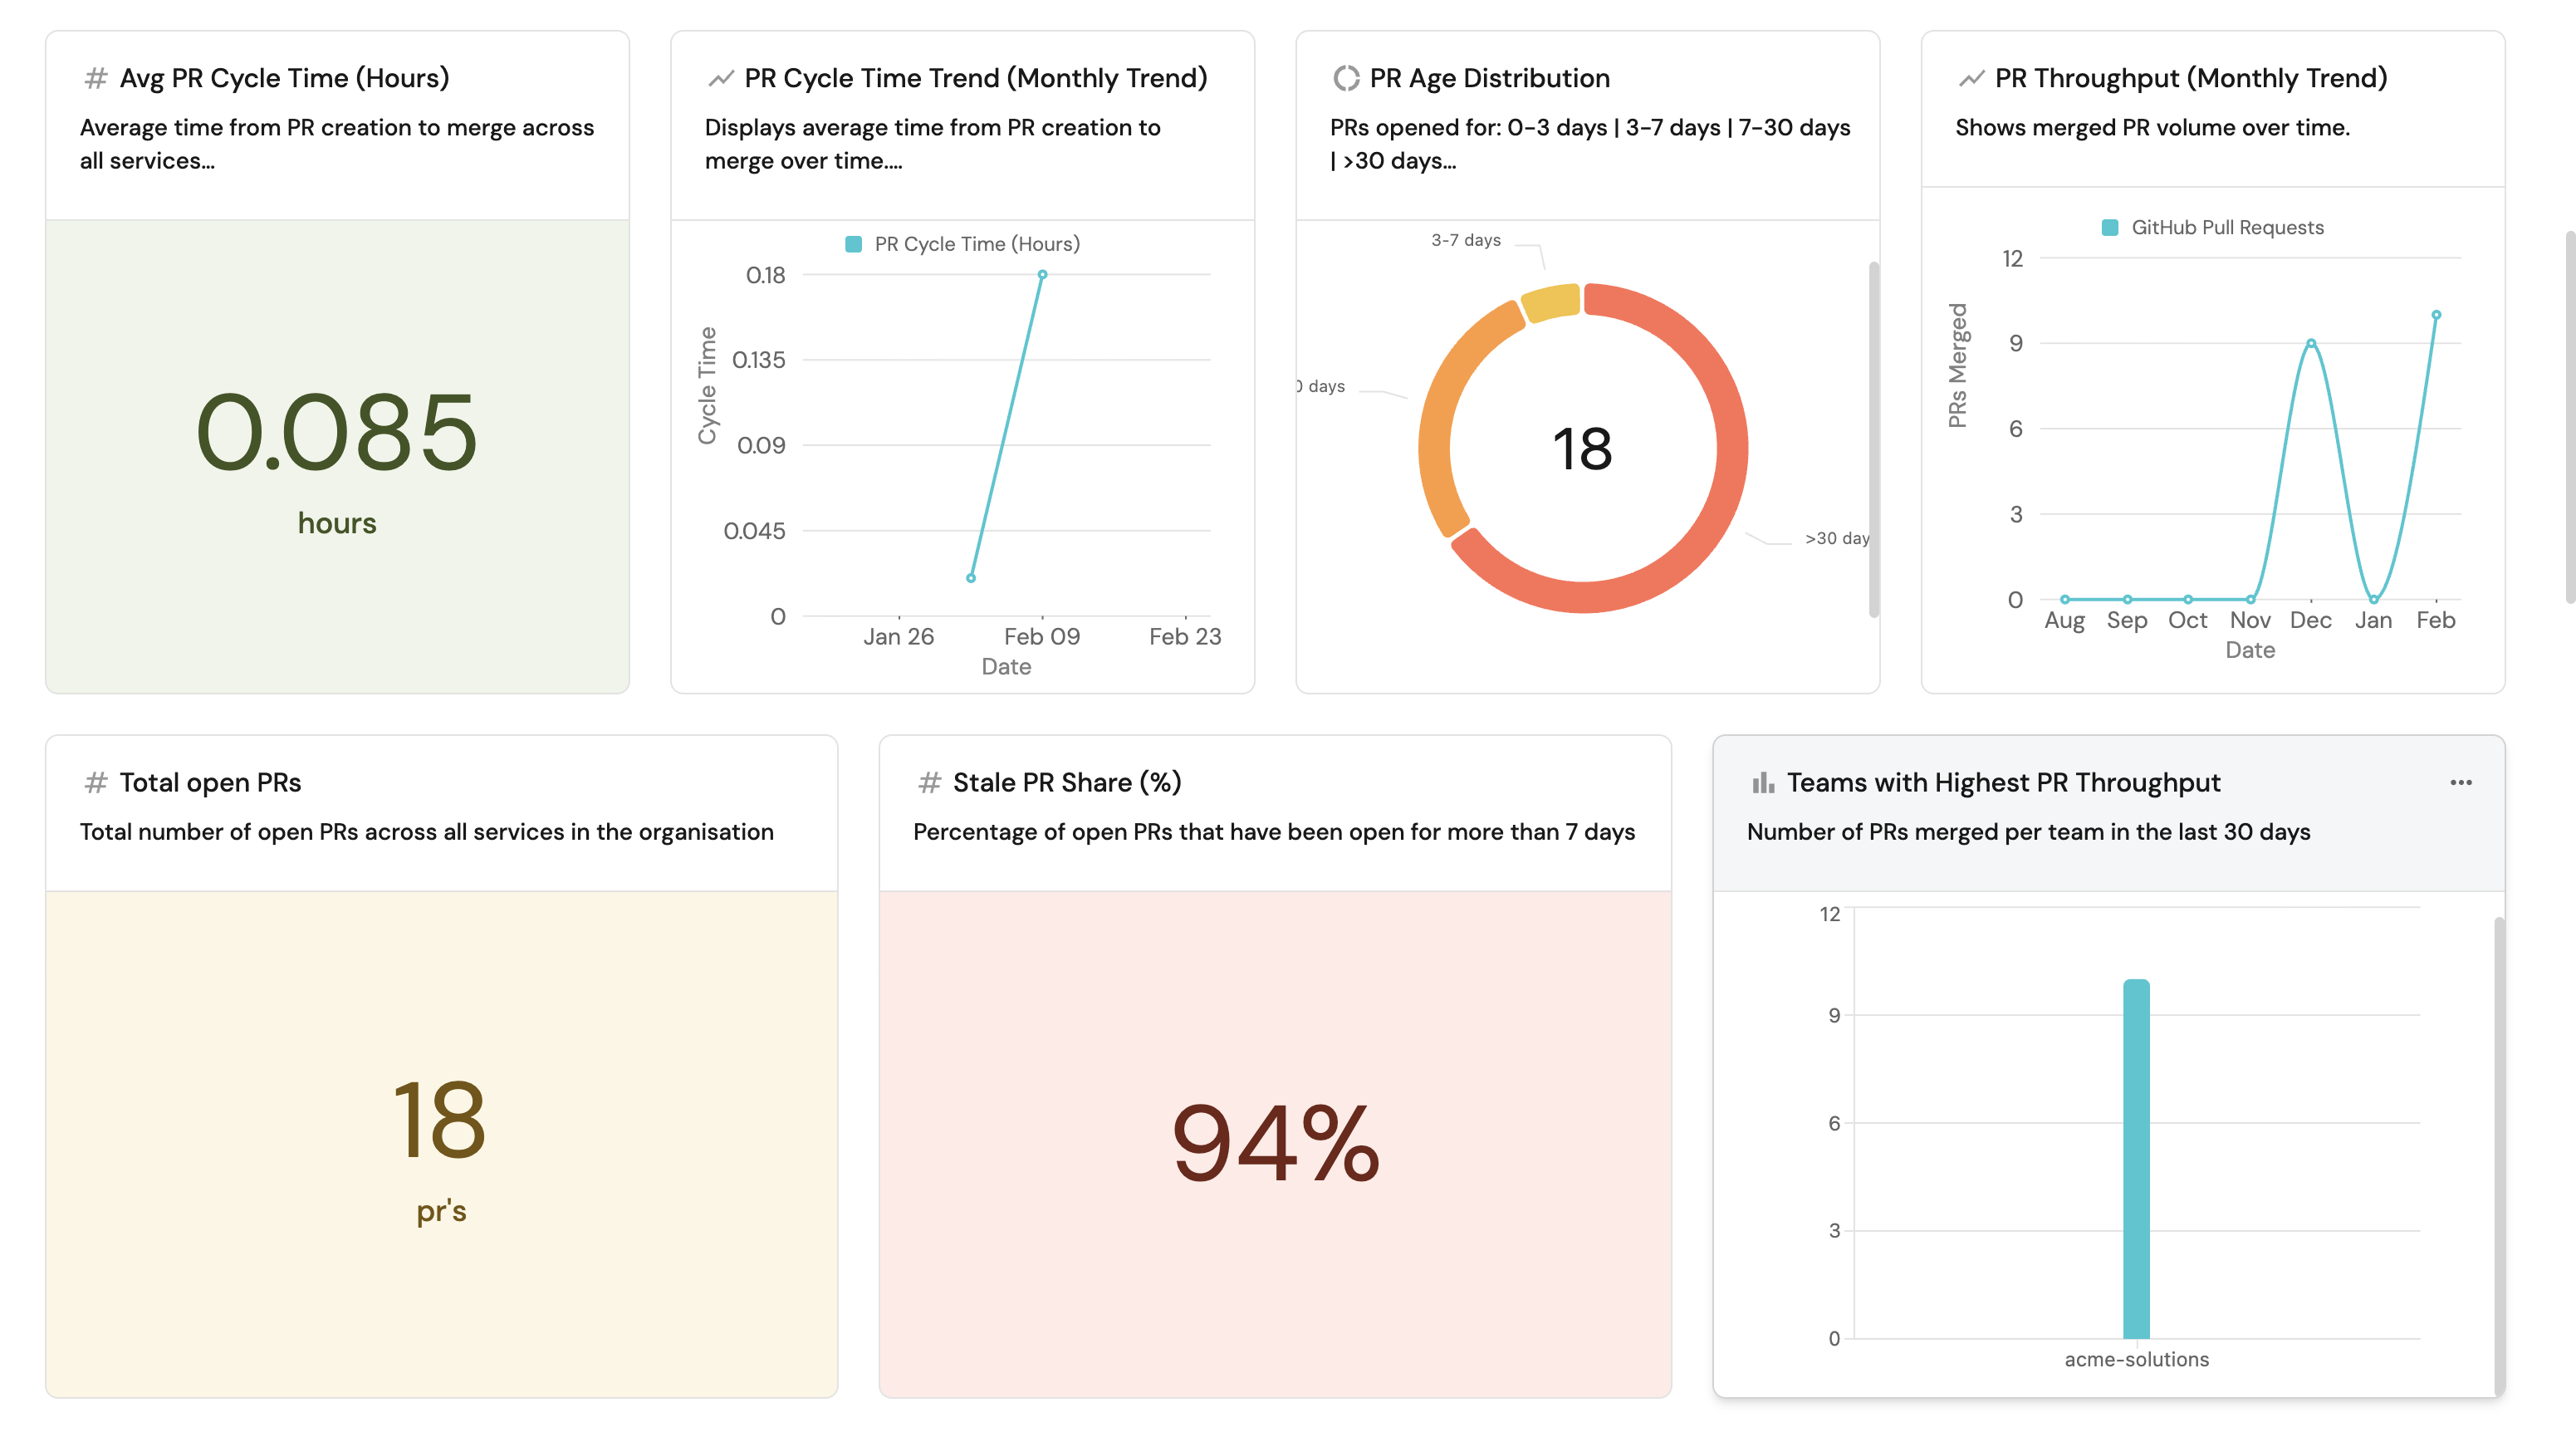
Example PR delivery metrics dashboard based on Measure PR delivery metrics guide.
Delivery performance scorecards
Port's delivery performance scorecards evaluate every service and team against PR and delivery metrics using Bronze, Silver, and Gold maturity levels. Rules are configured with your own thresholds whether that's cycle time under 24 hours for Gold or zero stale PRs for Silver. Scores update continuously as PR data flows in from GitHub, GitLab, or Azure DevOps. Teams see exactly which rules they pass and which drag their score down, making improvement actionable rather than abstract.
Example scenario
An engineering manager notices their org's average PR cycle time is 2.5 days but suspects the average hides wide variation. They set up a Delivery Performance scorecard with tiered thresholds: Gold requires cycle time under 1 day with zero stale PRs, Silver allows up to 2 days, and Bronze flags anything above 3 days. The scorecard reveals that 4 of 10 teams are at Bronze all with high stale PR counts. Two of those teams discover their bottleneck is a single senior reviewer approving every PR. They adopt a round-robin review policy, and within three weeks both teams move from Bronze to Silver.
Example dashboard
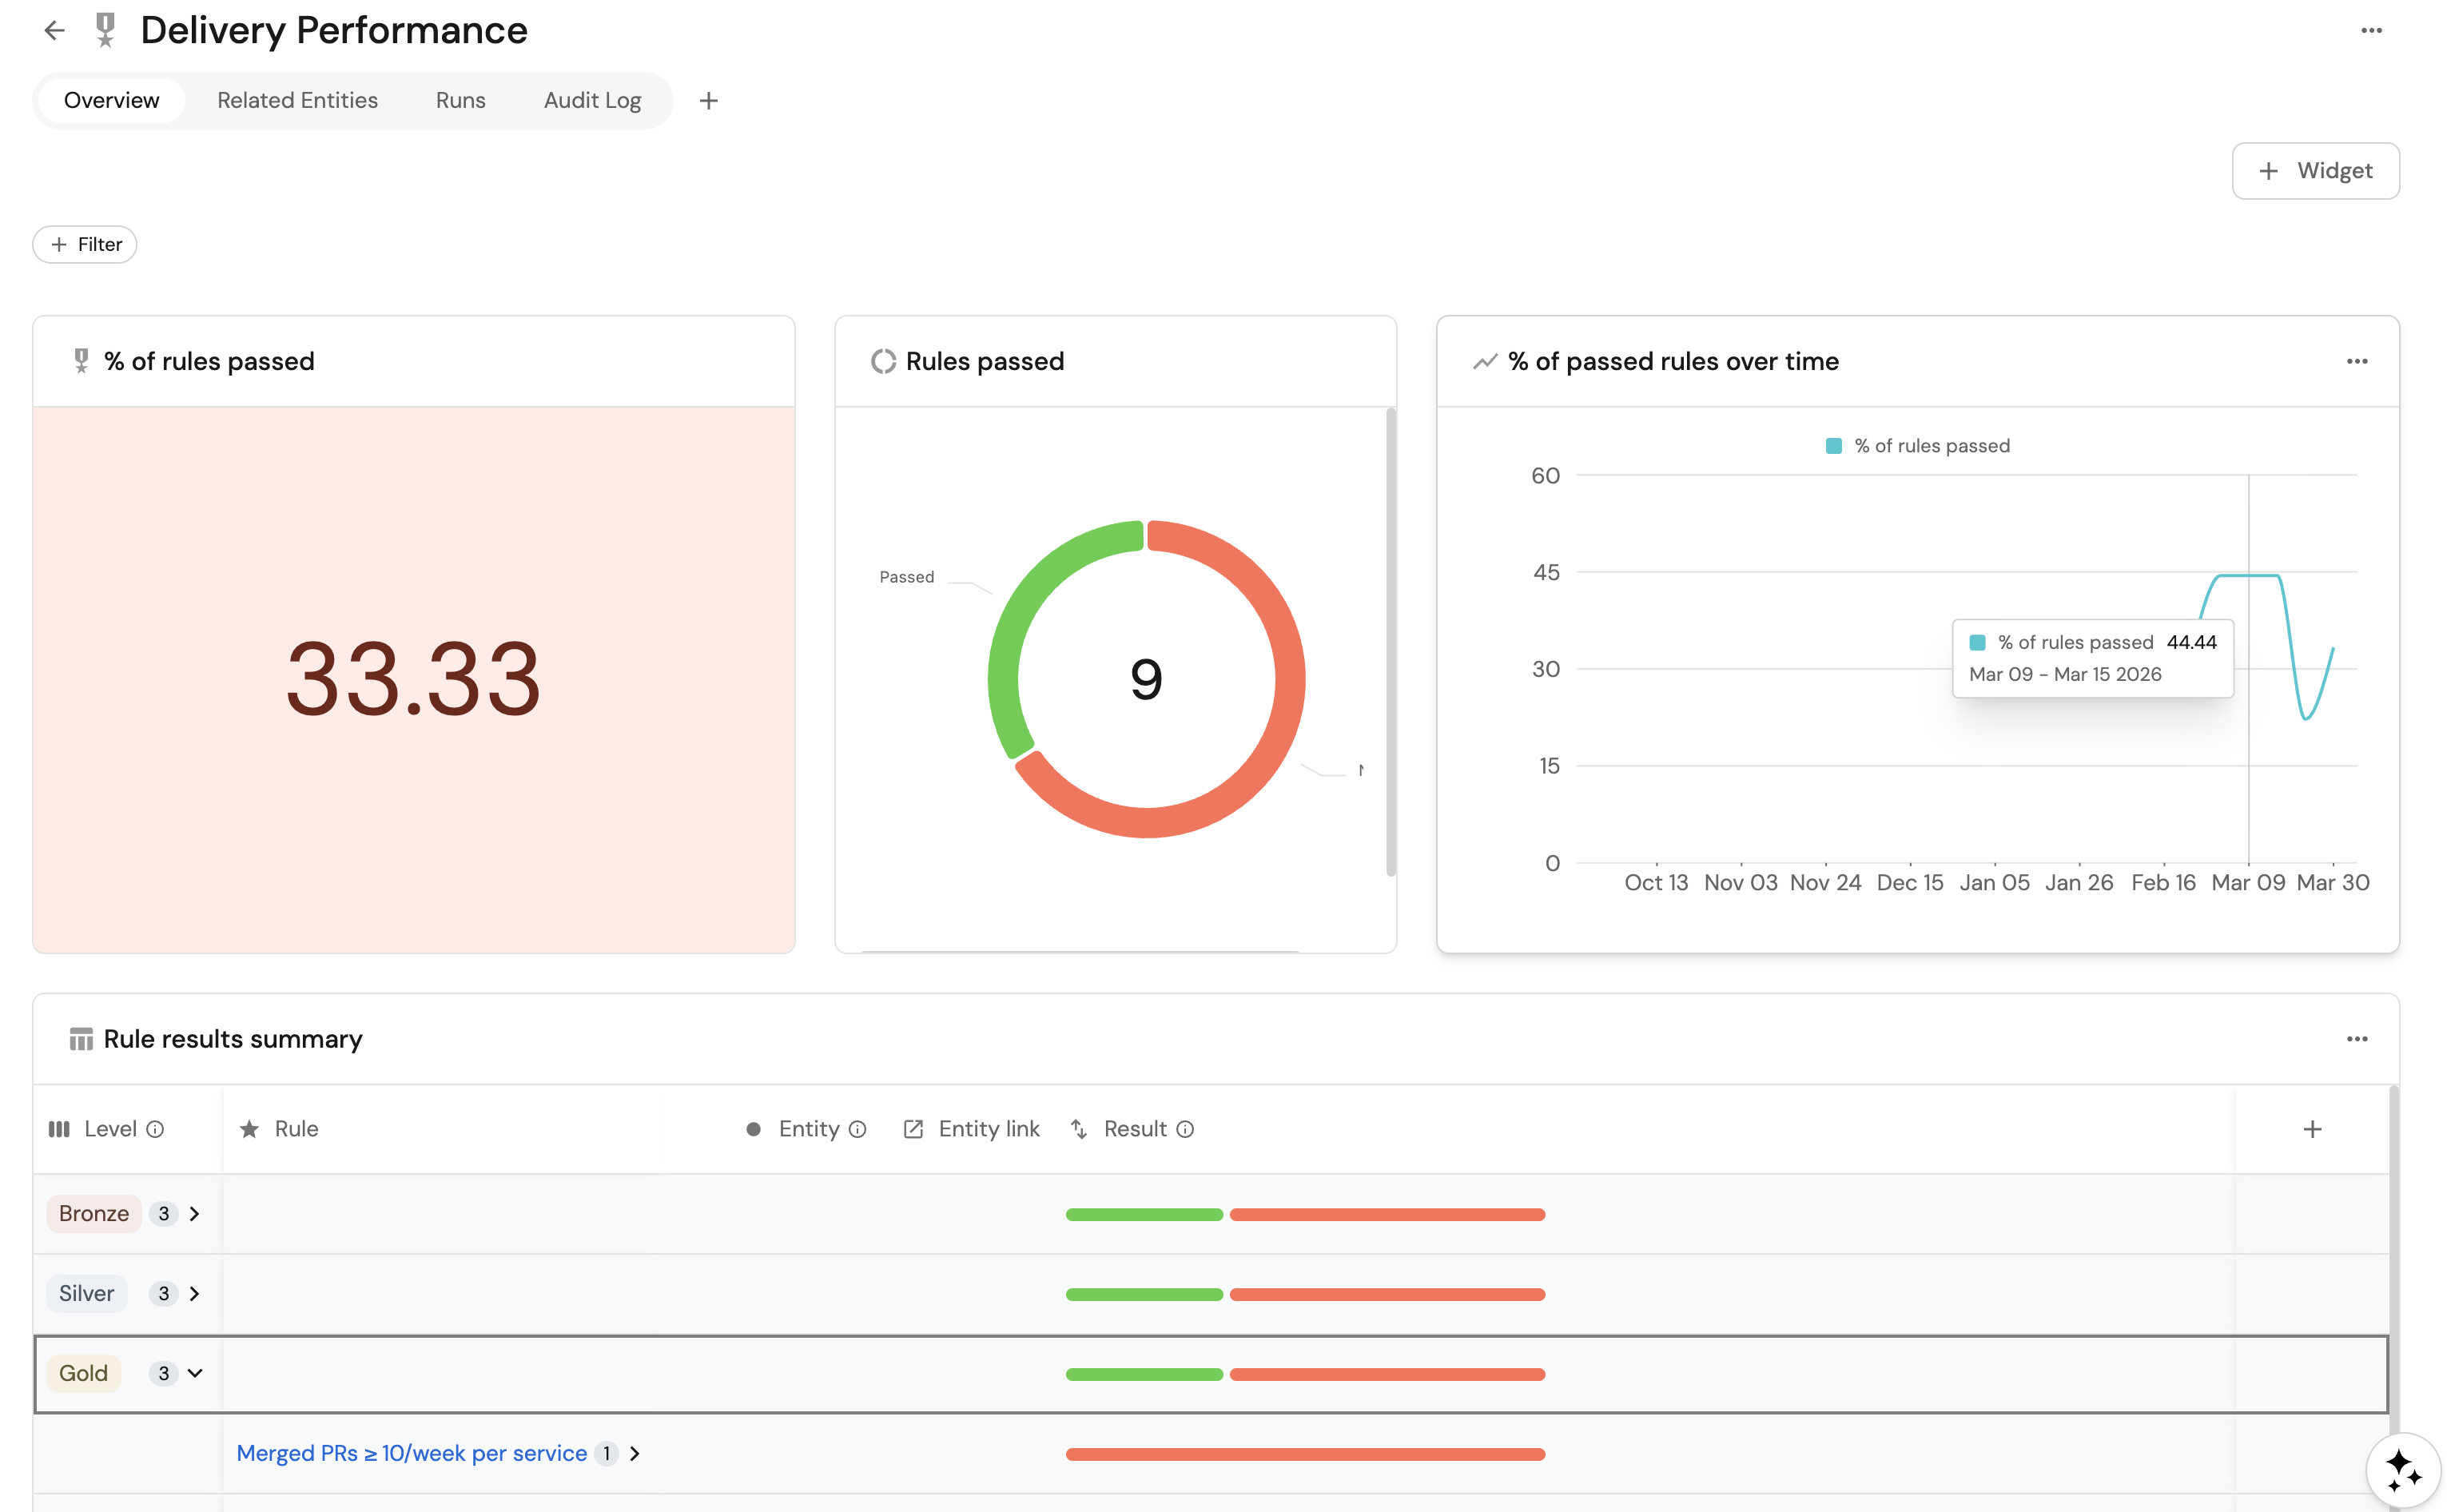
Example Delivery Performance scorecards dashboard based on Setup Delivery Performance scorecard guide.
Follow the recommended guides below to implement this use case.
Recommended guides
- Measure PR delivery metrics
- Setup Delivery Performance scorecard
- Nudge PR reviewers - Send automated Slack reminders to reviewers of stale pull requests.