DevEx surveys
Quantitative metrics show what's happening. Surveys reveal why. Developer experience surveys surface pain points that metrics miss and close the loop from feedback to measurable improvement.
Follow the recommended guide below to implement this use case.
Recommended guides
- Create Survey Intelligence - deploy the Survey Builder, Survey Forms, and Survey Analytics plugins for a complete end-to-end survey experience.
- AI adoption survey - the same plugins, focused specifically on AI tooling adoption and impact.
Design & launch surveys
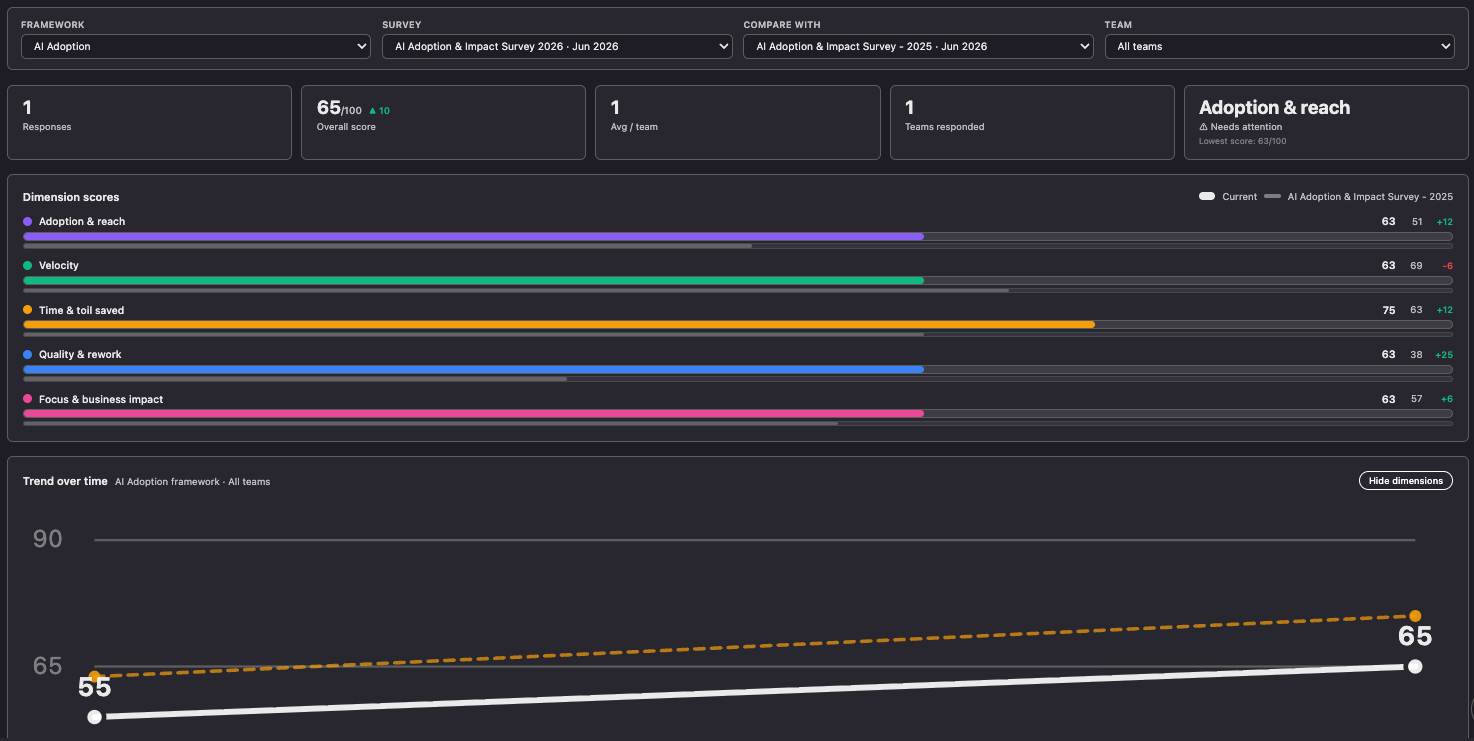
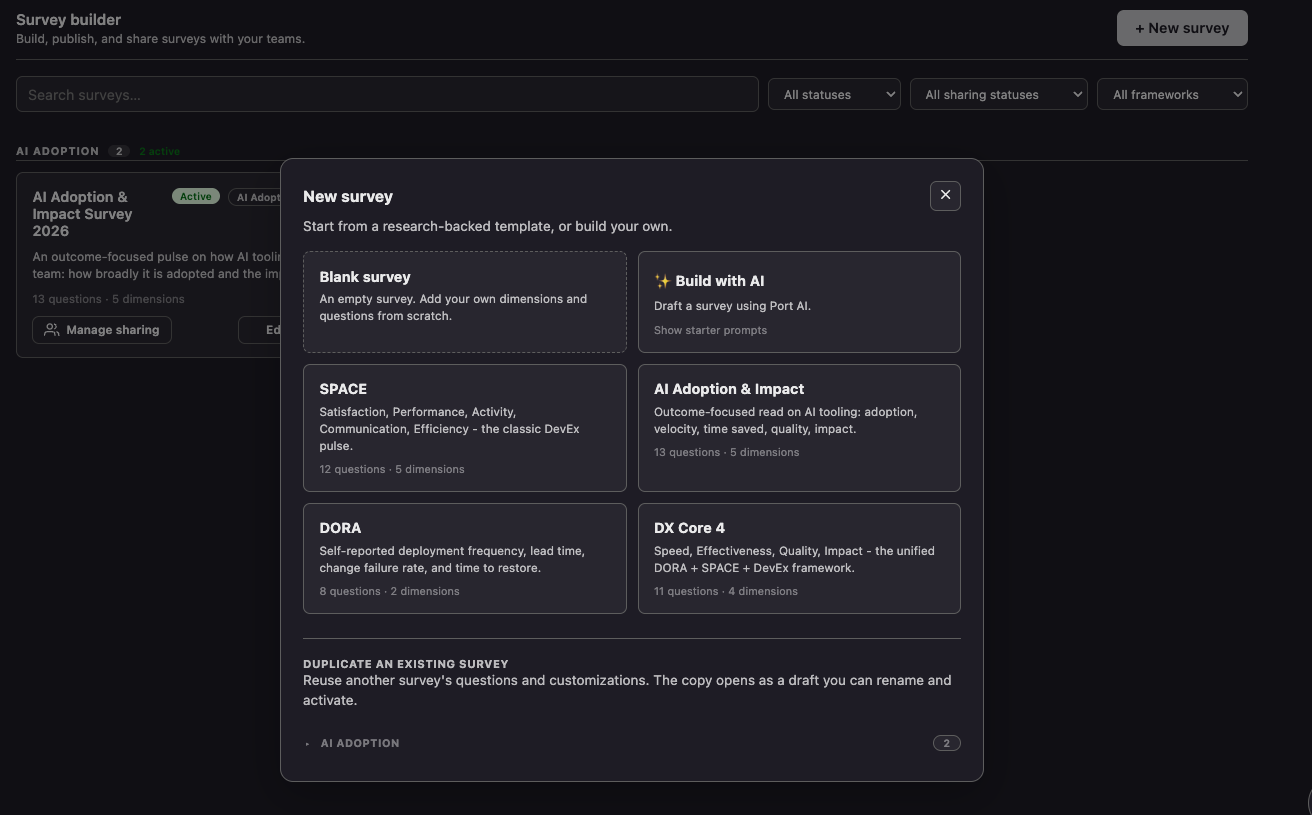
Port provides a native survey experience using self-service actions and the software catalog & context lake. Responses are stored as catalog entities, so you can correlate sentiment with quantitative metrics - comparing satisfaction scores with DORA metrics or pipeline failure rates. Port automations can also trigger surveys contextually at the right moment in a developer's workflow.
What to track:
- Participation rate: What percentage of developers completed the survey.
- Top pain points: Recurring themes across responses (slow reviews, flaky pipelines, unclear ownership).
- Satisfaction trends: How sentiment changes over time as improvements are made.
- Segment differences: Whether pain points vary by team, tenure, or role.
Collect developer responses
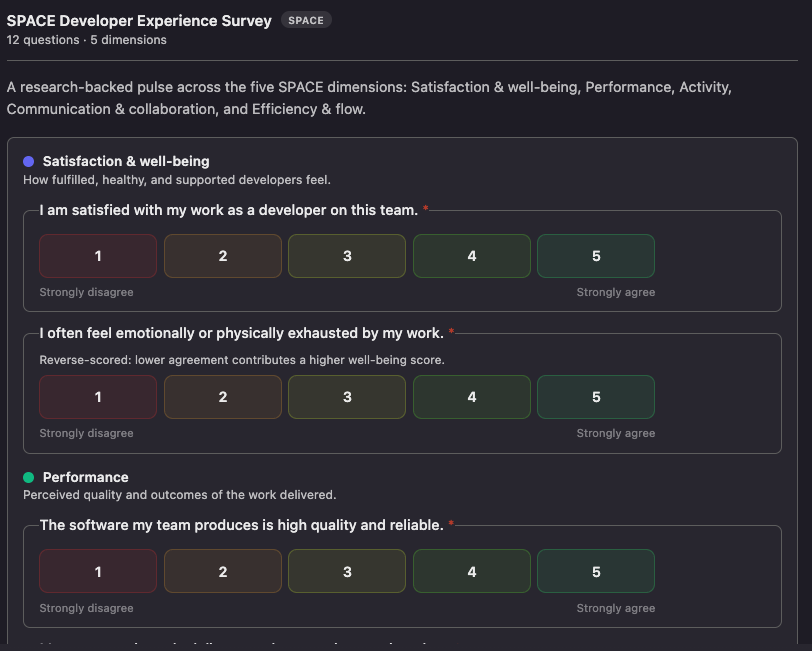
Port automations handle the reminder loop, nudging engineering managers whose team members haven't completed the survey. Anonymized results can be displayed in Port dashboards, giving the broader team visibility into themes and trends. Correlating survey sentiment with quantitative metrics (DORA, pipeline failure rates, delivery performance) validates whether metric improvements are actually felt by developers.
What to track:
- Completion rate: Percentage of invited developers who finish the survey.
- Response quality: Whether open-ended responses contain actionable detail versus single-word answers.
- Action visibility: Whether developers are aware of what changed as a result of their feedback.
Analyze results & act on insights
Port connects the full loop: survey responses surface the pain point, scorecards translate it into a measurable standard, and workflows automate enforcement and notifications. Because everything lives in the same software catalog & context lake, you can track whether scorecard improvements actually correlate with improved developer sentiment in the next survey round.
What to track:
- Top pain point: The most impactful and feasible issue identified from survey responses.
- Scorecard compliance trend: Progress toward the measurable target you set for the improvement initiative.
- Follow-up sentiment: Whether developers feel the pain point has improved in the next survey round.
- Time to action: How quickly the first improvement action was taken after survey results were published.