More engineering metrics
One of the key advantages of Port's flexible data model is the ability to measure arbitrary engineering metrics that matter to your organization, regardless of your engineering platform's architecture or version.
Port can normalize and connect data from across your entire engineering ecosystem. This enables tracking of custom metrics that matter specifically to your organization - whether that's measuring cross-team dependencies, tracking technical debt across multiple repositories, or analyzing the impact of architectural decisions on delivery speed. The managed relations between entities allow for multi-dimensional analysis, helping you understand not just what's happening, but where and why. For example, you could analyze deployment frequency not just by team, but by service type, technology stack, or business domain. This deeper insight helps engineering leaders make more informed decisions about where to focus improvement efforts.
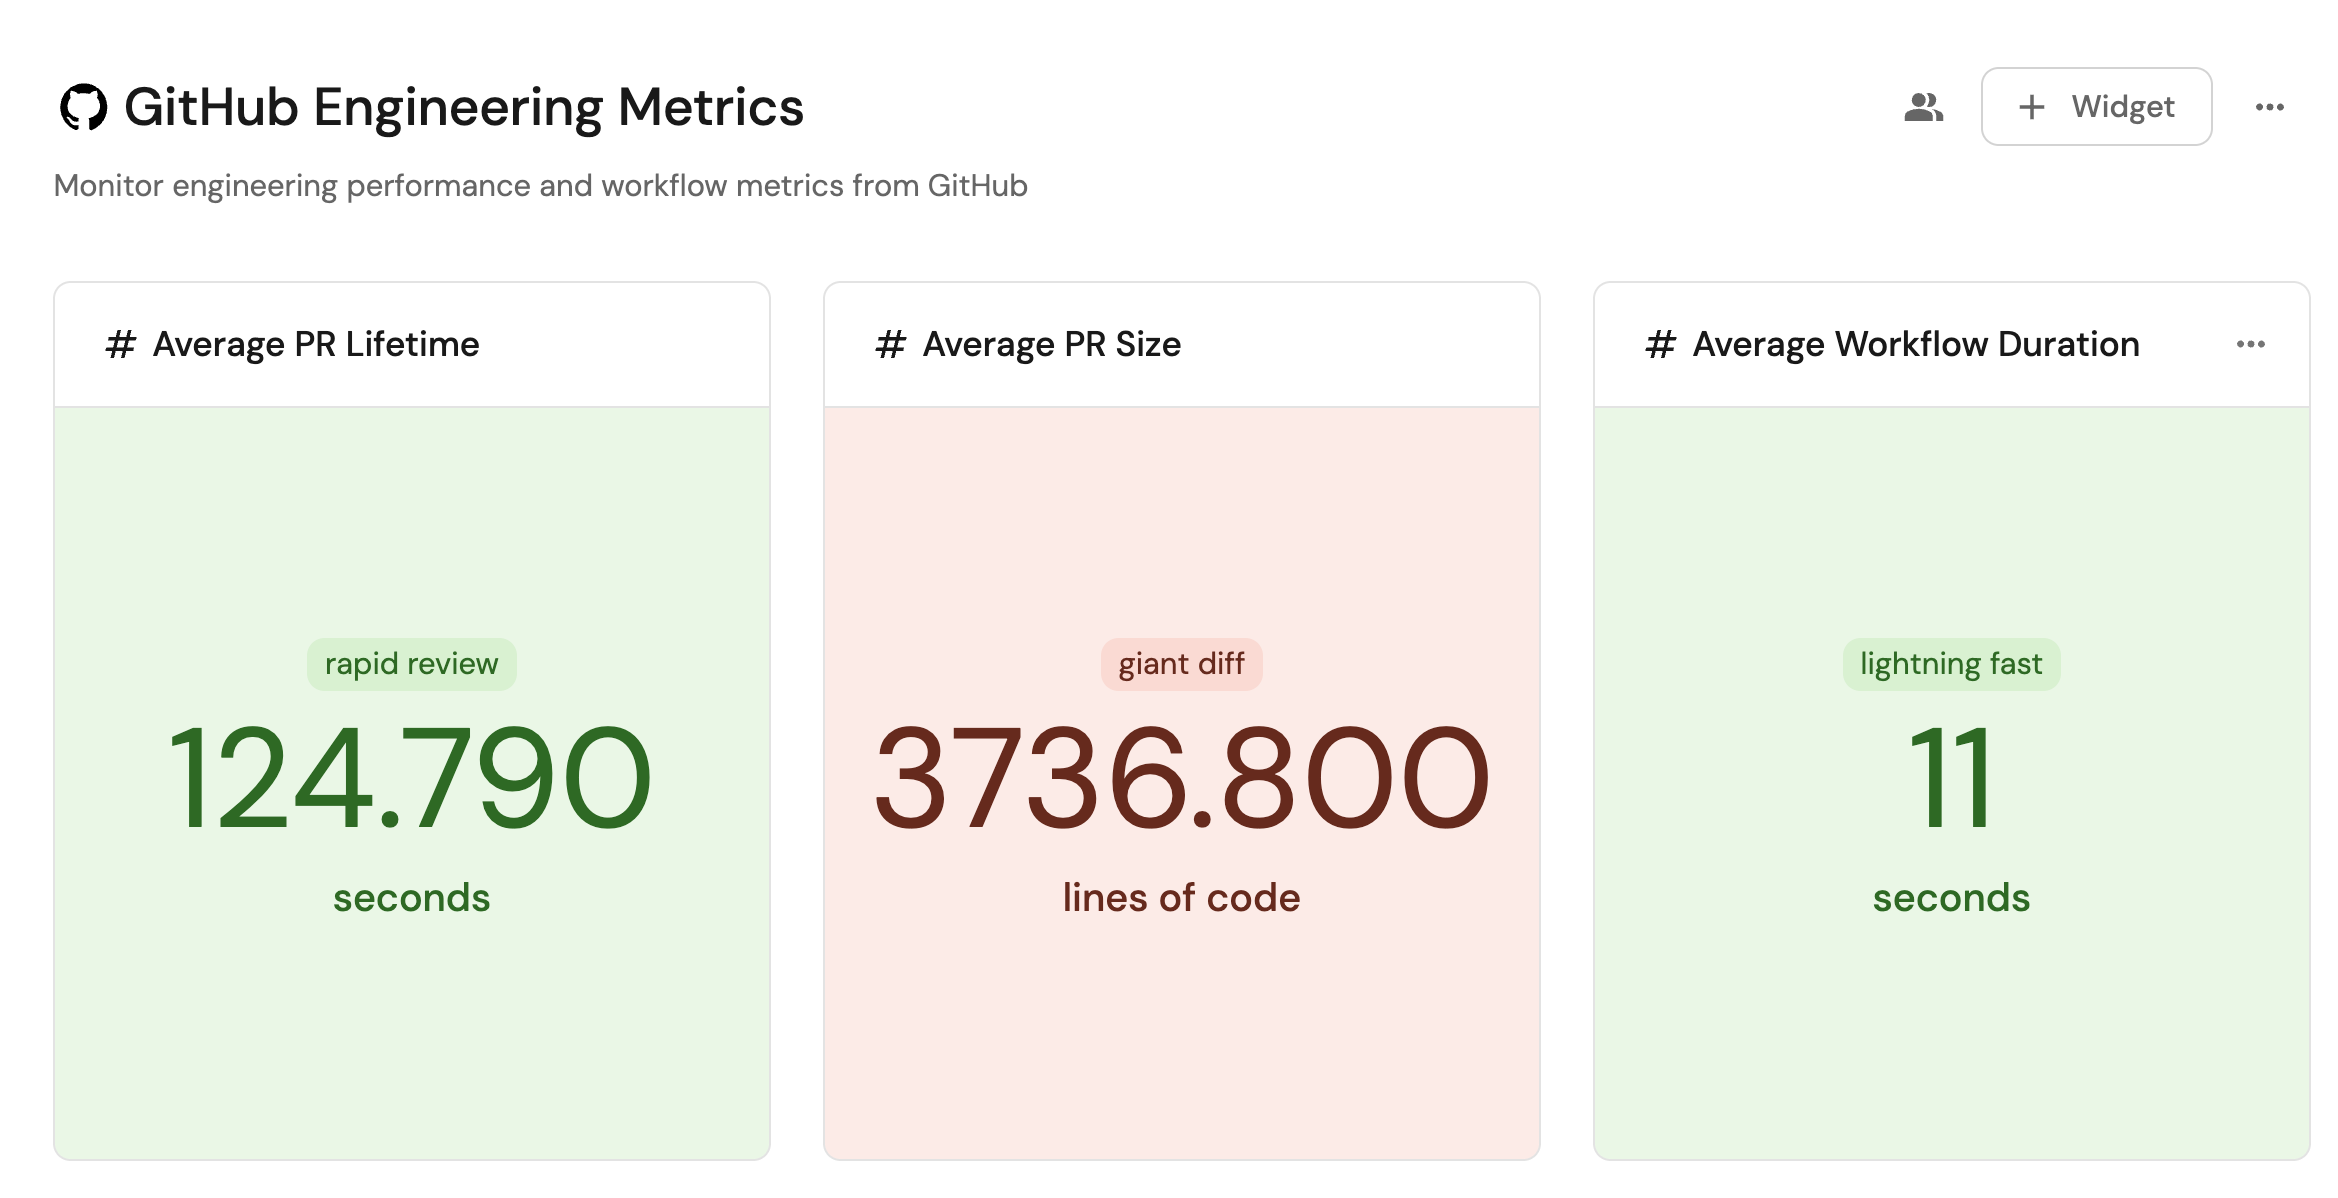
Track developer onboarding, PR and build pipeline metrics from Github
Port integrates seamlessly with GitHub to track key engineering metrics like time-to-tenth-PR for new developers, PR review cycles, and build pipeline performance.
Measure the mean-time-between-failures, to add colour to mean-time-to-recovery
While Mean Time to Recovery (MTTR) measures how quickly teams can resolve incidents, Mean Time Between Failures (MTBF) provides crucial context by showing how frequently those incidents occur in the first place. A service with a low MTTR might seem healthy at first glance, but if it also has a low MTBF, it indicates a system that fails often and requires frequent fixes. While the Change Failure Rate (CFR) accounts for this to some extent, it really looks at how the number of deployments relates to number of failures, often poorly accounting for legacy services with few changes, or services that fail regularly unrelated to changes. By tracking both metrics together, engineering leaders can better distinguish between services that are truly stable versus those that appear resilient only because teams have become efficient at fixing recurring problems.
To reduce it to bullet points:
- MTTR tells you how fast you recover.
- CFR tells you how risky your changes are.
- MTBF tells you how often you fail.
This is a great example of how Port makes it trivial to calculate arbitrary engineering metrics over the rich data in the catalog. Balancing metrics like these are key. After all, a service with a very low MTTR could even be the greatest contributor to the number of incidents and aggregate downtime.
Visualize your Github repository history
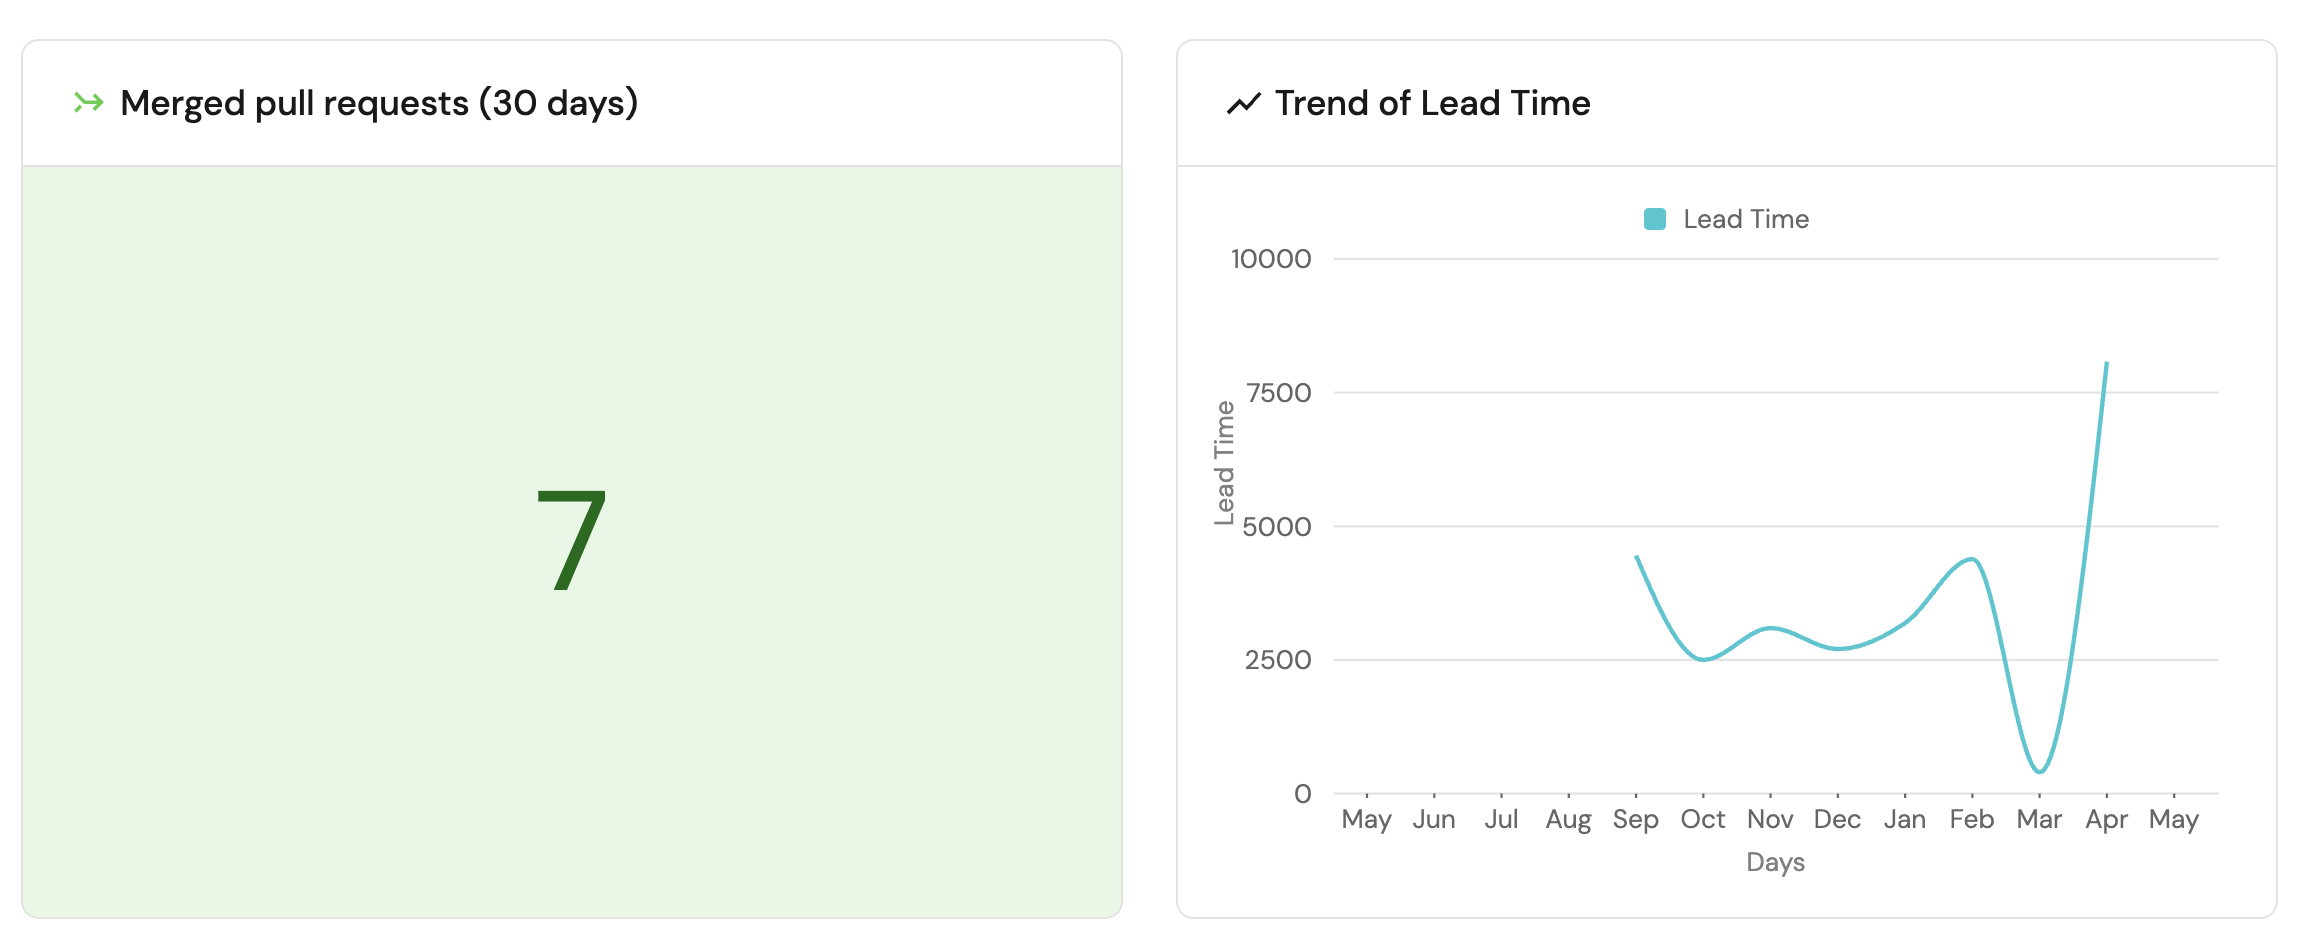
Looking at your GitHub repository history provides a view of your development activity over time, helping you understand patterns in code contributions, team collaboration, and project momentum. By tracking metrics like commit frequency, issue counts, lead time and contributor distribution, engineering leaders can identify trends that impact productivity and code quality. This data-driven approach enables better resource allocation, helps identify potential bottlenecks, and validates the effectiveness of development practices.
Visualize JIRA issues
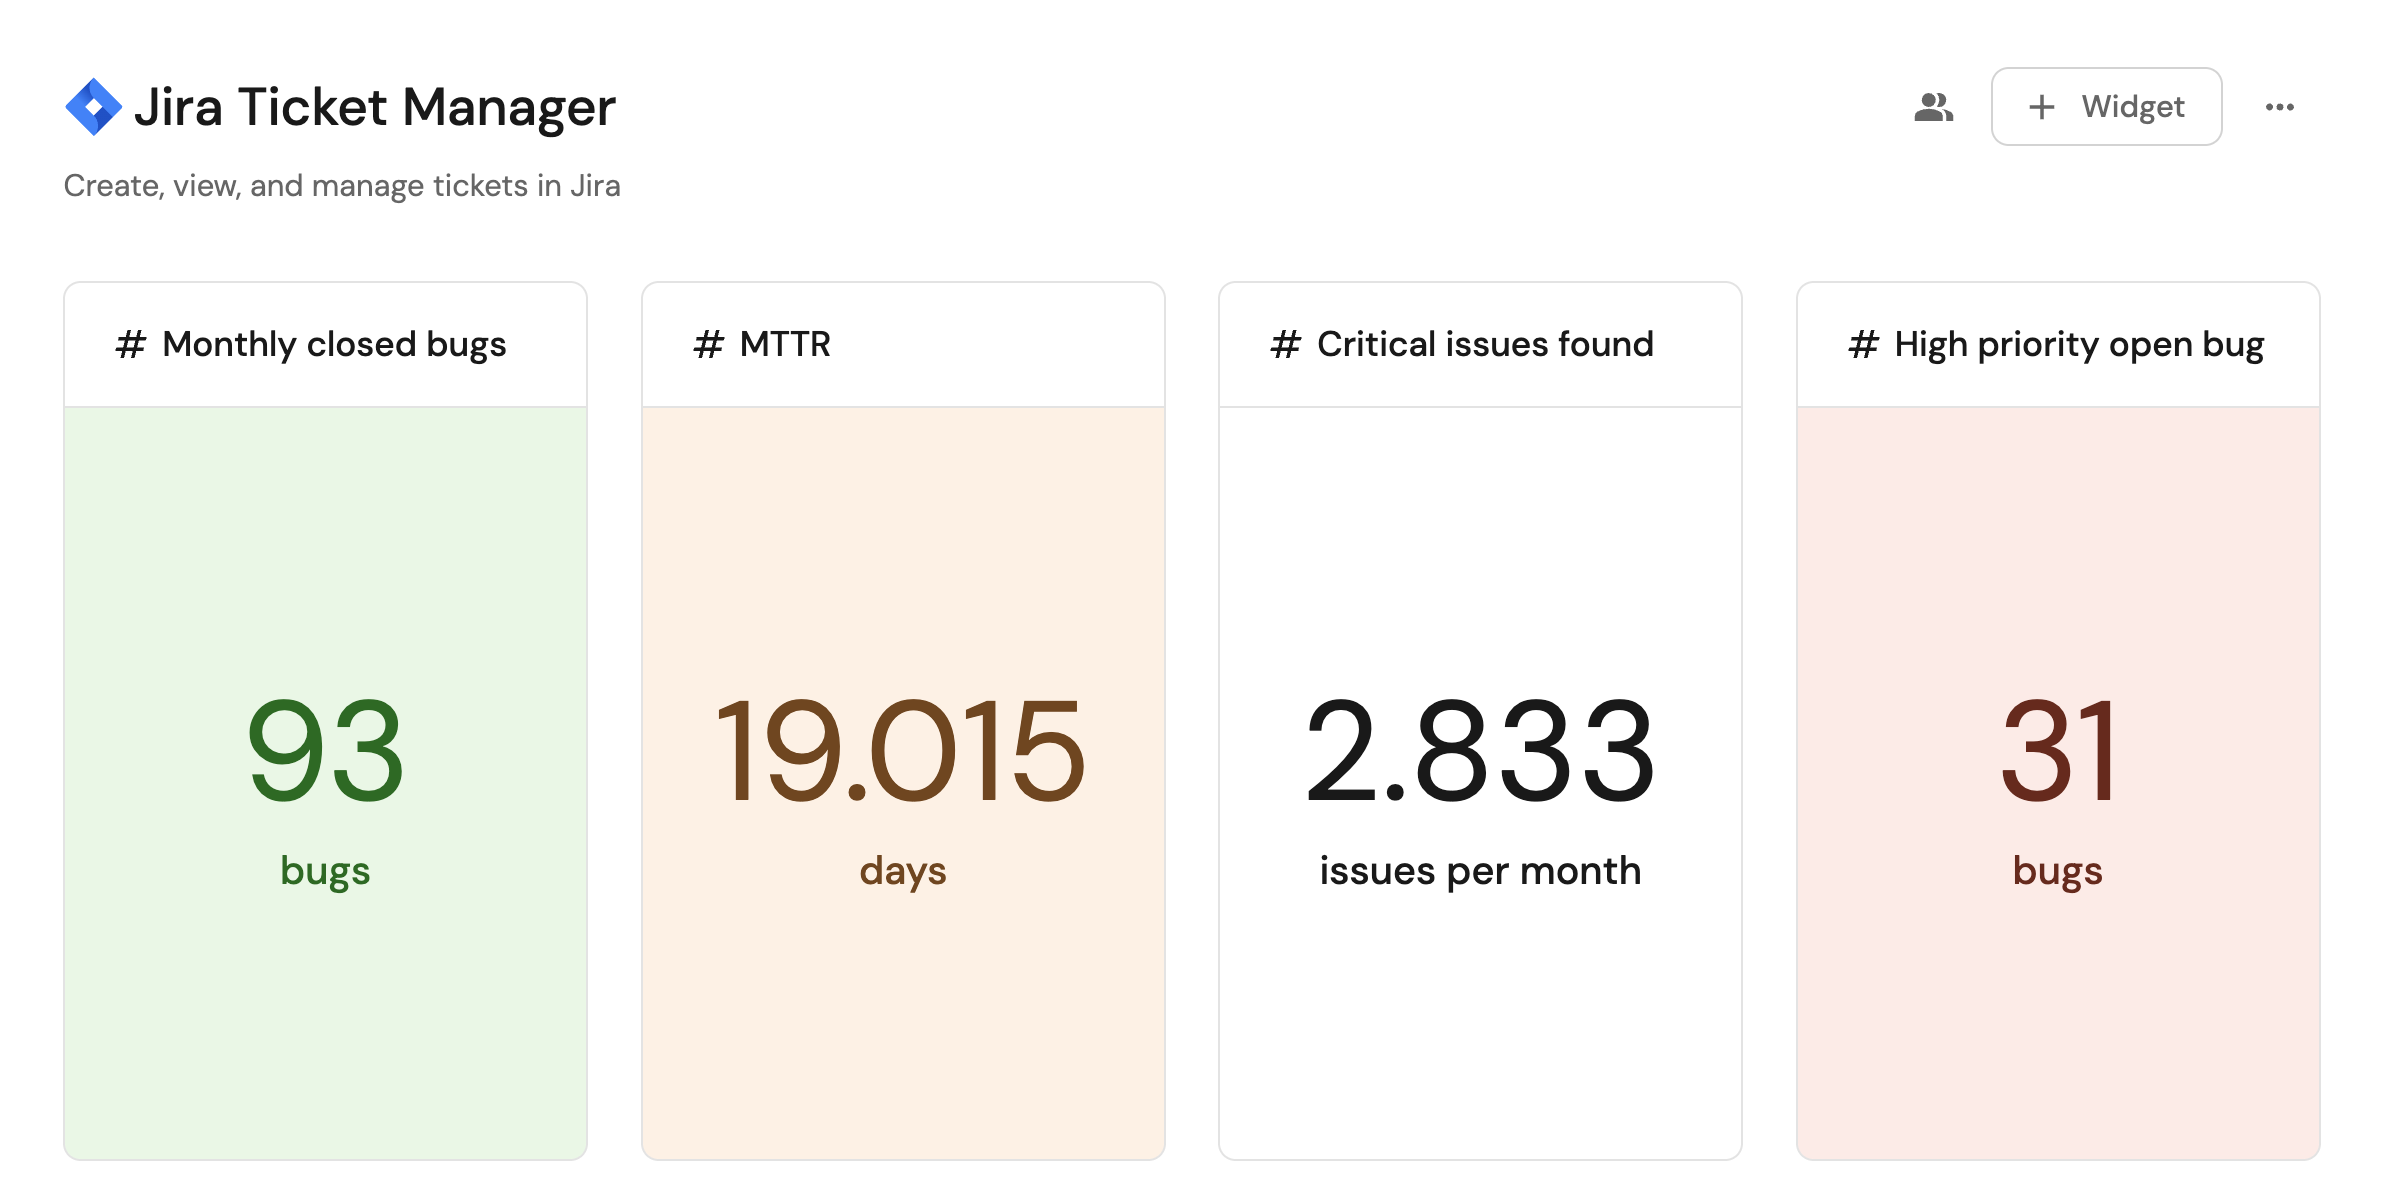
Visualizing JIRA issues provides insights into your team's workflow patterns, helping to identify bottlenecks, track issue resolution times and understand workload distribution across teams and individuals. By analyzing metrics like time spent in different states, critical issues/bugs and closure rates, engineering leaders can make data-driven decisions to optimize processes and improve team efficiency. This visibility into work patterns helps highlight areas where teams might be getting blocked or overloaded, enabling proactive interventions before they impact delivery timelines.
Turn engineering metrics into decisions and actions
Measurement is only the first step. As you identify issues in your survey and metric data, the next step is to create scorecards and initiatives to drive changes.
Measure ROI on your investments in tooling
Engineering leaders want to quantify the return on investment in AI-assisted development tools. By tracking metrics like acceptance rates, time savings, and code quality improvements, they can start to see not just how many seats have been purchased, but how those seats are being utilized. Moreover, correlating this data with other trends around engineering and quality metrics, or even just developer sentiment from surveys, gives engineering leaders a deeper insight into the value derived from the investment. By analyzing Copilot's impact across different teams and project types, organizations can make data-driven decisions about expanding or optimizing their AI tooling investments.
Track AI-driven pull requests and coding agent activity
As engineering teams adopt AI coding agents like GitHub Copilot, Claude, and Devin, managing the increased volume of AI-generated pull requests becomes challenging. Port's AI control center automatically identifies and displays AI-driven PRs in real-time, giving engineering leaders visibility into AI contributions across the organization.
By tracking AI agent participation rates, review cycles, and contribution distribution, teams can make data-driven decisions about AI tool adoption while ensuring quality standards are maintained.