Visualize your GitHub dependency security alerts
This guide demonstrates how to set up a monitoring solution to gain visibility into security alerts from GitHub’s Dependabot. You’ll learn how to visualize vulnerability alerts across your repositories and track them over time using Port's GitHub integration.
This guide includes steps that require integration with GitHub:
- GitHub (Ocean) - uses the Ocean framework. We strongly recommend this integration for new and migrated setups.
- GitHub (Sunset) - uses a GitHub app that is in sunset and will be fully deprecated on September 15, 2026.
Common use cases
- Monitor open and resolved Dependabot alerts across repositories.
- Identify repositories with a high number of unresolved alerts.
- Understand the distribution of alerts by severity and package ecosystem (e.g., npm, Maven, PyPI).
Prerequisites
This guide assumes the following:
- You have a Port account and have completed the onboarding process.
- Port's GitHub Ocean integration is installed in your account.
Set up data model
When installing the GitHub integration, the Repository blueprint is created by default. The Dependabot Alert blueprint is not created automatically, so we will need to create it manually.
Create the Github dependabot alert blueprint
Follow the steps below to create the Dependabot Alert blueprint.
Skip to the set up data source mapping section if you already have the blueprint.
-
Go to your Builder page.
-
Click on
+ Blueprint. -
Click on the
{...}button in the top right corner, and chooseEdit JSON. -
Add this JSON schema:
GitHub dependabot alert blueprint (Click to expand)
{"identifier": "githubDependabotAlert","title": "Dependabot Alert","icon": "Github","schema": {"properties": {"severity": {"title": "Severity","type": "string","enum": ["low", "medium", "high", "critical"],"enumColors": {"low": "yellow","medium": "orange","high": "red","critical": "red"},"icon": "DefaultProperty"},"state": {"title": "State","type": "string","enum": ["auto_dismissed", "dismissed", "fixed", "open"],"enumColors": {"auto_dismissed": "green","dismissed": "green","fixed": "green","open": "red"},"icon": "DefaultProperty"},"packageName": {"icon": "DefaultProperty","title": "Package Name","type": "string"},"packageEcosystem": {"title": "Package Ecosystem","type": "string"},"manifestPath": {"title": "Manifest Path","type": "string"},"scope": {"title": "Scope","type": "string"},"ghsaID": {"title": "GHSA ID","type": "string"},"cveID": {"title": "CVE ID","type": "string"},"cvssScore": {"type": "number","title": "CVSS Score"},"url": {"title": "URL","type": "string","format": "url"},"references": {"icon": "Vulnerability","title": "References","type": "array","items": {"type": "string","format": "url"}},"alertCreatedAt": {"icon": "DefaultProperty","type": "string","title": "Alert Created At","format": "date-time"},"alertUpdatedAt": {"icon": "DefaultProperty","type": "string","title": "Alert Updated At","format": "date-time"}},"required": []},"mirrorProperties": {},"calculationProperties": {},"relations": {"repository": {"title": "Repository","target": "githubRepository","required": true,"many": false}}} -
Click
Saveto create the blueprint.
Set up data source mapping
- Go to your Data Source page.
- Select the GitHub integration relevant to you.
- Add the following YAML block into the editor to ingest data from GitHub:
- GitHub (Ocean)
- GitHub (Sunset)
GitHub Ocean integration configuration (Click to expand)
resources:
- kind: repository
    selector:
    query: "true"
    includedFiles:
    - README.md
    port:
    entity:
        mappings:
        identifier: .name
        title: .name
        blueprint: '"githubRepository"'
        properties:
            readme: .__includedFiles["README.md"]
            url: .html_url
            defaultBranch: .default_branch

- kind: dependabot-alert
    selector:
    query: "true"
    states: ["open", "fixed"]
    port:
    entity:
        mappings:
        identifier: .__repository + "/" + (.number | tostring)
        title: .number | tostring
        blueprint: '"githubDependabotAlert"'
        properties:
            state: .state
            severity: .security_advisory.severity
            packageName: .dependency.package.name
            packageEcosystem: .dependency.package.ecosystem
            manifestPath: .dependency.manifest_path
            scope: .dependency.scope
            ghsaID: .security_advisory.ghsa_id
            cveID: .security_advisory.cve_id
            cvssScore: .security_advisory.cvss.score
            url: .html_url
            references: "[.security_advisory.references[].url]"
            alertCreatedAt: .created_at
            alertUpdatedAt: .updated_at
        relations:
            repository: .__repository
GitHub integration configuration (Click to expand)
resources:
- kind: repository
    selector:
    query: 'true'
    port:
    entity:
        mappings:
        identifier: .name
        title: .name
        blueprint: '"githubRepository"'
        properties:
            readme: file://README.md
            url: .html_url
            defaultBranch: .default_branch
            visibility: .visibility

- kind: dependabot-alert
    selector:
    query: "true"
    port:
    entity:
        mappings:
        identifier: .repo.name + "-" + (.number | tostring)
        title: .number | tostring
        blueprint: '"githubDependabotAlert"'
        properties:
            state: .state
            severity: .security_advisory.severity
            packageName: .dependency.package.name
            packageEcosystem: .dependency.package.ecosystem
            manifestPath: .dependency.manifest_path
            scope: .dependency.scope
            ghsaID: .security_advisory.ghsa_id
            cveID: .security_advisory.cve_id
            cvssScore: .security_advisory.cvss.score
            url: .html_url
            references: "[.security_advisory.references[].url]"
            alertCreatedAt: .created_at
            alertUpdatedAt: .updated_at
        relations:
            repository: .repo.name
- Click
Save & Resyncto apply the mapping.
Visualize metrics
Once the GitHub data is synced, we can create a dedicated dashboard in Port to monitor and analyze dependency vulnerability alerts using customizable widgets.
Create a dashboard
- Navigate to your software catalog.
- Click on the
+button in the left sidebar. - Select New dashboard.
- Name the dashboard Dependabot Alert Insights.
- Select the
Vulnerabilityicon. - Click
Create.
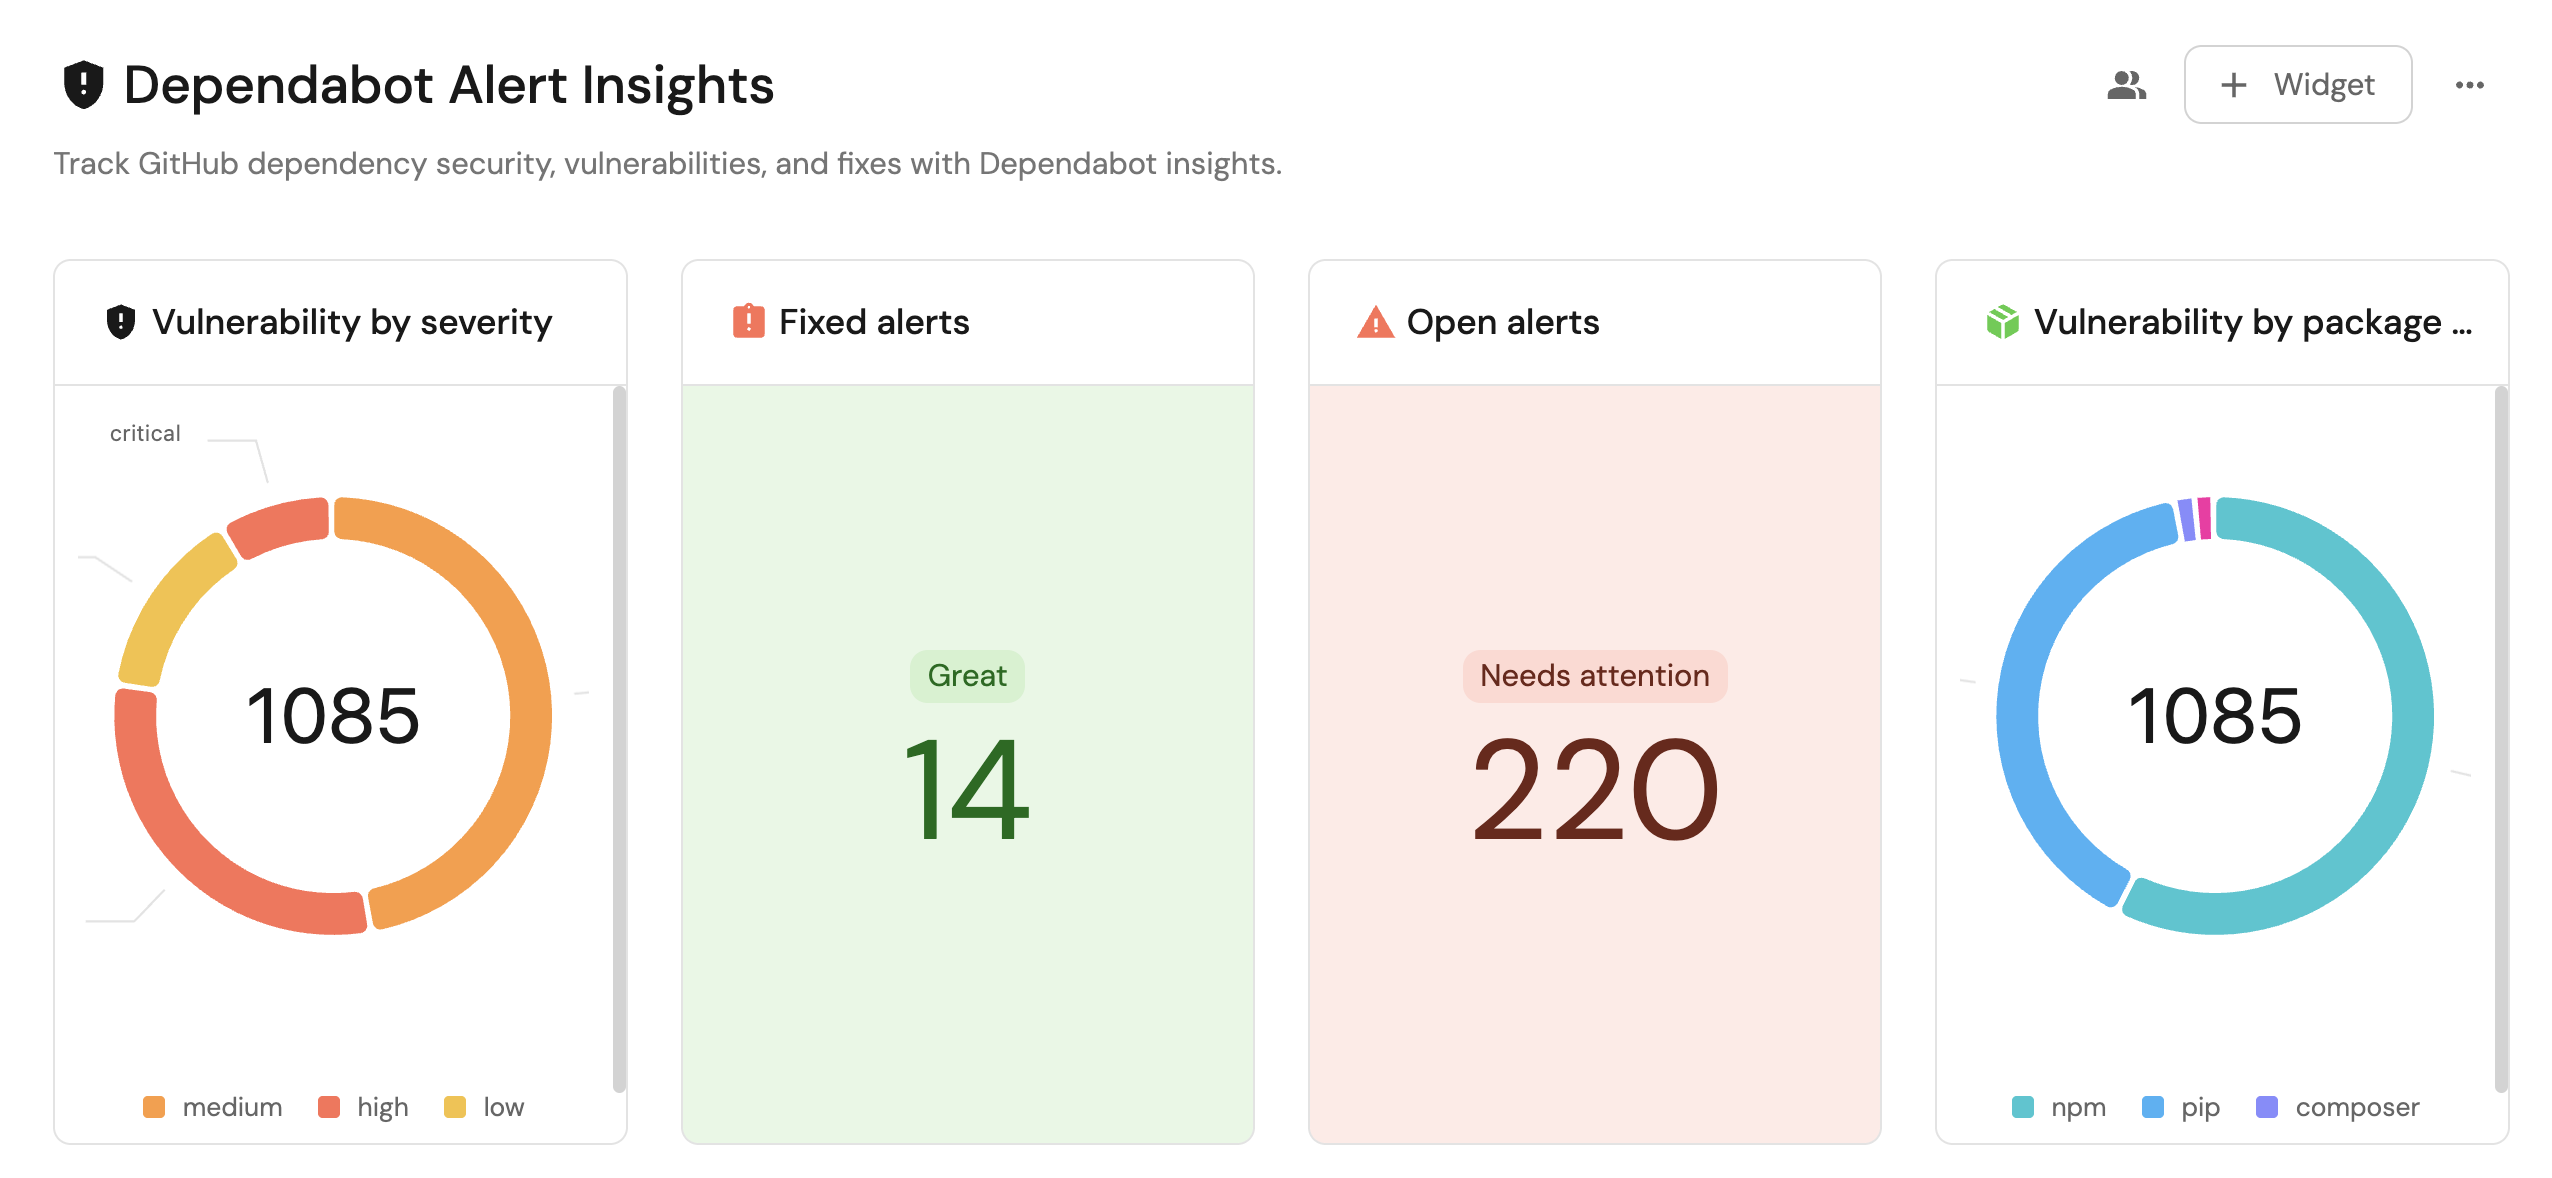
We now have a blank dashboard where we can start adding widgets to visualize insights from the Dependabot alerts.
Add widgets
In the new dashboard, create the following widgets:
Vulnerability by severity (click to expand)
-
Click
+ Widgetand select Pie chart. -
Title:
Vulnerability by severity. -
Choose the Dependabot Alert blueprint.
-
Under
Breakdown by property, select the Severity property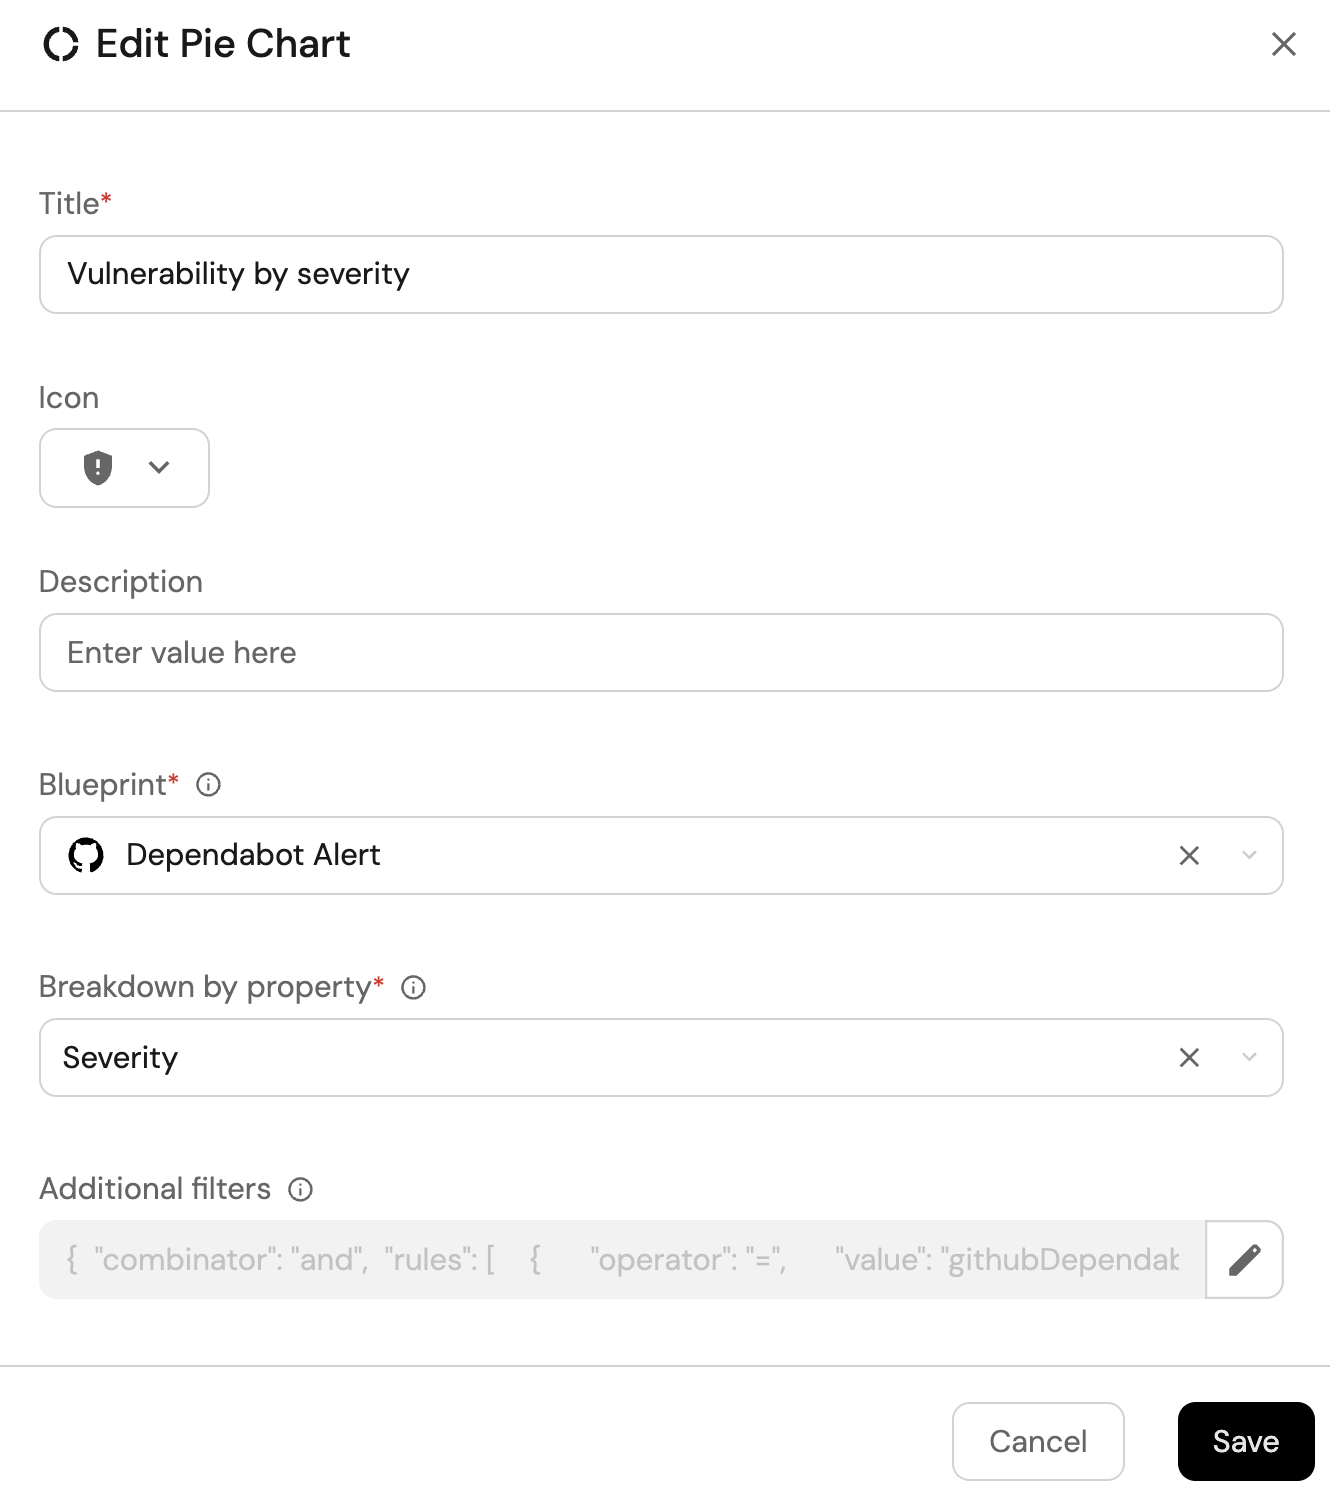
-
Click
Save.
Vulnerability by package type (click to expand)
-
Click
+ Widgetand select Pie chart. -
Title:
Vulnerability by package type. -
Choose the Dependabot Alert blueprint.
-
Under
Breakdown by property, select the Package Ecosystem property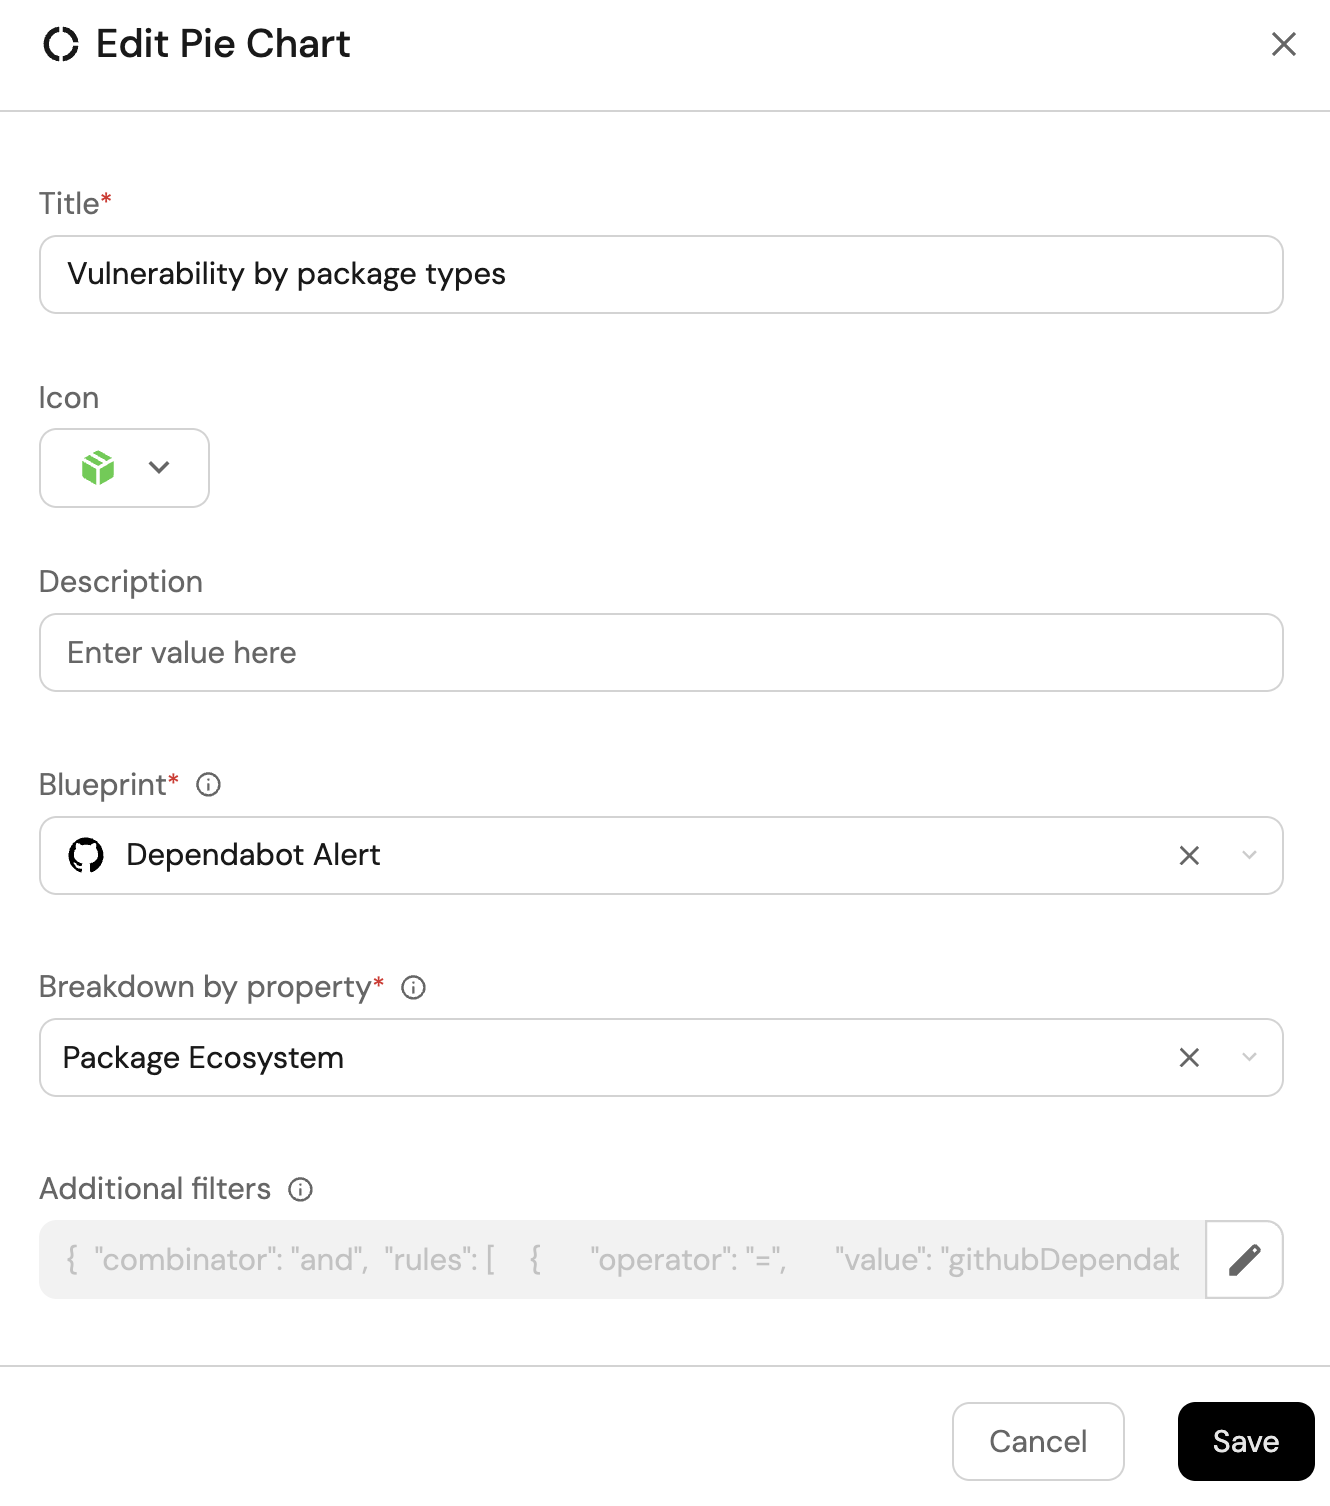
-
Click
Save.
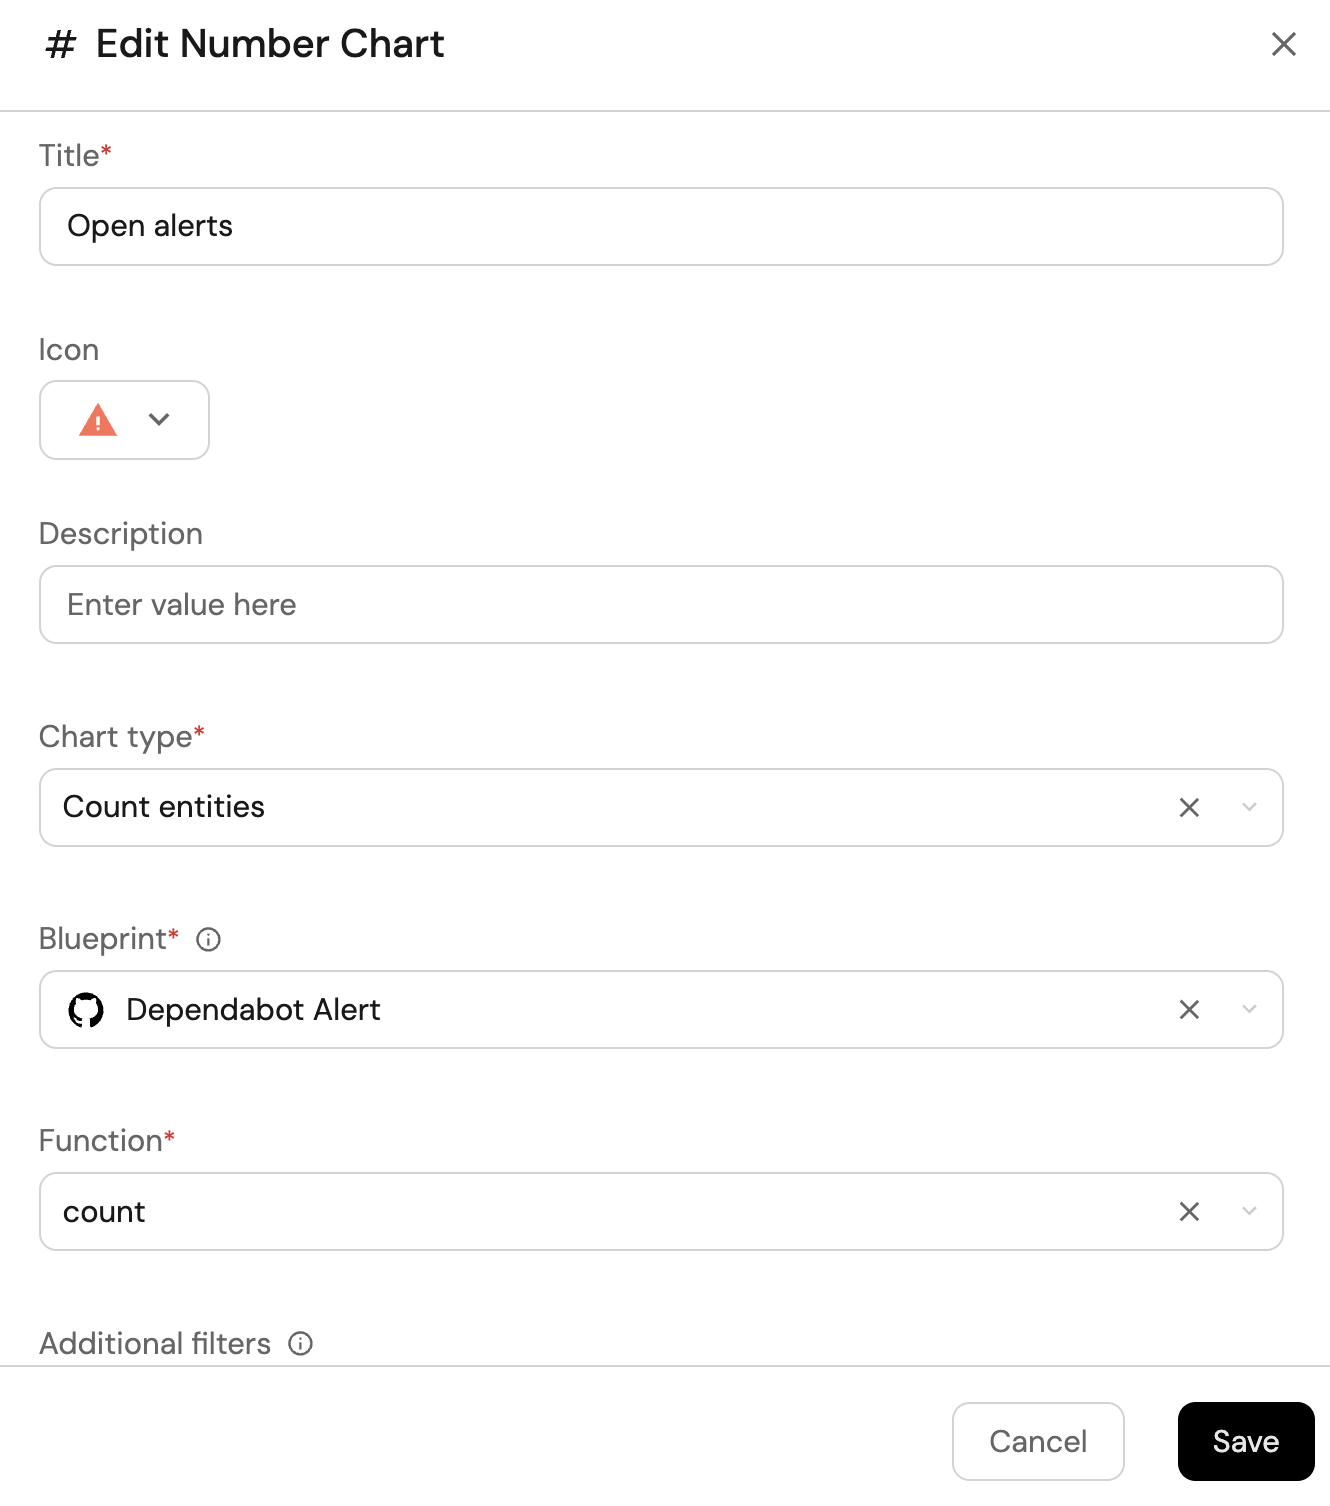
Open alerts updated in the last 6 months (click to expand)
-
Click
+ Widgetand select Number Chart. -
Title:
Open alerts(add theAlerticon). -
Select
Count entitiesChart type and choose Dependabot Alert as the Blueprint. -
Select
countfor the Function. -
Add this JSON to the Additional filters editor to filter
openalerts updated in the last 6 months:[{"combinator":"and","rules":[{"property":"state","operator":"=","value":"open"},{"property":"alertUpdatedAt","operator":"between","value":{"preset":"last6Months"}}]}] -
You may optionally configure conditional formatting to contextualize the numbers on the widget.
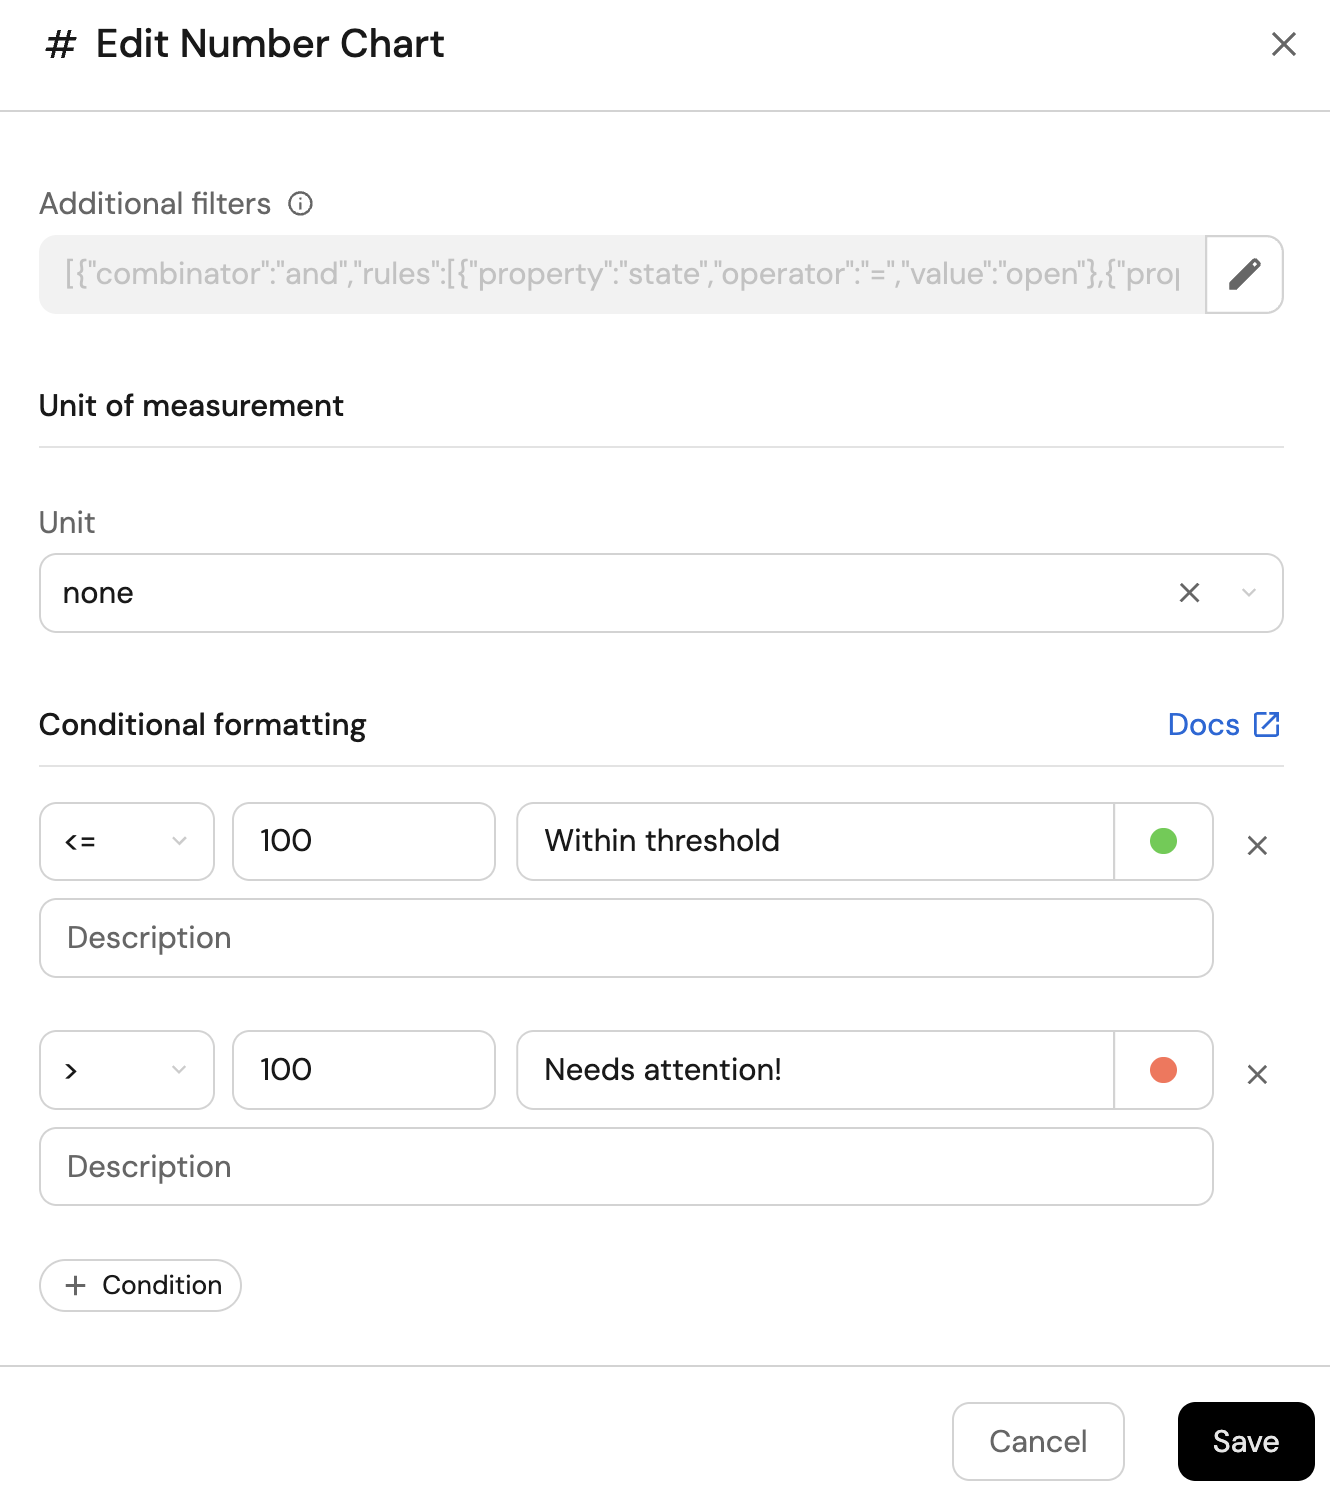
-
Click
Save.
Fixed alerts (click to expand)
-
Click
+ Widgetand select Number Chart. -
Title:
Fixed alerts(add theBadgeAlerticon). -
Select
Count entitiesChart type and choose Dependabot Alert as the Blueprint. -
Select
countfor the Function. -
Add this JSON to the Additional filters editor to filter
fixedalerts:[{"combinator":"and","rules":[{"property":"state","operator":"=","value":"fixed"}]}]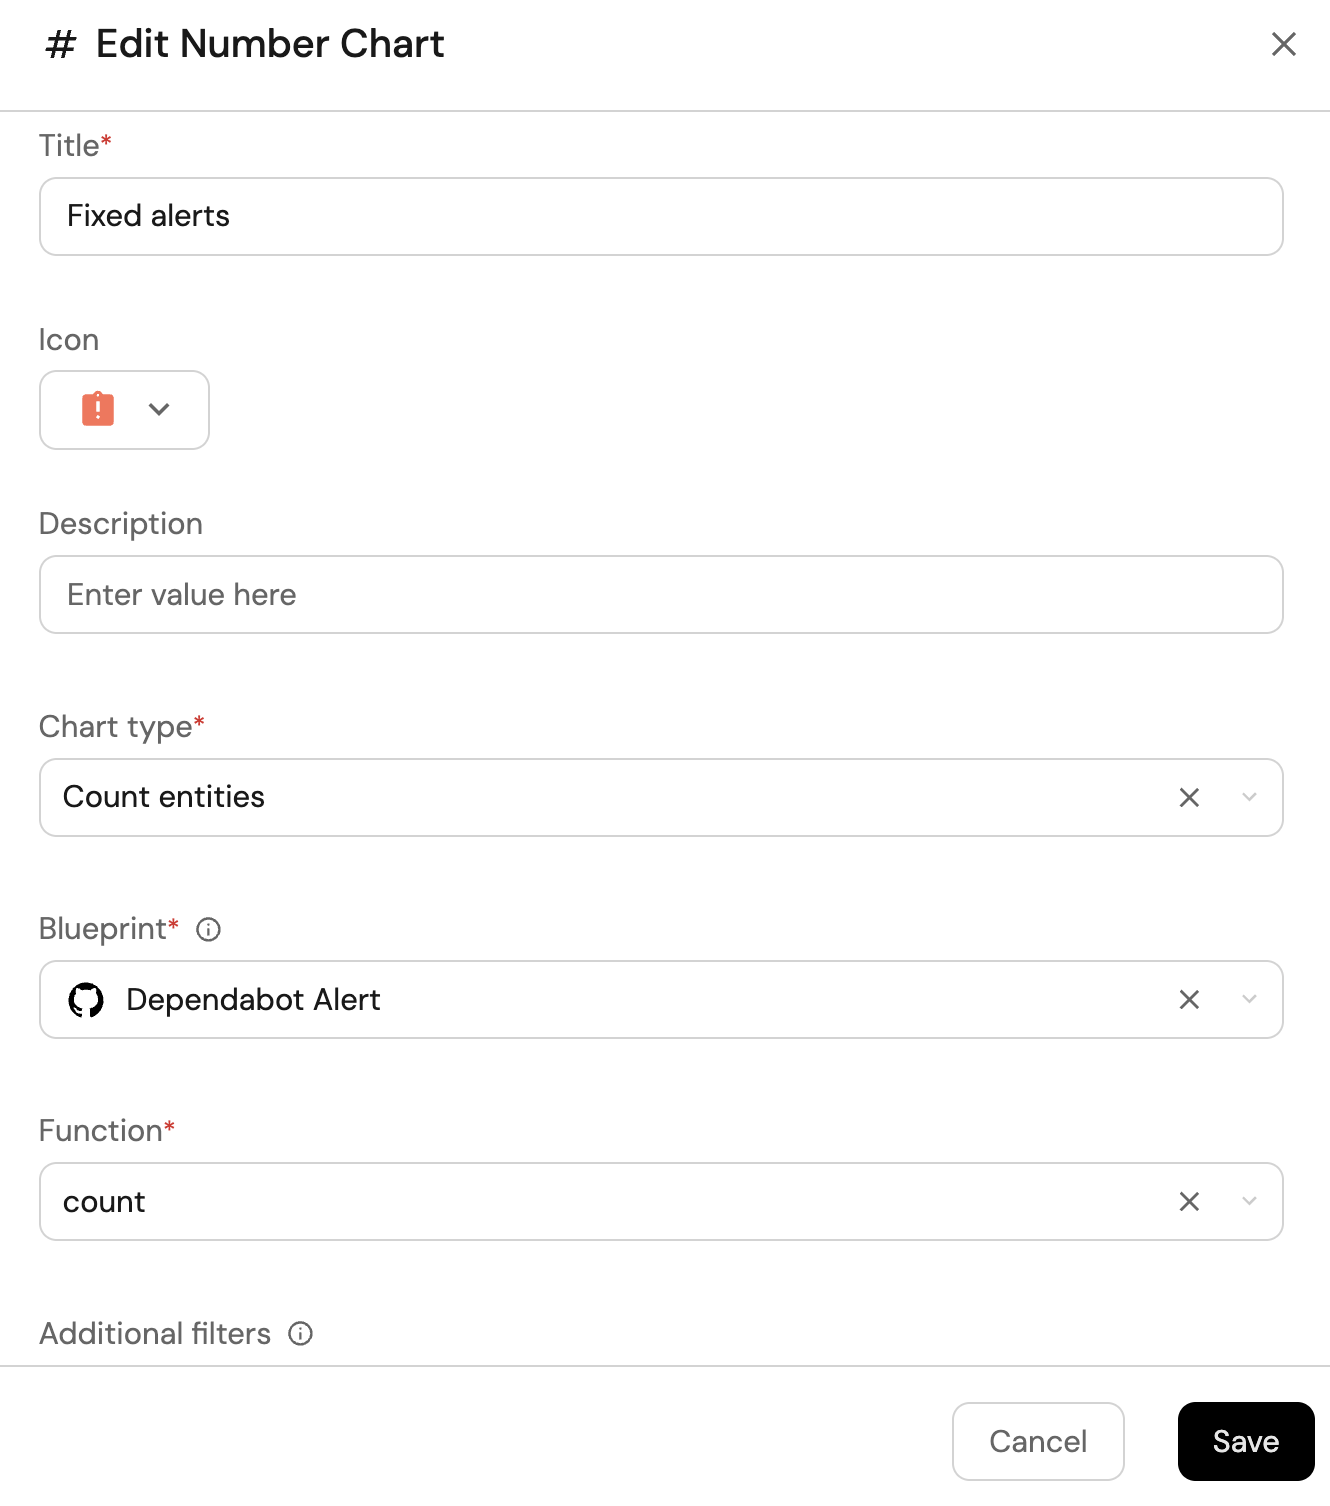
-
Click
Save.
Dismissed alerts (click to expand)
-
Click
+ Widgetand select Number Chart. -
Title:
Dismissed alerts. -
Select
Count entitiesChart type and choose Dependabot Alert as the Blueprint. -
Select
countfor the Function. -
Add this JSON to the Additional filters editor to filter
Dismissed alertsalerts:[{"combinator":"and","rules":[{"property":"state","operator":"=","value":"auto_dismissed"}]}]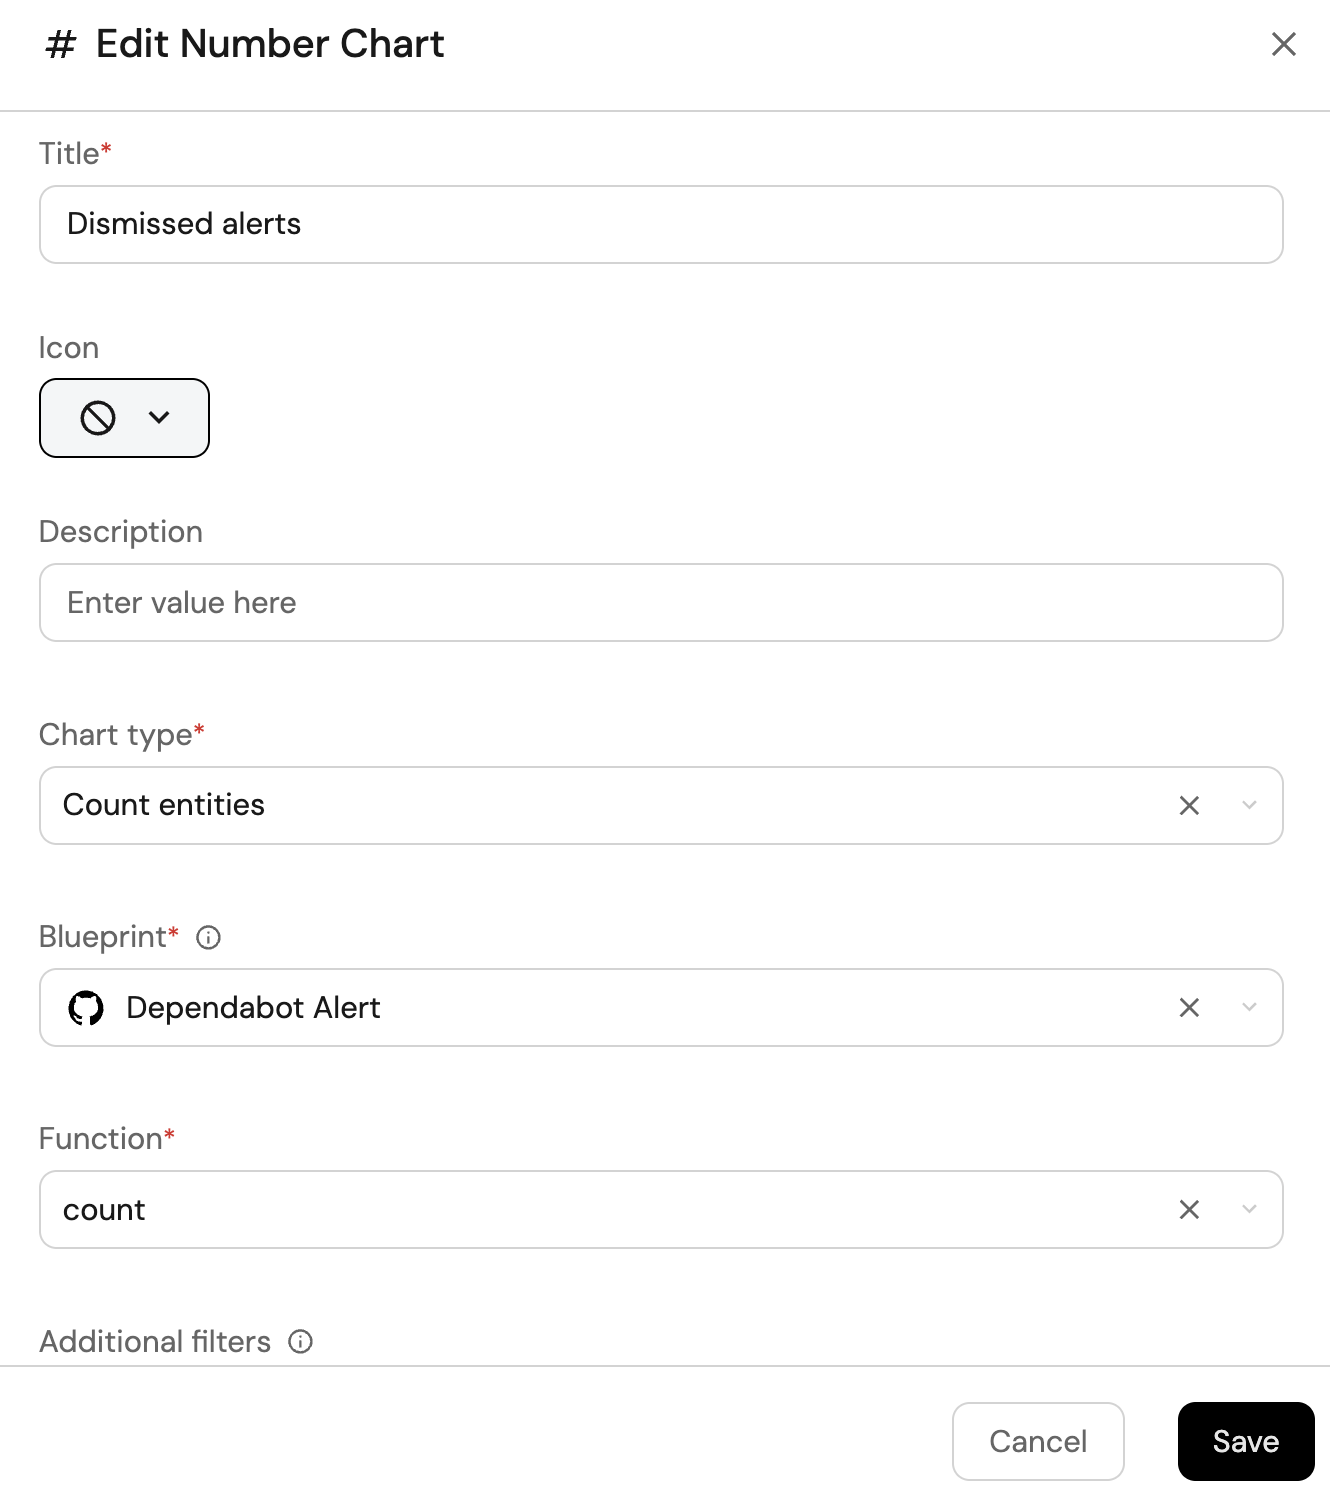
-
Click
Save.
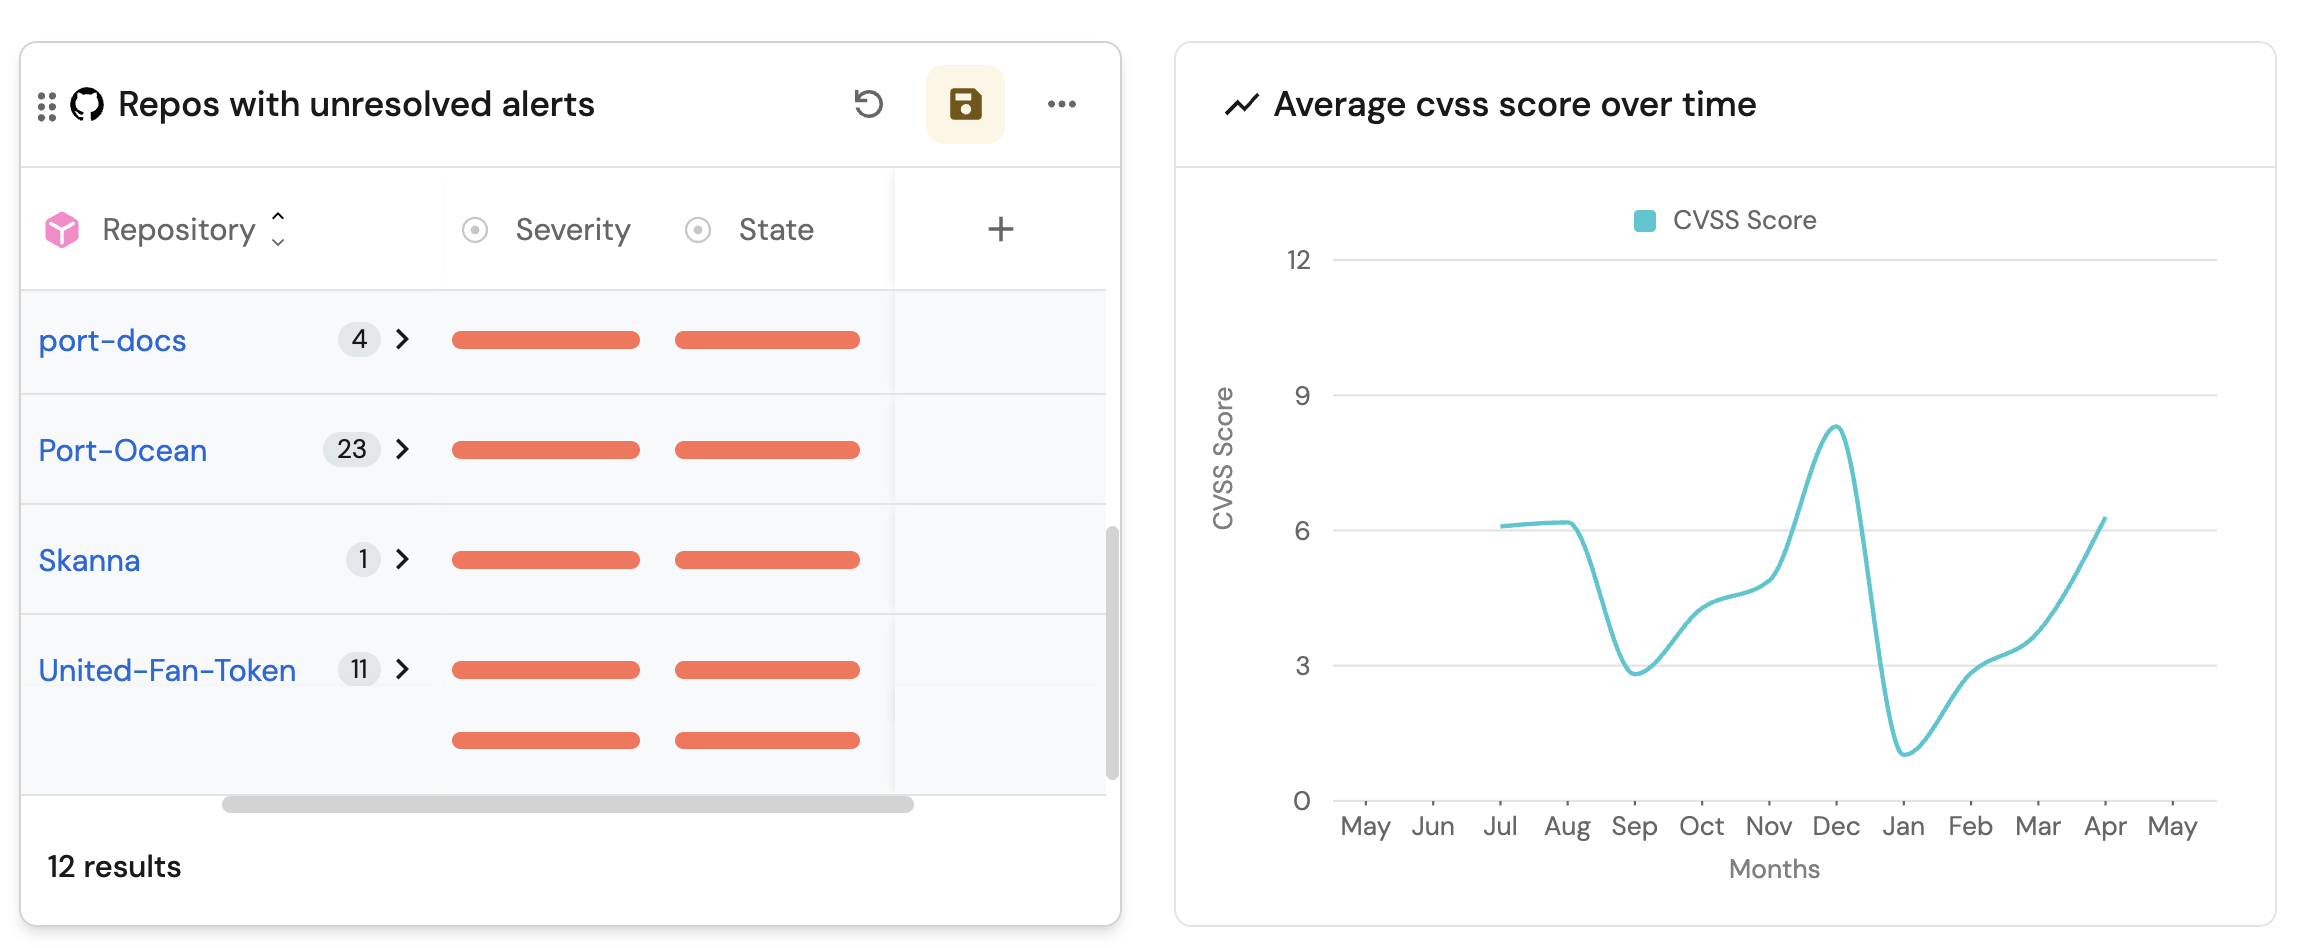
Average CVSS score over time (click to expand)
-
Click
+ Widgetand select Line Chart. -
Title:
Average CVSS Score Over Time(add theLineCharticon). -
Set X axis:
- Title:
Months. - Time interval:
Month. - Time range:
In the past 365 days.
- Title:
-
Set Y axis title:
CVSS Score. -
Click + Line and configure:
- Title:
Average CVSS score. - Chart type:
Aggregate by property. - Blueprint:
Dependabot Alert. - Property:
CVSS Score. - Function:
Average. - Measure time by:
alertCreatedAt.
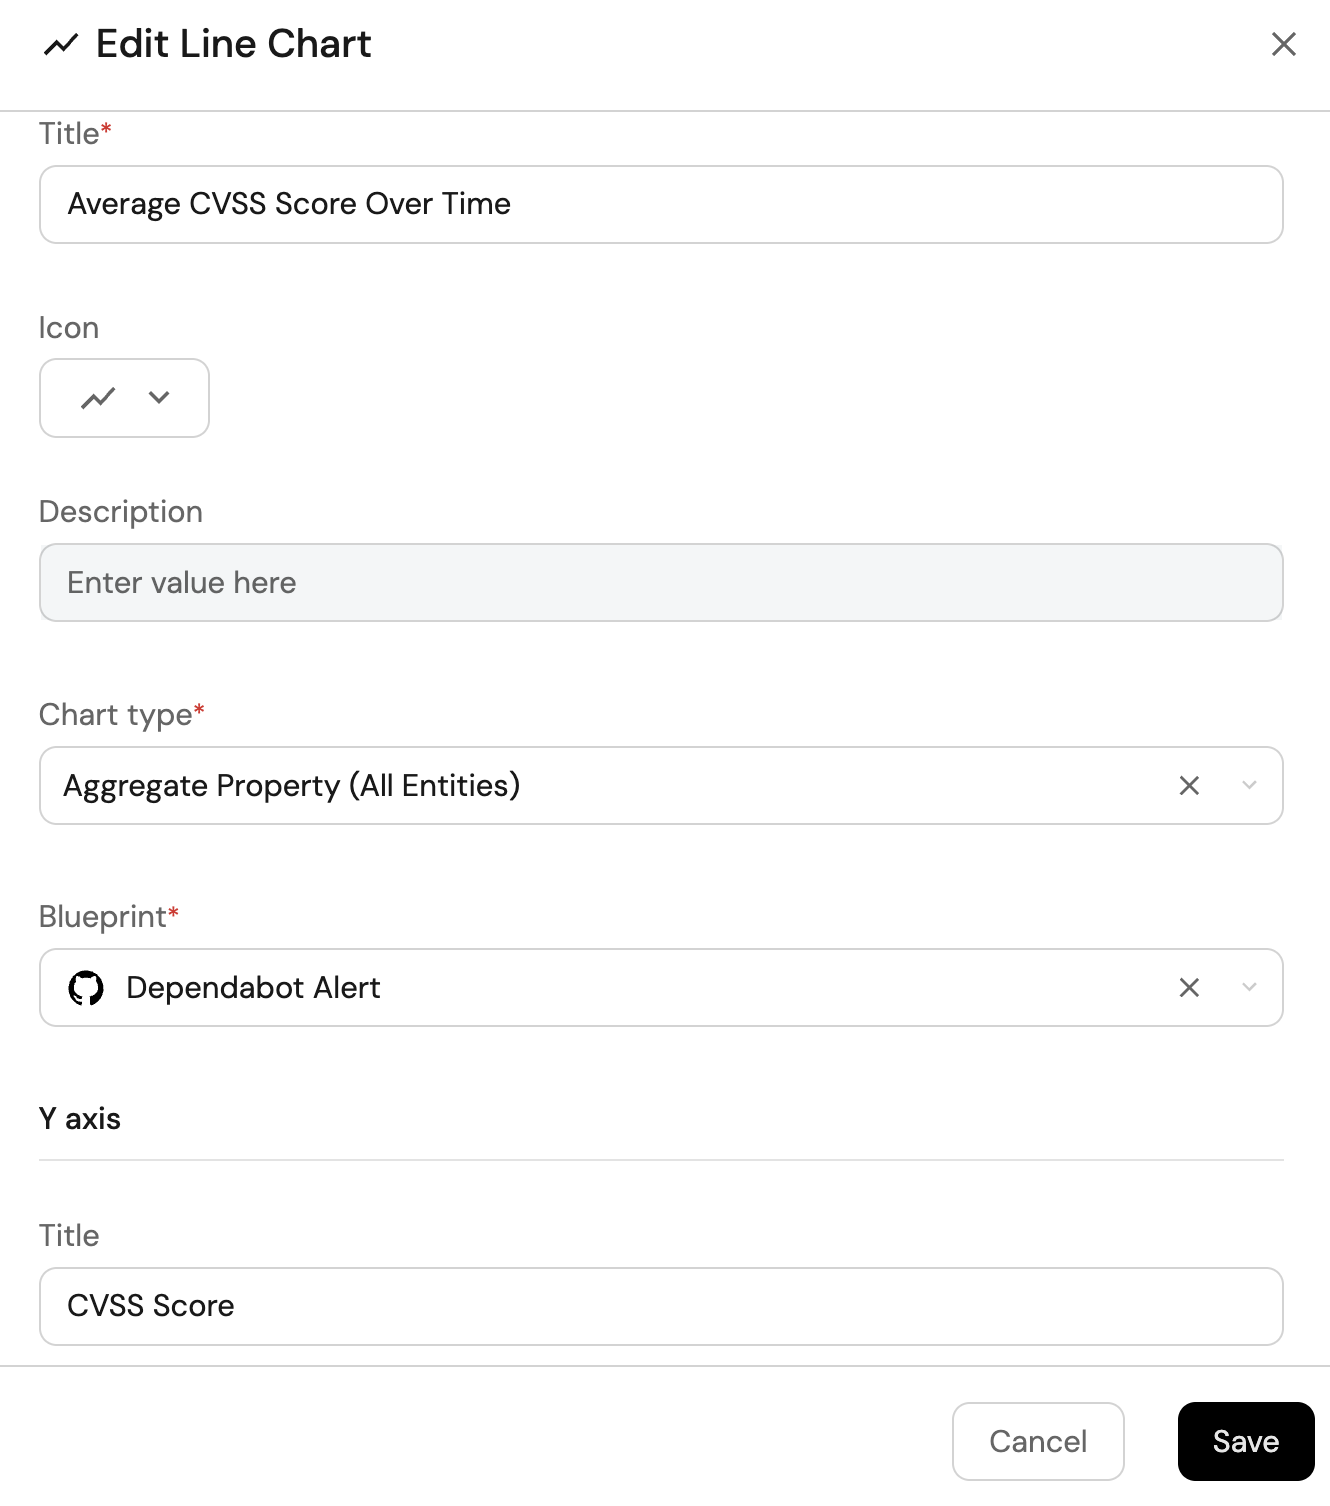
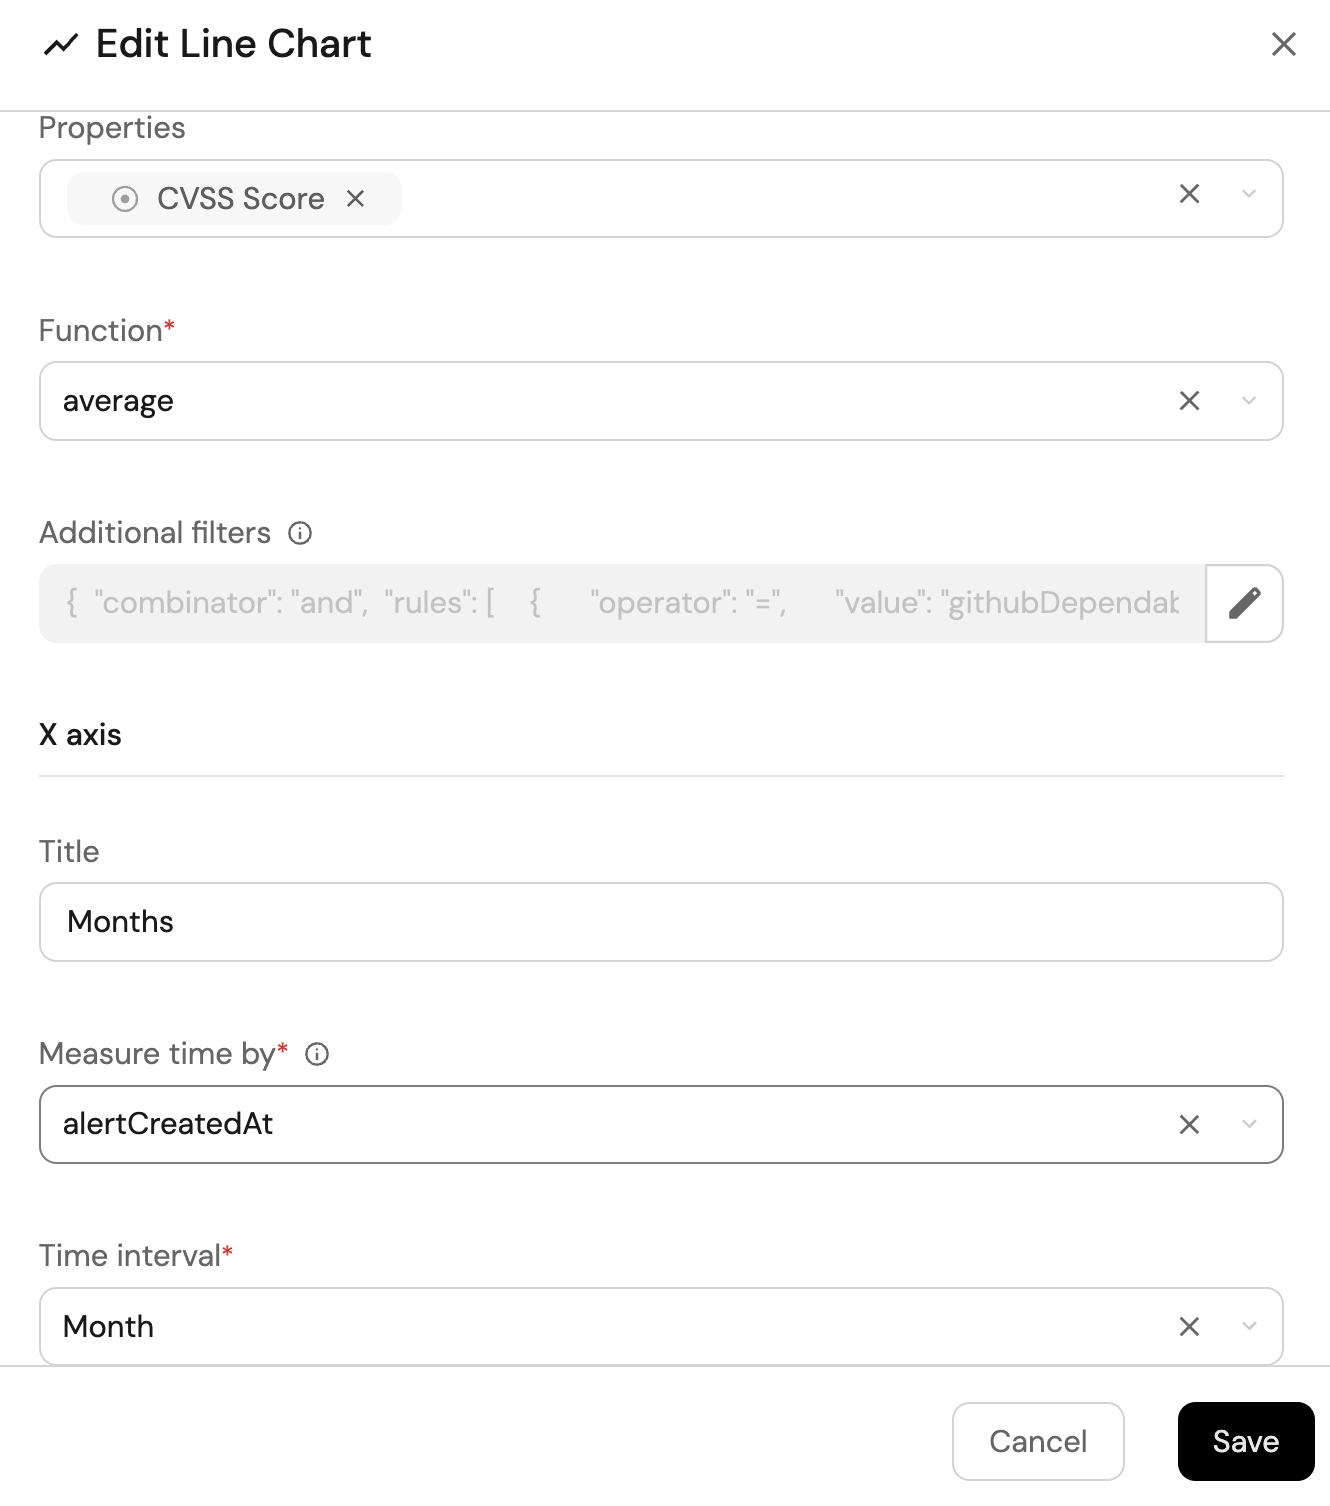
- Title:
-
Click
Save.
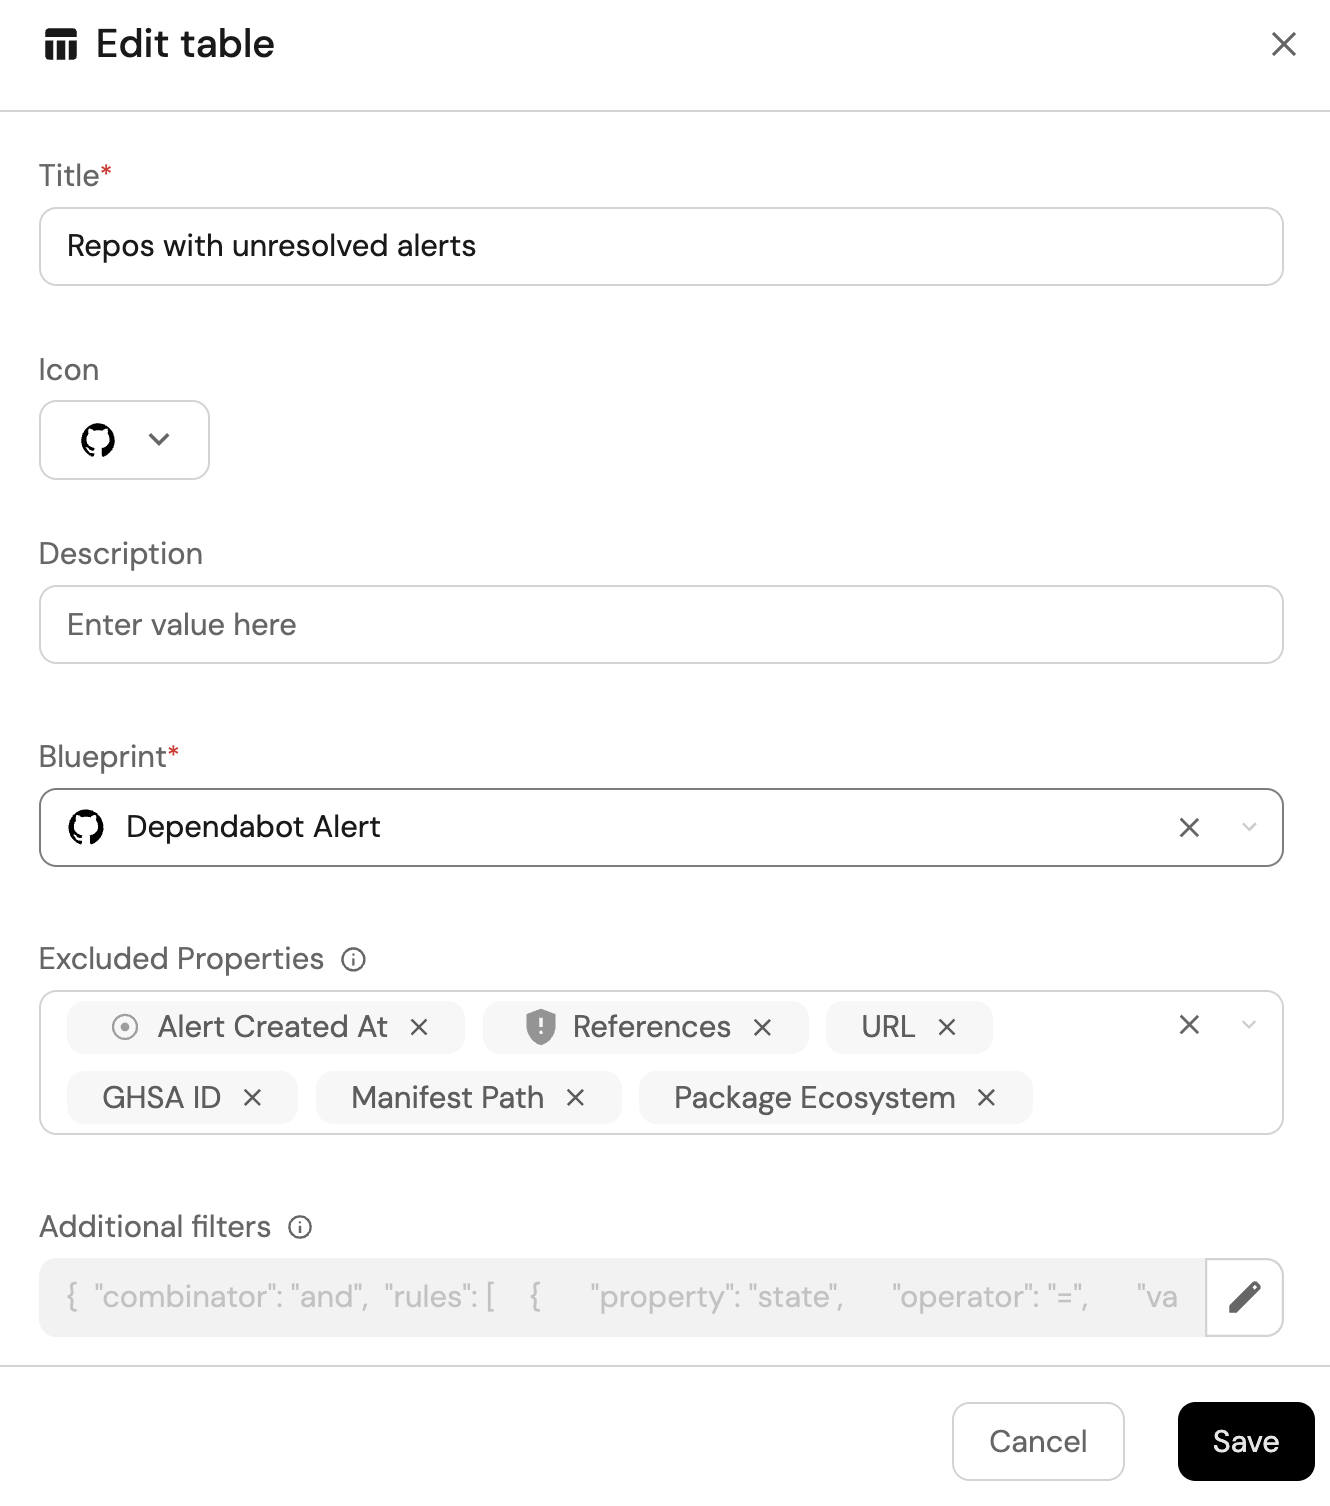
Repos with unresolved critical alerts (click to expand)
-
Click
+ Widgetand select Table. -
Title the widget Repos with unresolved alerts.
-
Choose the Dependabot Alert blueprint.
-
Click Save to add the widget to the dashboard.
-
Click on the
...button in the top right corner of the table and select Customize table. -
In the top right corner of the table, click on
Manage Propertiesand add the following properties:- Repositry: The name of each related repository.
- Package Name: The name of the package.
- CVE-ID: The ID of the vulnerability.
-
Click on the
Group by any Columnon the top right conner and select Repository. -
Click on the save icon in the top right corner of the widget to save the customized table.