Visualize lead time using Jira
Send this guide to your coding agent.
Prerequisite: Install Port MCP
Open plan mode. Implement this Port guide in my org via MCP:

https://docs.port.io/guides/all/visualize-jira-lead-time

Goal: get the guide's core flow working end-to-end in my org; adapting it to fit my existing setup takes priority over matching the guide 1:1.

Plan:
1. Confirm MCP is connected, in the right org, with sufficient permissions.
2. Diff the guide's data model (blueprints, properties, relations, actions, agents, automations, integrations, secrets) against mine.
3. Propose adaptations for gaps, reusing existing blueprints/relations over guide-named duplicates.
4. Flag what needs a UI click, credential, or secret from me, testing MCP capability empirically before ruling anything out.
5. Stop on any blocker and give me options. Approving this plan authorizes the writes it lists; pause only for writes beyond what's listed.

Build:
- Extend blueprint schema additively when upserting; don't remove or overwrite existing properties, and treat type conflicts as a blocker, not an auto-fix.
- List any mock data in the plan, minimal and labeled mock; once approved, seed it without re-asking, and tell me what you seeded.
- For anything the guide writes downstream (e.g. a webhook target), use a real entity, not a mock.
- For pages/widgets, use the real page identifier from the app URL, not a guessed slug.
- When you hit a UI step confirmed (not assumed) unsupported via MCP, pause, give exact clicks, then resume via MCP.
- Validate and give links after each meaningful step (only a tool-returned URL, no guessed paths); don't proceed if the last run wasn't a success.

Done:
- Confirm the guide's expected output exists and runs in Port.
- Summarize adaptations, seeded data, what was mocked or skipped, remaining UI steps, and how to verify.
This guide demonstrates how to track and visualize Jira lead time metrics in Port. Lead time measures the duration from when an issue is created until it reaches a "Done" state, giving you a clear signal of how quickly your teams deliver work.
- A calculation property on each Jira issue that computes its lead time in days.
- Aggregation properties on Jira projects that surface average and median lead time.
- An optional setup to connect Jira issues to services for team-level lead time tracking.
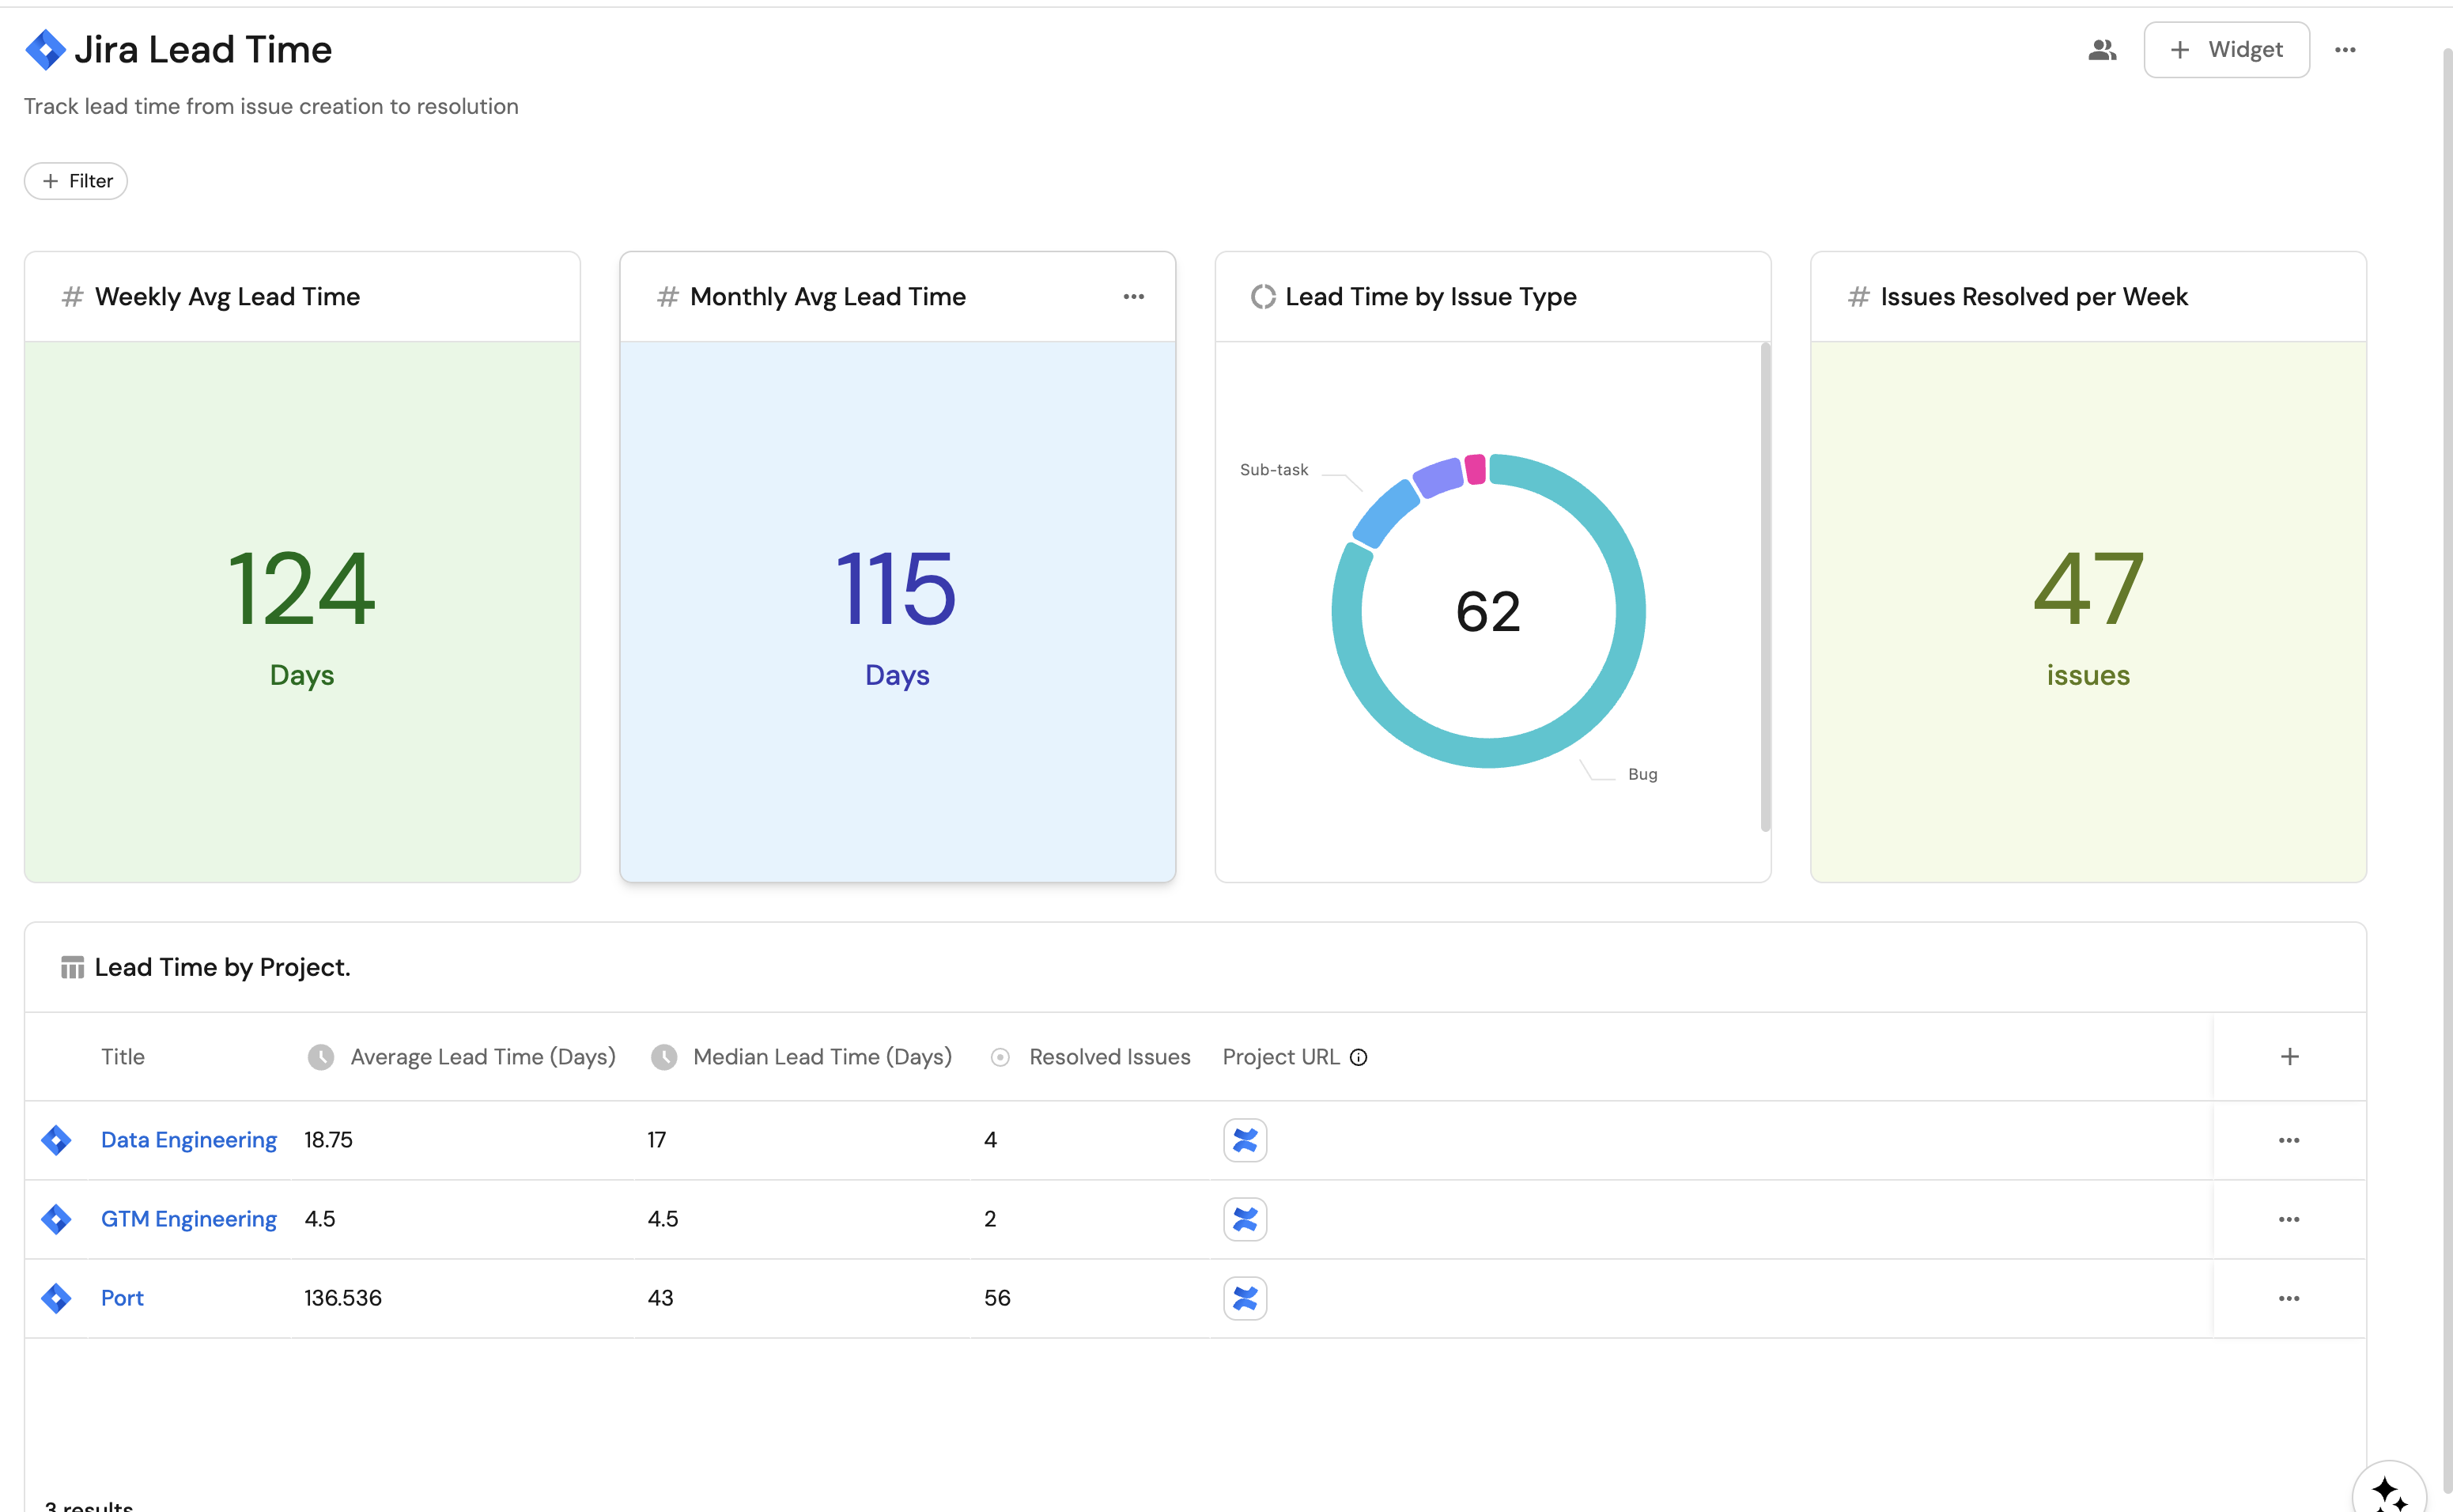
- A dashboard with widgets showing weekly averages, monthly averages, lead time distribution, and resolved issue tables.
Common use cases
- Identify bottlenecks by comparing lead time across projects and teams.
- Track whether process improvements are reducing delivery times week over week.
- Give engineering managers a real-time view of team velocity without leaving Port.
Prerequisites
This guide assumes the following:
- You have a Port account and have completed the onboarding process.
- Port's Jira integration is installed and syncing issues.
Set up the data model
The Jira integration ships with a jiraIssue blueprint that already includes created and resolutionDate properties. We will build on this foundation by adding a calculation property for per-issue lead time, then aggregation properties on jiraProject for project-level averages.
Add a lead time calculation property to Jira issues
The default jiraIssue blueprint includes a handlingDuration calculation property that computes the number of days between issue creation and resolution. If you already have this property, you can skip this step.
If it is missing, add it:
-
Go to your Builder page.
-
Select the Jira Issue blueprint.
-
Click on
{...} Edit JSON. -
Add the following inside the
calculationPropertiesobject, then click Save:"handlingDuration": {"title": "Lead Time (Days)","icon": "Clock","description": "Days from issue creation to resolution","calculation": "if (.properties.resolutionDate != null and .properties.created != null) then (((.properties.resolutionDate[0:19] + \"Z\" | fromdateiso8601) - (.properties.created[0:19] + \"Z\" | fromdateiso8601)) / 86400) else null end","type": "number"}
Every resolved issue will now display its lead time in days.
Add aggregation properties to Jira projects
Next, add aggregation properties to the jiraProject blueprint so you can see average and median lead time per project.
-
Go to your Builder page.
-
Select the Jira Project blueprint.
-
Click on
{...} Edit JSON. -
Add the following inside the
aggregationPropertiesobject, then click Save:Lead time aggregation properties (click to expand)
"avgLeadTimeDays": {"title": "Average Lead Time (Days)","icon": "Clock","type": "number","target": "jiraIssue","query": {"combinator": "and","rules": [{"property": "resolutionDate","operator": "isNotEmpty"}]},"calculationSpec": {"func": "average","averageOf": "total","property": "handlingDuration","calculationBy": "property"}},"medianLeadTimeDays": {"title": "Median Lead Time (Days)","icon": "Clock","type": "number","target": "jiraIssue","query": {"combinator": "and","rules": [{"property": "resolutionDate","operator": "isNotEmpty"}]},"calculationSpec": {"func": "median","property": "handlingDuration","calculationBy": "property"}},"resolvedIssuesCount": {"title": "Resolved Issues","icon": "DefaultProperty","type": "number","target": "jiraIssue","query": {"combinator": "and","rules": [{"property": "resolutionDate","operator": "isNotEmpty"}]},"calculationSpec": {"func": "count","calculationBy": "entities"}}
Each Jira project entity will now show average lead time, median lead time, and a resolved issue count computed from its related issues.
Connect Jira issues to services
The Jira integration creates a service relation on the jiraIssue blueprint by default, but the relation is not populated automatically. To get team-level lead time metrics, you need to map each issue to its service through the integration configuration.
The recommended approach is to use Jira labels that match your service identifiers in Port. Prefix labels with a consistent term (e.g. port-) so they can be distinguished from other labels.
-
In Jira, add a label to your issues following the pattern
port-<service-identifier>. For example, if your service in Port is identified asauth-service, label the issue withport-auth-service. -
Go to your Data Sources page and select the Jira integration.
-
In the
issuemapping, add the followingservicerelation underrelations:relations:project: .fields.project.keyparentIssue: .fields.parent.keysubtasks: .fields.subtasks | map(.key)service: .fields.labels | map(select(startswith("port-"))) | map(sub("port-"; ""; "g")) | .[0]This JQ expression filters labels that start with
port-, strips the prefix, and uses the first match as the service identifier. -
Click Save & Resync.
Issues with matching labels will now be linked to their respective service entities.
To automatically add the port- label when creating issues from Port, see the Manage and visualize Jira issues guide. For a full walkthrough of the label-based connection, see Connect Jira issue to a service.
Add aggregation properties to services
Once issues are connected to services, you can surface lead time metrics at the service (and therefore team) level.
-
Go to your Builder page.
-
Select the Service blueprint.
-
Click on
{...} Edit JSON. -
Add the following inside the
aggregationPropertiesobject, then click Save:Service lead time aggregation properties (click to expand)
"jiraAvgLeadTimeDays": {"title": "Avg Jira Lead Time (Days)","icon": "Clock","type": "number","target": "jiraIssue","query": {"combinator": "and","rules": [{"property": "resolutionDate","operator": "isNotEmpty"}]},"calculationSpec": {"func": "average","averageOf": "total","property": "handlingDuration","calculationBy": "property"}},"jiraMedianLeadTimeDays": {"title": "Median Jira Lead Time (Days)","icon": "Clock","type": "number","target": "jiraIssue","query": {"combinator": "and","rules": [{"property": "resolutionDate","operator": "isNotEmpty"}]},"calculationSpec": {"func": "median","property": "handlingDuration","calculationBy": "property"}},"jiraResolvedIssues": {"title": "Resolved Jira Issues","icon": "DefaultProperty","type": "number","target": "jiraIssue","query": {"combinator": "and","rules": [{"property": "resolutionDate","operator": "isNotEmpty"}]},"calculationSpec": {"func": "count","calculationBy": "entities"}}
Since services relate to teams, you can now view lead time per team by navigating the service-to-team ownership chain in your catalog.
Ensure resolved issues are ingested
The default Jira integration mapping uses a JQL filter that limits ingested issues. To ensure resolved issues are available for lead time calculations, verify your JQL includes recently resolved items.
Go to your Data Sources page, select the Jira integration, and check the jql selector for the issue kind:
- kind: issue
  selector:
    query: "true"
    jql: "(statusCategory != Done) OR (created >= -4w) OR (updated >= -4w)"
To capture more historical lead time data, widen the JQL window. For example, change -4w to -12w or -26w to include issues resolved in the last 3 or 6 months. Keep in mind that a wider window increases the number of ingested entities.
Create a lead time dashboard
With the data model in place, create a dashboard to visualize lead time metrics.
- Navigate to the Catalog page.
- Click + New in the left sidebar.
- Select New dashboard.
- Name the dashboard Jira Lead Time.
- Set the description to
Track lead time from issue creation to resolution. - Select the
Jiraicon. - Click Create.
Add widgets
In the new dashboard, create the following widgets:
Weekly average lead time (click to expand)
- Click
+ Widgetand select Number Chart. - Title:
Weekly Avg Lead Time. - Select
Aggregate by propertyChart type and choose Jira Issue as the Blueprint. - Select
Lead Time (Days)for the Property andaveragefor the Function. - Select
totalfor Average of. - Add this filter to scope to issues resolved in the past week:
{"combinator": "and","rules": [{"property": "resolutionDate","operator": "between","value": {"preset": "lastWeek"}}]}
- Select
customas the Unit and inputdaysas the Custom unit. - Click Save.
Monthly average lead time (click to expand)
- Click
+ Widgetand select Number Chart. - Title:
Monthly Avg Lead Time. - Select
Aggregate by propertyChart type and choose Jira Issue as the Blueprint. - Select
Lead Time (Days)for the Property andaveragefor the Function. - Select
totalfor Average of. - Add this filter to scope to issues resolved in the past month:
{"combinator": "and","rules": [{"property": "resolutionDate","operator": "between","value": {"preset": "lastMonth"}}]}
- Select
customas the Unit and inputdaysas the Custom unit. - Click Save.
Issues resolved per week (click to expand)
- Click
+ Widgetand select Number Chart. - Title:
Issues Resolved per Week(add theJiraicon). - Select
Count entitiesChart type and choose Jira Issue as the Blueprint. - Select
countfor the Function. - Add this filter:
{"combinator": "and","rules": [{"property": "resolutionDate","operator": "isNotEmpty"},{"property": "resolutionDate","operator": "between","value": {"preset": "lastWeek"}}]}
- Select
customas the Unit and inputissuesas the Custom unit. - Click Save.
Lead time by project (click to expand)
- Click
+ Widgetand select Table. - Title:
Lead Time by Project. - Choose the Jira Project blueprint.
- Add this filter to show only resolved issues:
{"combinator": "and","rules": [{"value": 0,"property": "resolvedIssuesCount","operator": "!="}]}
- Click Save.
- Click the
...button on the widget and select Customize table. - Click Manage Properties and add:
- Average Lead Time (Days).
- Median Lead Time (Days).
- Resolved Issues.
- Project URL.
- Click the save icon to save the customized table.
Lead time distribution by issue type (click to expand)
- Click
+ Widgetand select Pie chart. - Title:
Lead Time by Issue Type(add theJiraicon). - Choose the Jira Issue blueprint.
- Under Breakdown by property, select the Type property.
- Add this filter to only include resolved issues:
{"combinator": "and","rules": [{"property": "resolutionDate","operator": "isNotEmpty"}]}
- Click Save.
Summary
You now have a complete lead time tracking setup:
- Issue level: Each resolved Jira issue displays its lead time in days via the
handlingDurationcalculation property. - Project level: Each Jira project shows average and median lead time through aggregation properties.
- Service and team level (optional): By connecting Jira issues to services, lead time metrics flow up through the service-to-team ownership chain.
- Dashboard: Weekly and monthly averages, project comparisons, and a sorted table of slowest issues give you actionable visibility.