Visualize Claude metrics
This guide demonstrates how to set up a monitoring dashboard to gain insights into your Claude API usage using Port. You'll learn how to visualize key metrics like token consumption, costs, model distribution, cache efficiency, and track Claude Code activity over time.
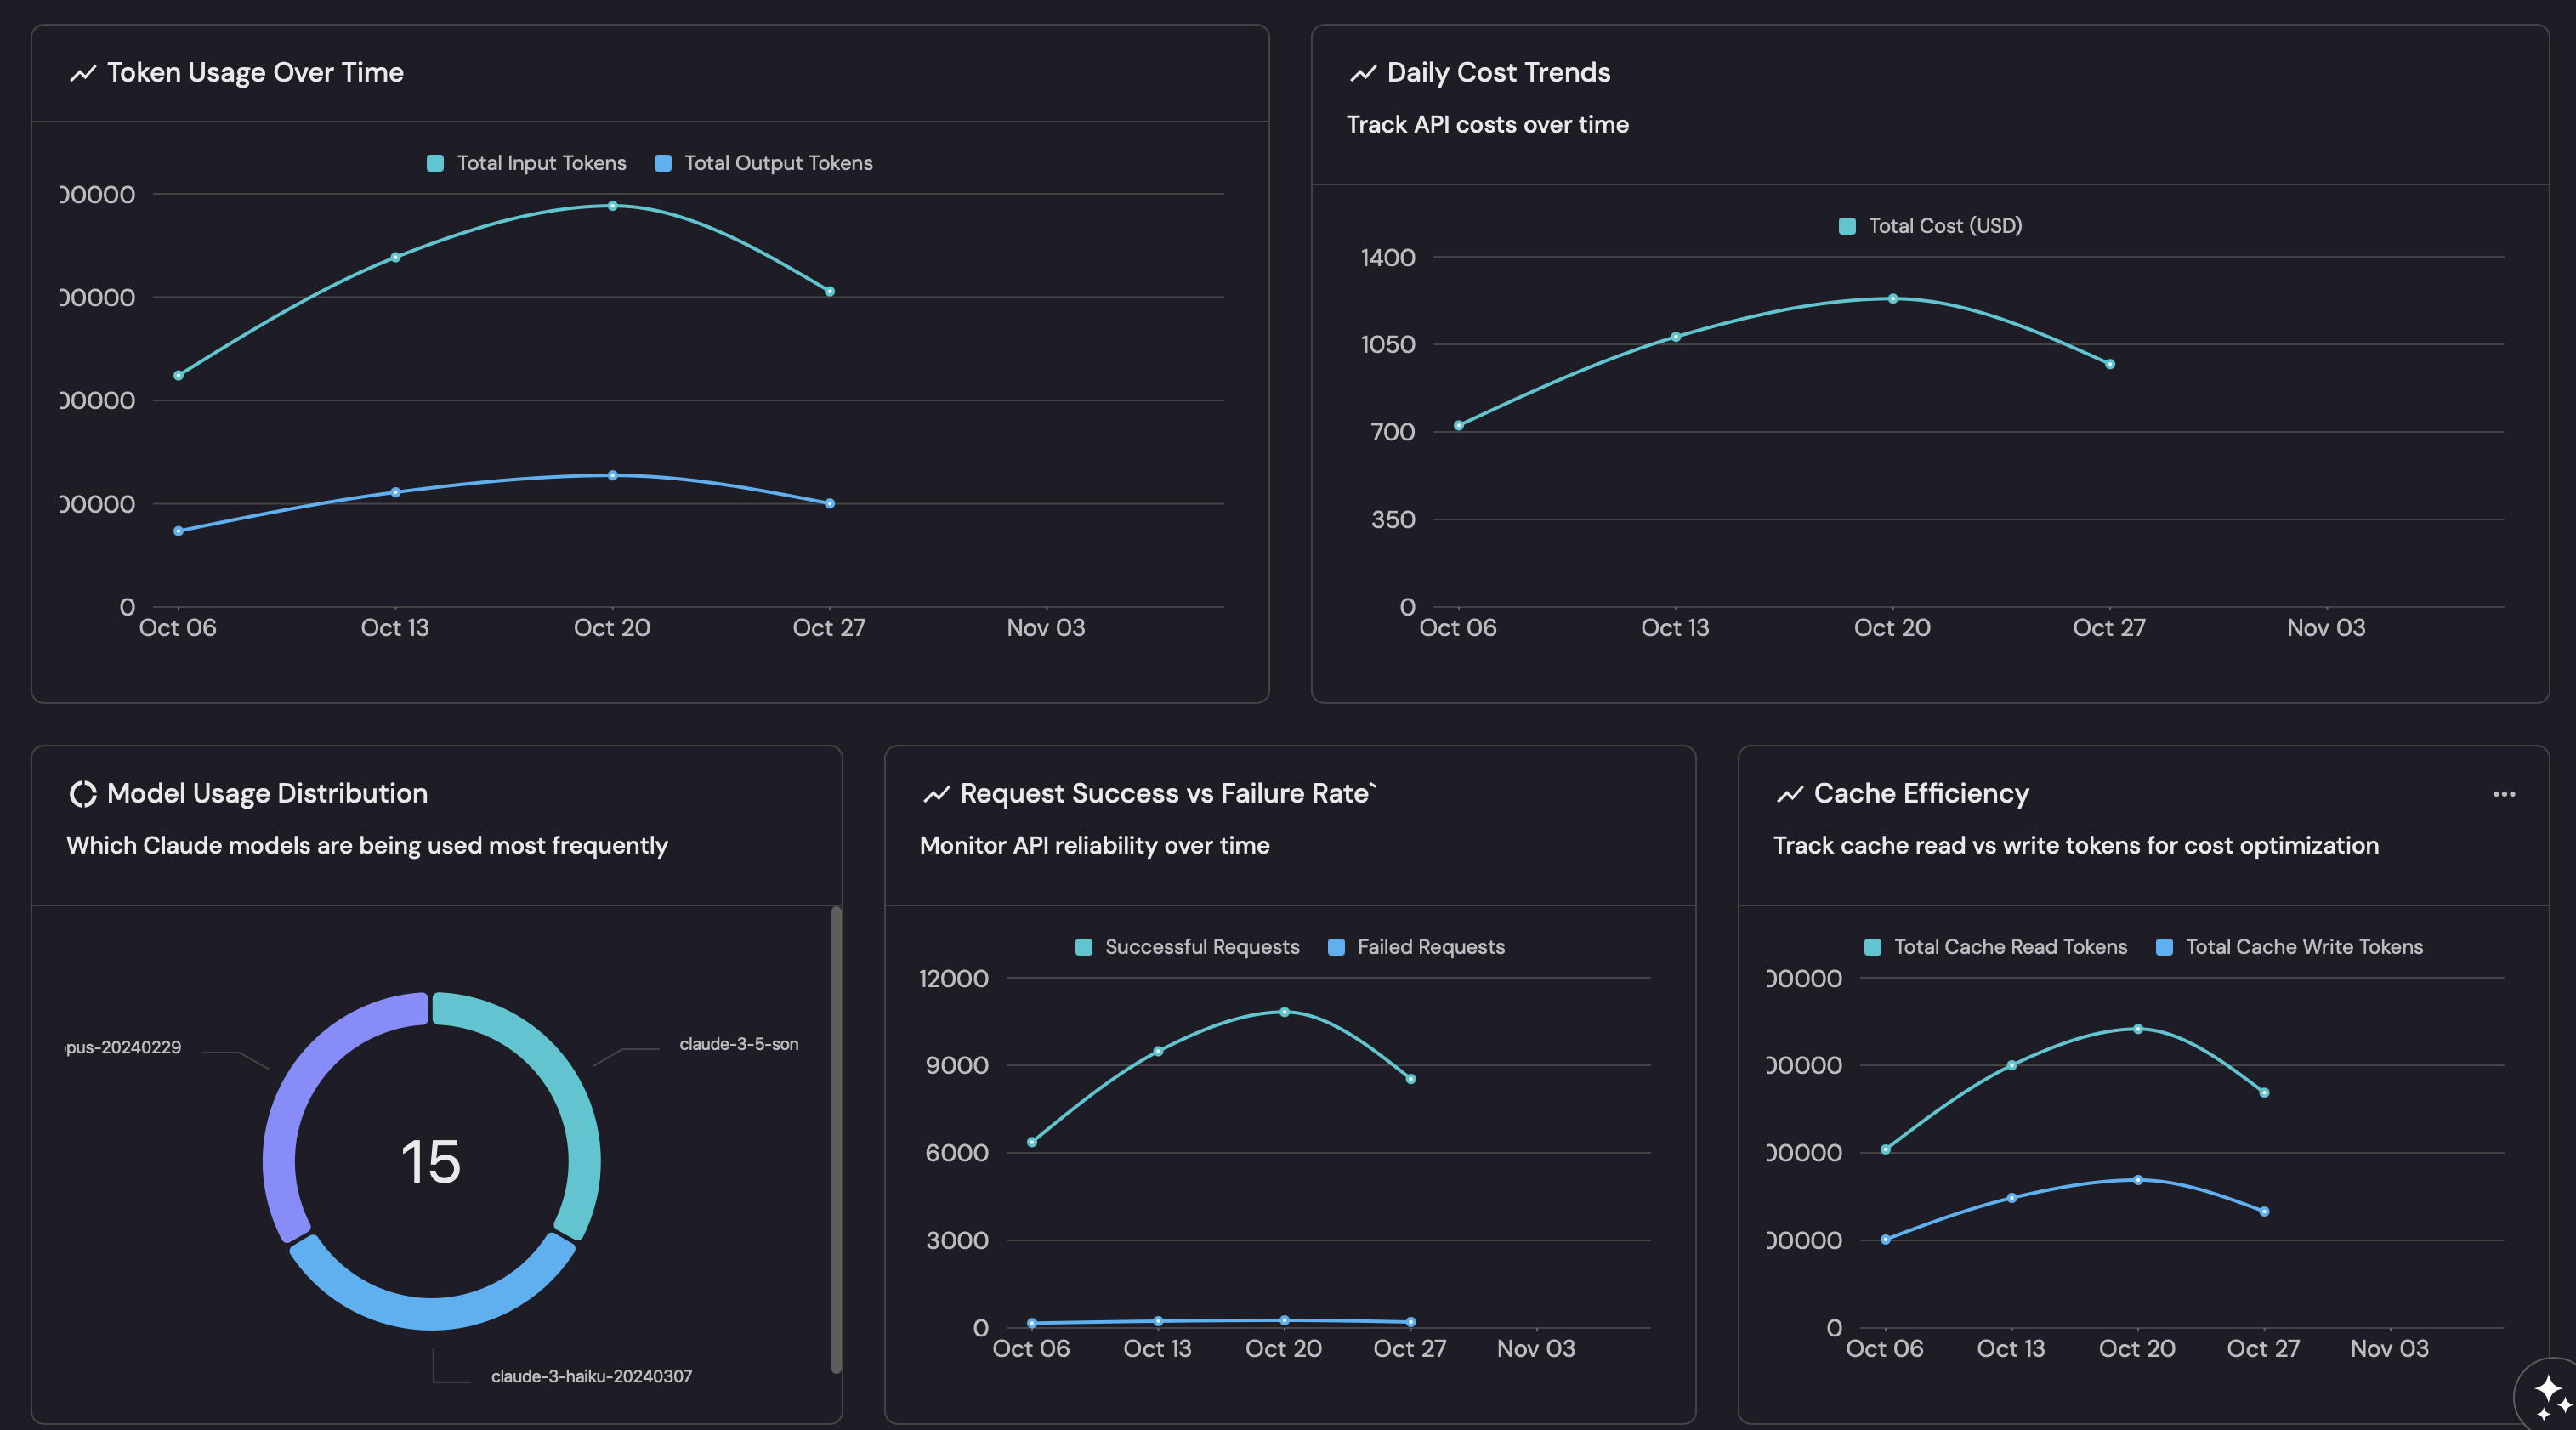
Common use cases
- Monitor Claude API token consumption trends.
- Track API costs and optimize spending across models.
- Analyze model distribution to understand which Claude models are used most.
- Monitor cache efficiency to optimize costs.
- Track Claude Code sessions, commits, and pull requests.
Prerequisites
This guide assumes the following:
- You have a Port account and have completed the onboarding process.
- Port's Claude AI integration is installed and syncing data.
Create the dashboard
-
Navigate to your context lake.
-
Click on the
+button in the left sidebar. -
Select New dashboard.
-
Name the dashboard Claude AI Insights.
-
Input
Monitor Claude API usage, costs, and performance metricsunder Description. -
Select the
Claudeicon. -
Click
Create.
You now have a blank dashboard where you can add widgets to visualize your Claude metrics.
Add widgets
Create the following widgets to gain insights into your Claude API usage:
Total output tokens widget
Total output tokens (click to expand)
-
Click on
+ Widgetand select Number Chart. -
Fill in the following details:
- Title:
Total Output Tokens. - Description:
Total output tokens generated by Claude. - Icon:
BlankPage. - Blueprint:
claude_usage_record. - Chart type: Select
Aggregate by property. - Property:
output_tokens. - Function:
Sum.
- Title:
-
Click
Save.
Total cost widget
Total cost (click to expand)
-
Click on
+ Widgetand select Number Chart. -
Fill in the following details:
- Title:
Total Cost (USD). - Description:
Total cost of Claude API usage. - Icon:
DollarSign. - Blueprint:
claude_cost_record. - Chart type: Select
Aggregate by property. - Property:
amount. - Function:
Sum.
- Title:
-
Click
Save.
Total web searches widget
Total web searches (click to expand)
-
Click on
+ Widgetand select Number Chart. -
Fill in the following details:
- Title:
Total Web Searches. - Description:
Total web search requests made by Claude. - Icon:
Search. - Blueprint:
claude_usage_record. - Chart type: Select
Aggregate by property. - Property:
web_search_requests. - Function:
Sum.
- Title:
-
Click
Save.
Token usage over time widget
Token usage over time (click to expand)
-
Click on
+ Widgetand select Line Chart. -
Title:
Token Usage Over Time. Description:Track input and output token consumption. Icon:LineChart. -
Set X axis:
- Title:
Date. - Time interval:
Week. - Time range:
In the past 30 days.
- Title:
-
Set Y axis title:
Tokens. -
Click + Line and configure:
- Title:
Uncached Input Tokens. - Chart type:
Aggregate by property. - Blueprint:
claude_usage_record. - Property:
uncached_input_tokens. - Function:
Sum. - Measure time by:
record_date.
- Title:
-
Click + Line and configure:
- Title:
Output Tokens. - Chart type:
Aggregate by property. - Blueprint:
claude_usage_record. - Property:
output_tokens. - Function:
Sum. - Measure time by:
record_date.
- Title:
-
Click
Save.
Daily cost trends widget
Daily cost trends (click to expand)
-
Click on
+ Widgetand select Line Chart. -
Title:
Daily Cost Trends. Description:Track API costs over time. Icon:LineChart. -
Set X axis:
- Title:
Date. - Time interval:
Week. - Time range:
In the past 30 days.
- Title:
-
Set Y axis title:
Cost. -
Click + Line and configure:
- Title:
Amount. - Chart type:
Aggregate by property. - Blueprint:
claude_cost_record. - Property:
amount. - Function:
Sum. - Measure time by:
record_date.
- Title:
-
Click
Save.
Model usage distribution widget
Model usage distribution (click to expand)
-
Click on
+ Widgetand select Pie Chart. -
Fill in the following details:
- Title:
Model Usage Distribution. - Description:
Which Claude models are being used most frequently. - Icon:
Pie. - Blueprint:
claude_model_usage. - Property:
model.
- Title:
-
Click
Save.
Tokens by model widget
Tokens by model (click to expand)
-
Click on
+ Widgetand select Line Chart. -
Title:
Output Tokens by Model. Description:Track token consumption per model over time. Icon:LineChart. -
Set X axis:
- Title:
Date. - Time interval:
Week. - Time range:
In the past 30 days.
- Title:
-
Set Y axis title:
Tokens. -
Click + Line and configure:
- Title:
Output Tokens. - Chart type:
Aggregate by property. - Blueprint:
claude_model_usage. - Property:
output_tokens. - Function:
Sum. - Measure time by:
record_date. - Breakdown by:
model.
- Title:
-
Click
Save.
Claude Code activity widget
Claude Code activity (click to expand)
-
Click on
+ Widgetand select Line Chart. -
Title:
Claude Code Activity. Description:Track Claude Code sessions, commits, and PRs over time. Icon:LineChart. -
Set X axis:
- Title:
Date. - Time interval:
Week. - Time range:
In the past 30 days.
- Title:
-
Set Y axis title:
Count. -
Click + Line and configure:
- Title:
Sessions. - Chart type:
Aggregate by property. - Blueprint:
claude_code_analytics. - Property:
num_sessions. - Function:
Sum. - Measure time by:
record_date.
- Title:
-
Click + Line and configure:
- Title:
Commits. - Chart type:
Aggregate by property. - Blueprint:
claude_code_analytics. - Property:
commits. - Function:
Sum. - Measure time by:
record_date.
- Title:
-
Click + Line and configure:
- Title:
Pull Requests. - Chart type:
Aggregate by property. - Blueprint:
claude_code_analytics. - Property:
pull_requests. - Function:
Sum. - Measure time by:
record_date.
- Title:
-
Click
Save.
Cache efficiency widget
Cache efficiency (click to expand)
-
Click on
+ Widgetand select Line Chart. -
Title:
Cache Efficiency. Description:Track cache read vs creation tokens for cost optimization. Icon:LineChart. -
Set X axis:
- Title:
Date. - Time interval:
Week. - Time range:
In the past 30 days.
- Title:
-
Set Y axis title:
Tokens. -
Click + Line and configure:
- Title:
Cache Read Input Tokens. - Chart type:
Aggregate by property. - Blueprint:
claude_usage_record. - Property:
cache_read_input_tokens. - Function:
Sum. - Measure time by:
record_date.
- Title:
-
Click + Line and configure:
- Title:
Cache Creation Tokens. - Chart type:
Aggregate by property. - Blueprint:
claude_usage_record. - Property:
cache_creation_5m_tokens. - Function:
Sum. - Measure time by:
record_date.
- Title:
-
Click
Save.