Visualize and manage your Statuspage components
This guide demonstrates how to bring your Statuspage components management experience into Port. You will learn how to:
- Ingest Statuspage components data into Port's software catalog using Port's Statuspage integration.
- Set up a self-service action to manage components.
- Build dashboards in Port to monitor and act on components.
Common use cases
- Monitor the status and health of all Statuspage components from a centralized dashboard.
- Empower platform teams to automate day-2 operations via Webhooks.
Prerequisites
This guide assumes the following:
- You have a Port account and have completed the onboarding process.
- Port's Statuspage integration is installed in your account.
Set up self-service actions
We will create a self-service action in Port to directly interact with the Statuspage REST API. This action lets users update the status of a component.
The action will be configured via JSON and triggered using synced webhooks secured with secrets. To implement this use-case, follow the steps below:
Add Port secrets
To add a secret to your portal:
-
Click on the
...button in the top right corner of your Port application. -
Click on Credentials.
-
Click on the
Secretstab. -
Click on
+ Secretand add the following secret:_STATUSPAGE_API_KEY: Your Statuspage API key. Follow the Statuspage documentation on how to create the API key.
Update Statuspage component status
-
Go to the Self-service page of your portal.
-
Click on the
+ New Actionbutton. -
Click on the
{...} Edit JSONbutton. -
Copy and paste the following JSON configuration into the editor.
Update Statuspage component status action (Click to expand)
{
  "identifier": "update_status_page_component",
  "title": "Update Statuspage Component Status",
  "icon": "StatusPage",
  "description": "Updates the status of an existing Statuspage component",
  "trigger": {
    "type": "self-service",
    "operation": "DAY-2",
    "userInputs": {
      "properties": {
        "status": {
          "type": "string",
          "title": "Status",
          "enum": [
            "operational",
            "degraded_performance",
            "partial_outage",
            "major_outage",
            "under_maintenance"
          ],
          "enumColors": {
            "operational": "green",
            "degraded_performance": "yellow",
            "partial_outage": "orange",
            "major_outage": "red",
            "under_maintenance": "blue"
          }
        }
      },
      "required": [
        "status"
      ],
      "order": [
        "status"
      ]
    },
    "blueprintIdentifier": "statuspageComponent"
  },
  "invocationMethod": {
    "type": "WEBHOOK",
    "url": "https://api.statuspage.io/v1/pages/{{.entity.relations.statuspage}}/components/{{.entity.identifier}}",
    "agent": false,
    "synchronized": true,
    "method": "PATCH",
    "headers": {
      "Content-Type": "application/json",
      "Authorization": "OAuth {{.secrets._STATUSPAGE_API_KEY}}"
    },
    "body": {
      "component": {
        "status": "{{ .inputs.status }}"
      }
    }
  },
  "requiredApproval": false
} -
Click
Save.
Now you should see the Update Statuspage Component Status action in the self-service page. 🎉
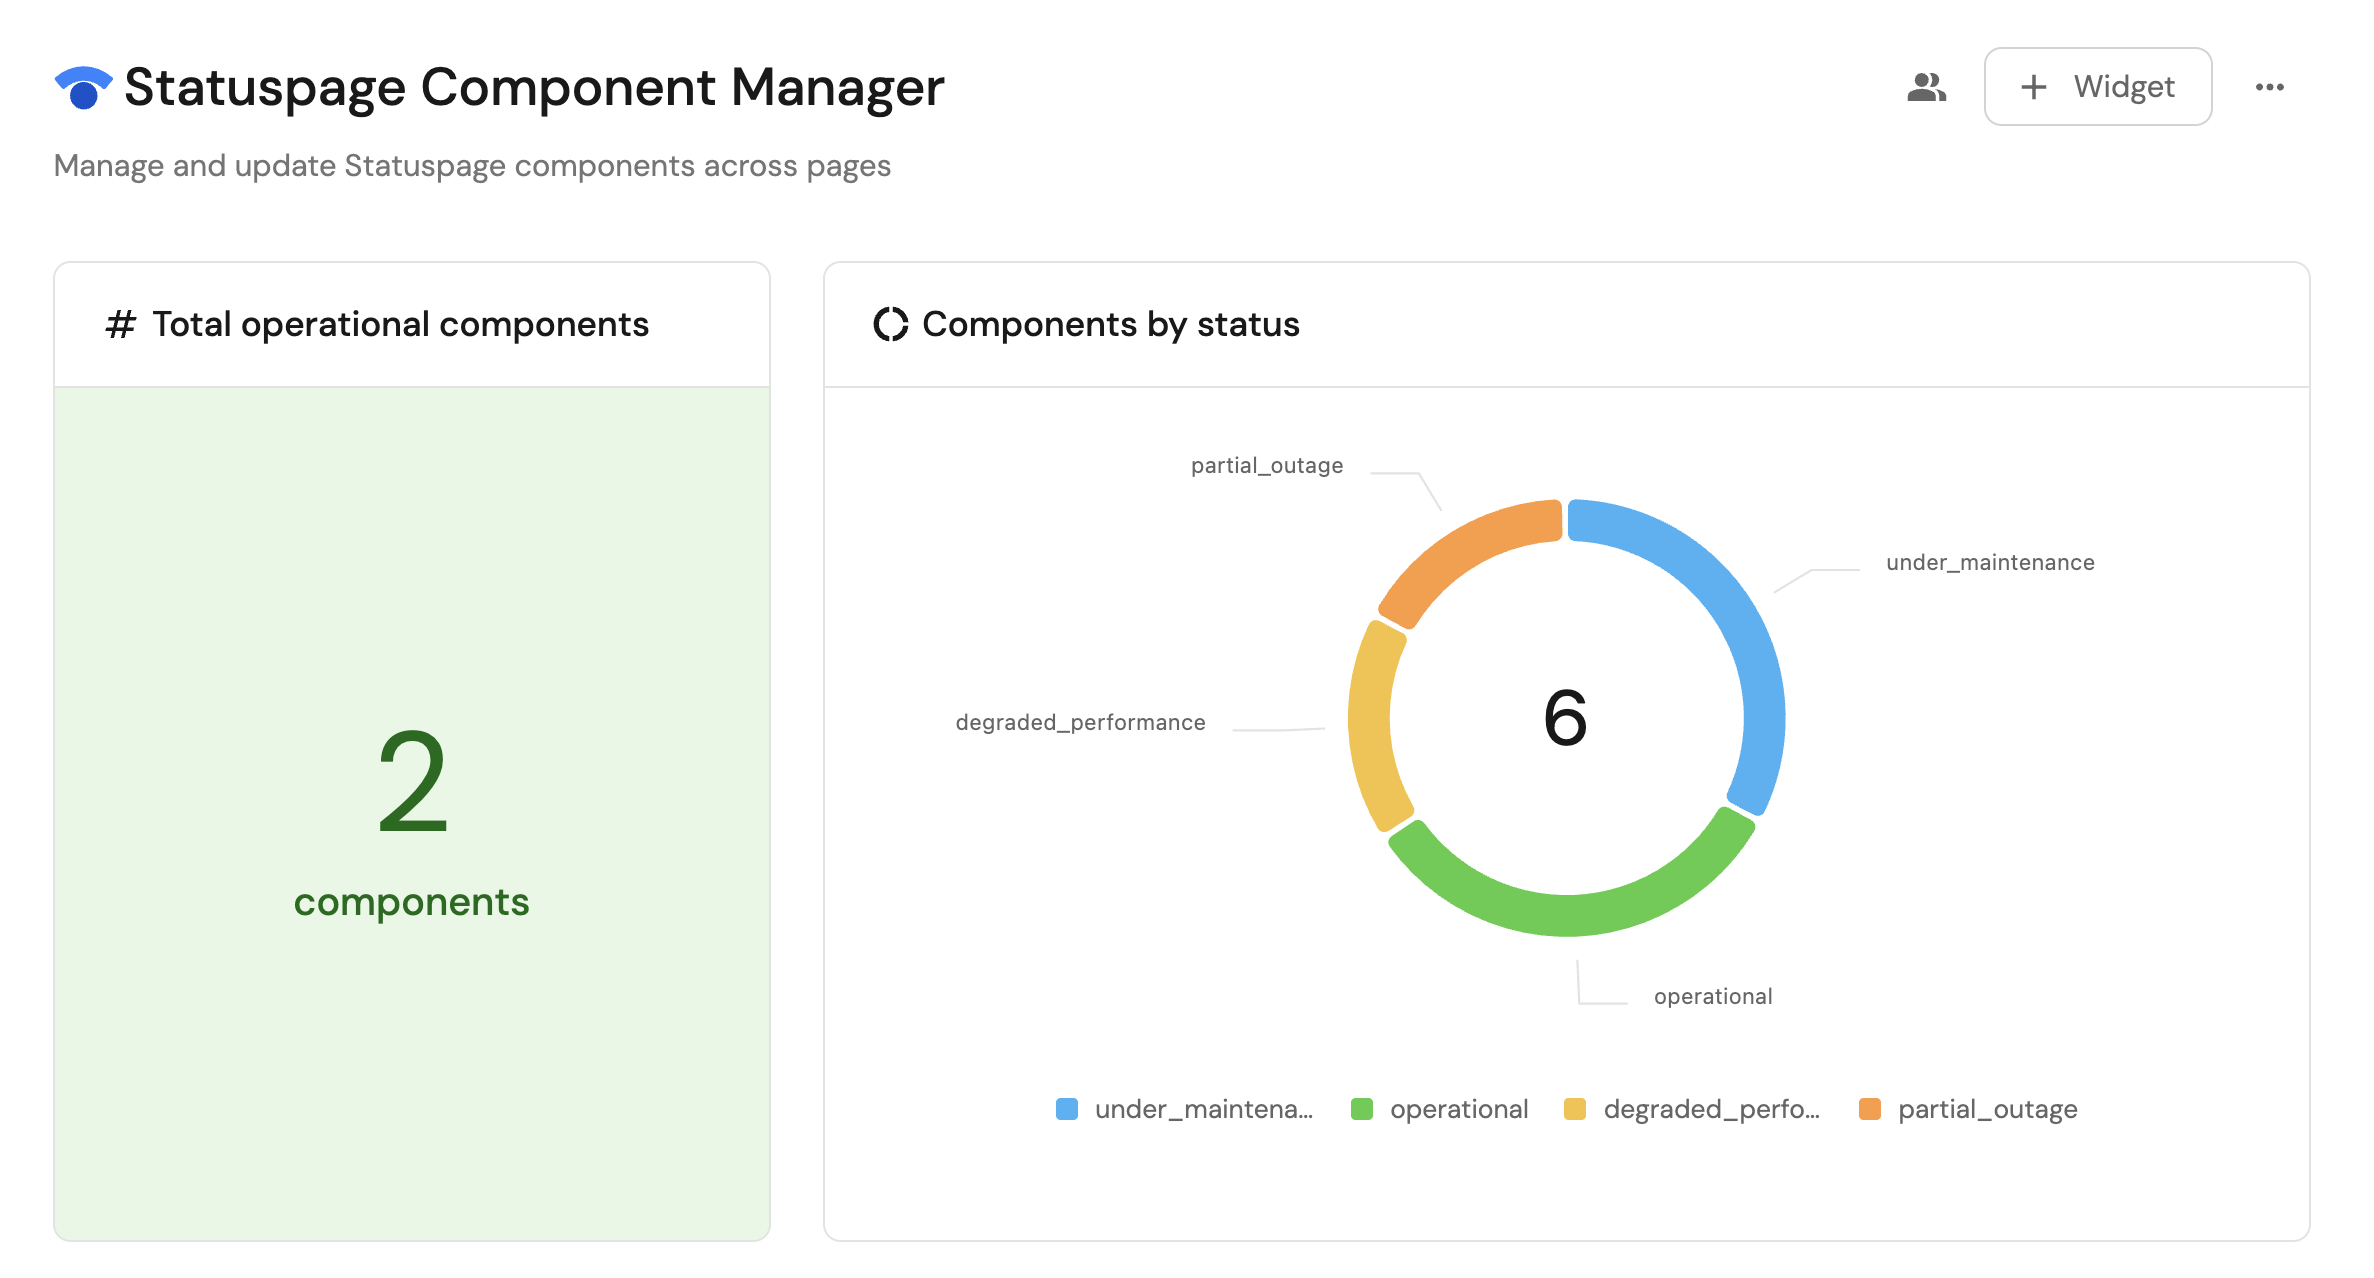
Visualize metrics
With components ingested and action configured, the next step is building a dashboard to monitor Statuspage data directly in Port. We can visualize all components by status using customizable widgets. In addition, we can trigger remediation workflows right from your dashboard.
Create a dashboard
- Navigate to the Catalog page of your portal.
- Click on the
+ Newbutton in the left sidebar. - Select New dashboard.
- Name the dashboard Statuspage Component Manager.
- Input
Manage and update Statuspage components across pagesunder Description. - Select the
StatusPageicon. - Click
Create.
We now have a blank dashboard where we can start adding widgets to visualize insights from our Statuspage components.
Add widgets
In the new dashboard, create the following widgets:
Total operational components (click to expand)
-
Click
+ Widgetand select Number Chart. -
Title:
Total operational components(add theStatusPageicon). -
Select
Count entitiesChart type and choose Statuspage Component as the Blueprint. -
Select
countfor the Function. -
Add this JSON to the Additional filters editor to filter
operationalcomponents:[
{
"combinator":"and",
"rules":[
{
"property":"status",
"operator":"=",
"value":"operational"
}
]
}
] -
Select
customas the Unit and inputcomponentsas the Custom unit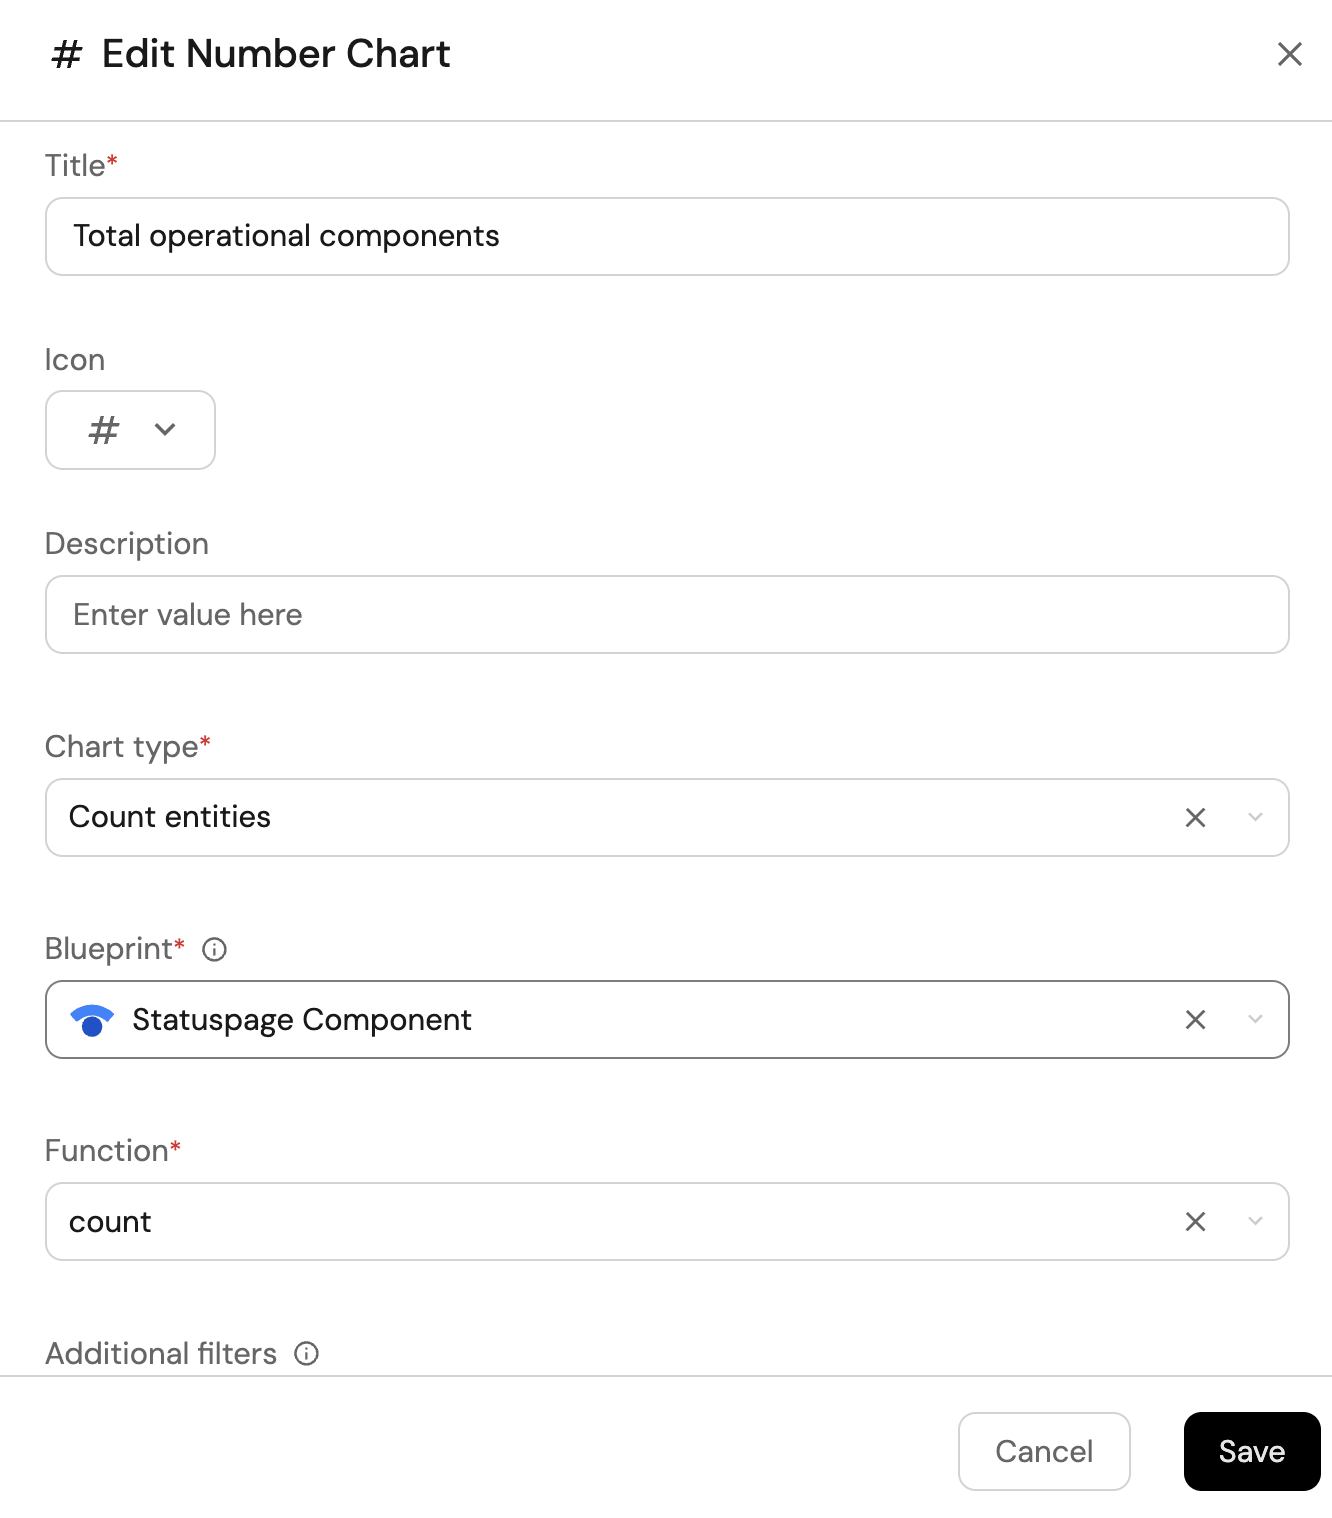
-
Click
Save.
Components by status (click to expand)
-
Click
+ Widgetand select Pie chart. -
Title:
Components by status(add theStatusPageicon). -
Choose the Statuspage Component blueprint.
-
Under
Breakdown by property, select the Current Status property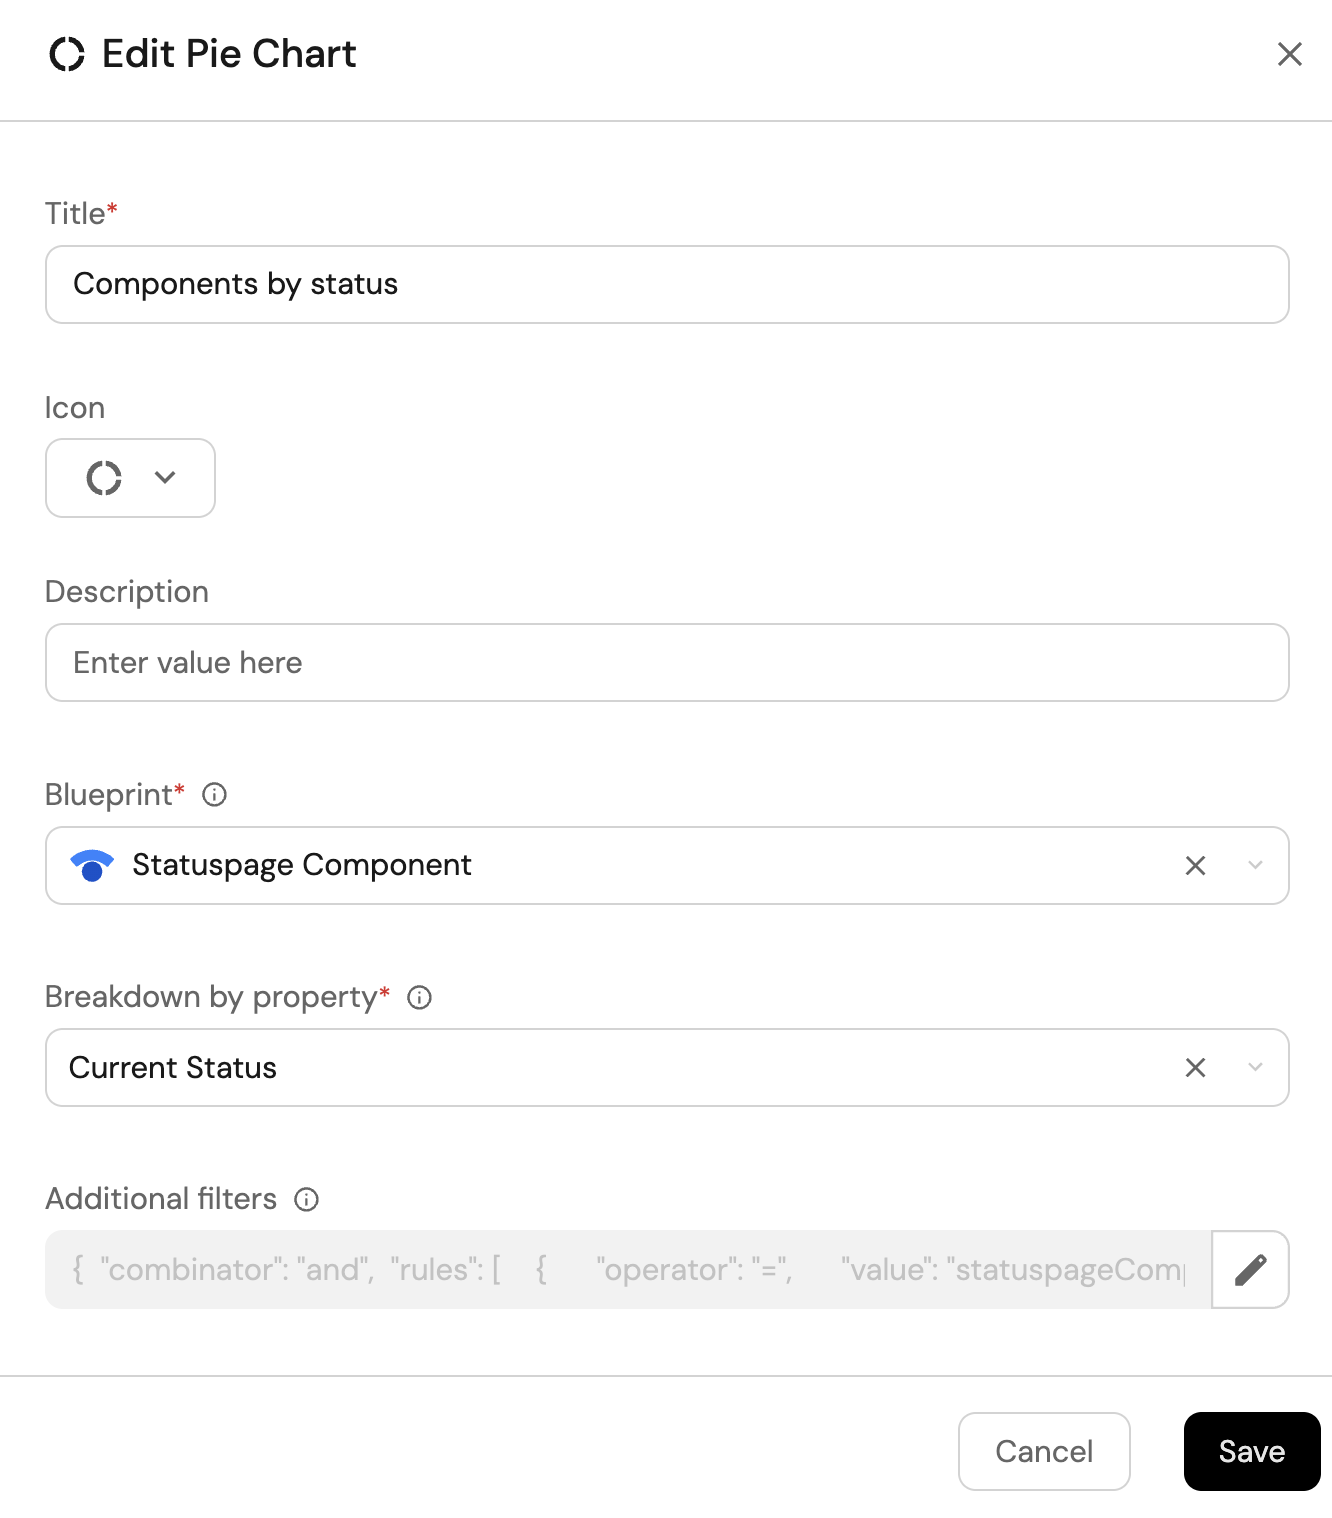
-
Click Save.
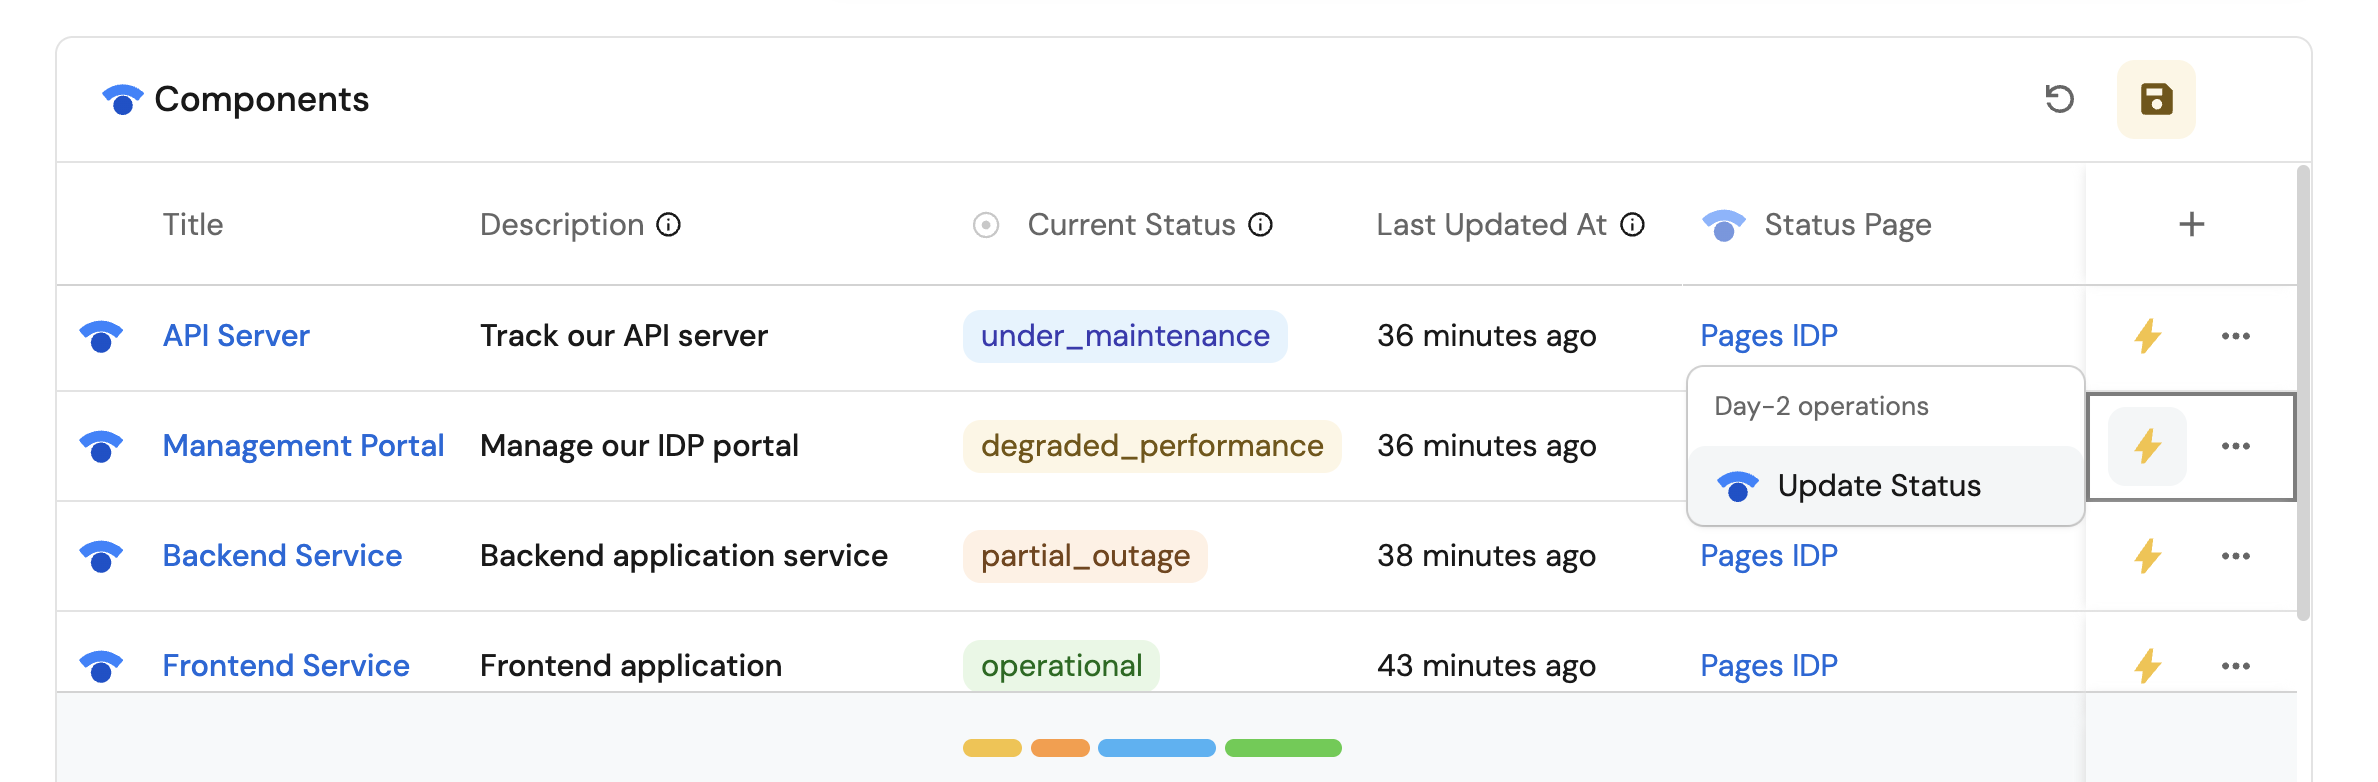
All StatusPage components view (click to expand)
-
Click
+ Widgetand select Table. -
Title the widget All Components.
-
Choose the Statuspage Component blueprint
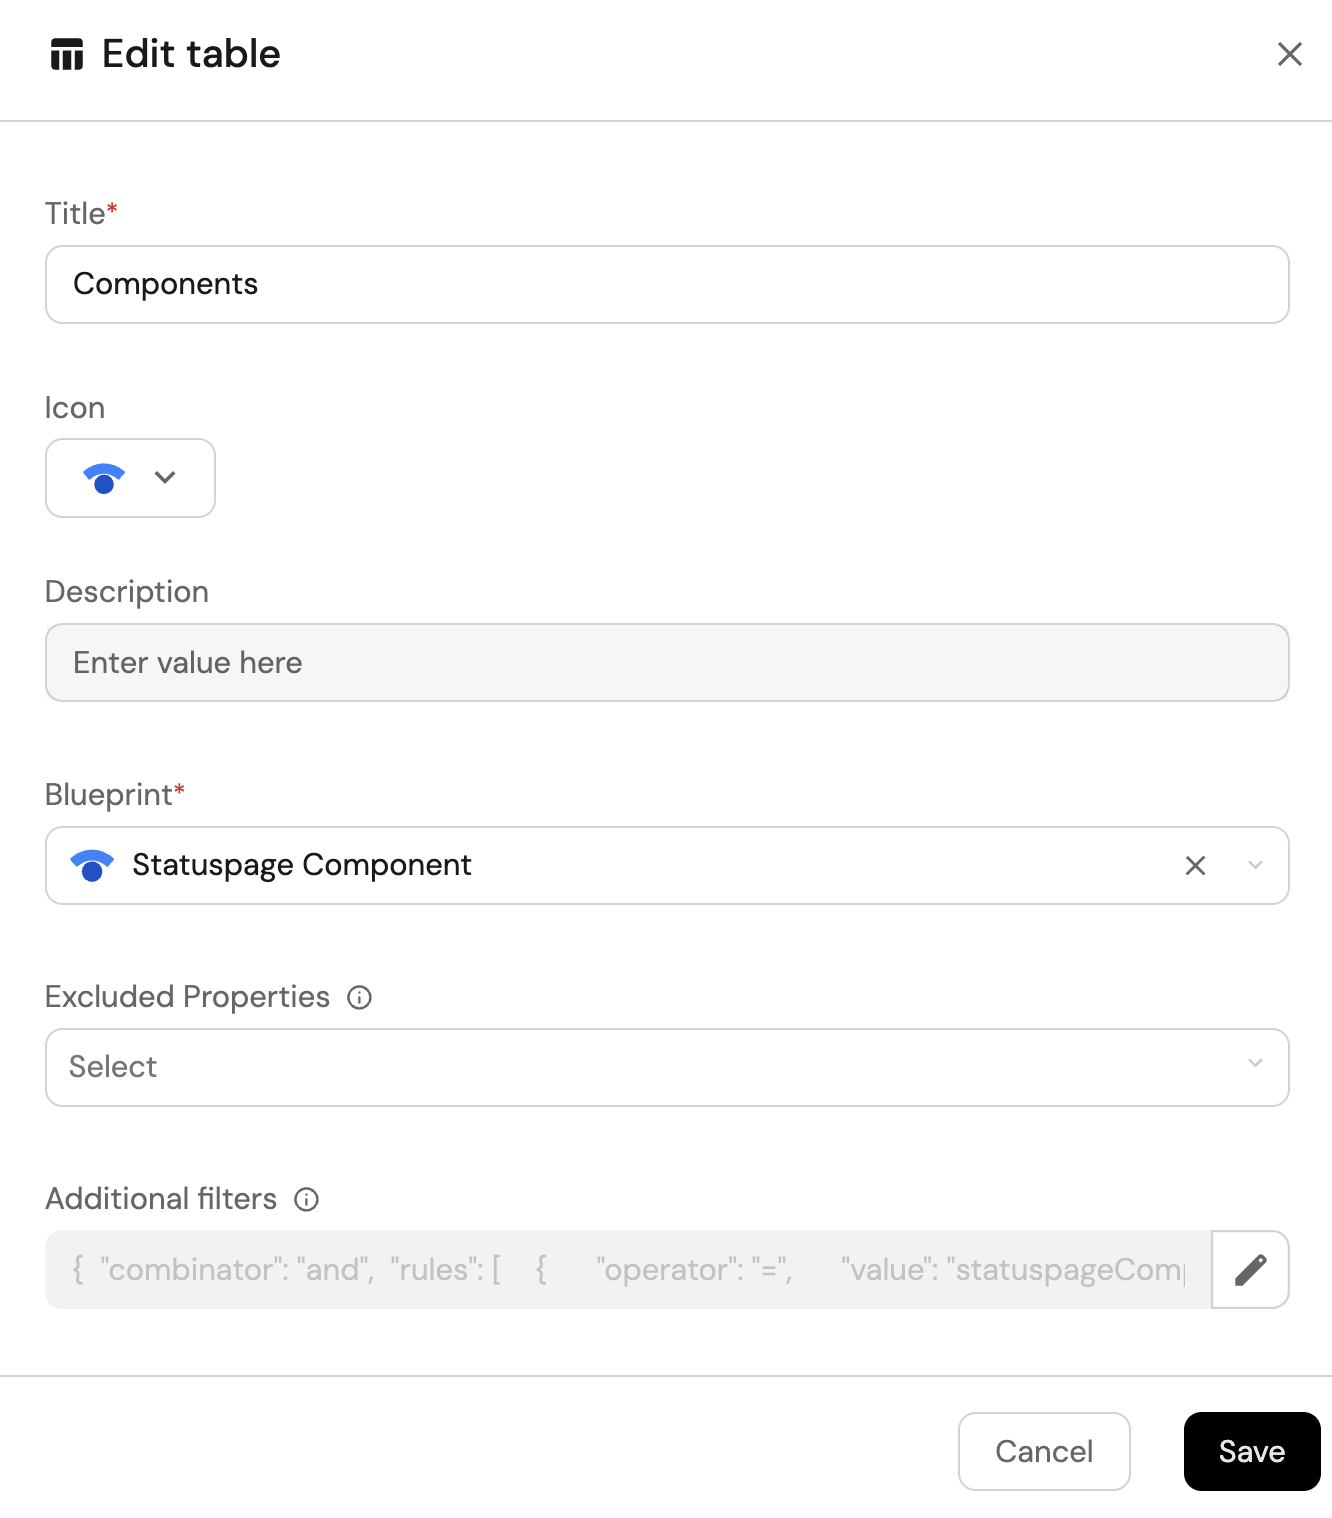
-
Click Save to add the widget to the dashboard.
-
Click on the
...button in the top right corner of the table and select Customize table. -
In the top right corner of the table, click on
Manage Propertiesand add the following properties:- Current Status: The current status of the component.
- Description: The description of the component.
- Last Updated At: The date the component was last updated.
- Status Page: The related Statuspage.
-
Click on the save icon in the top right corner of the widget to save the customized table.