Triage incidents with Dynatrace MCP
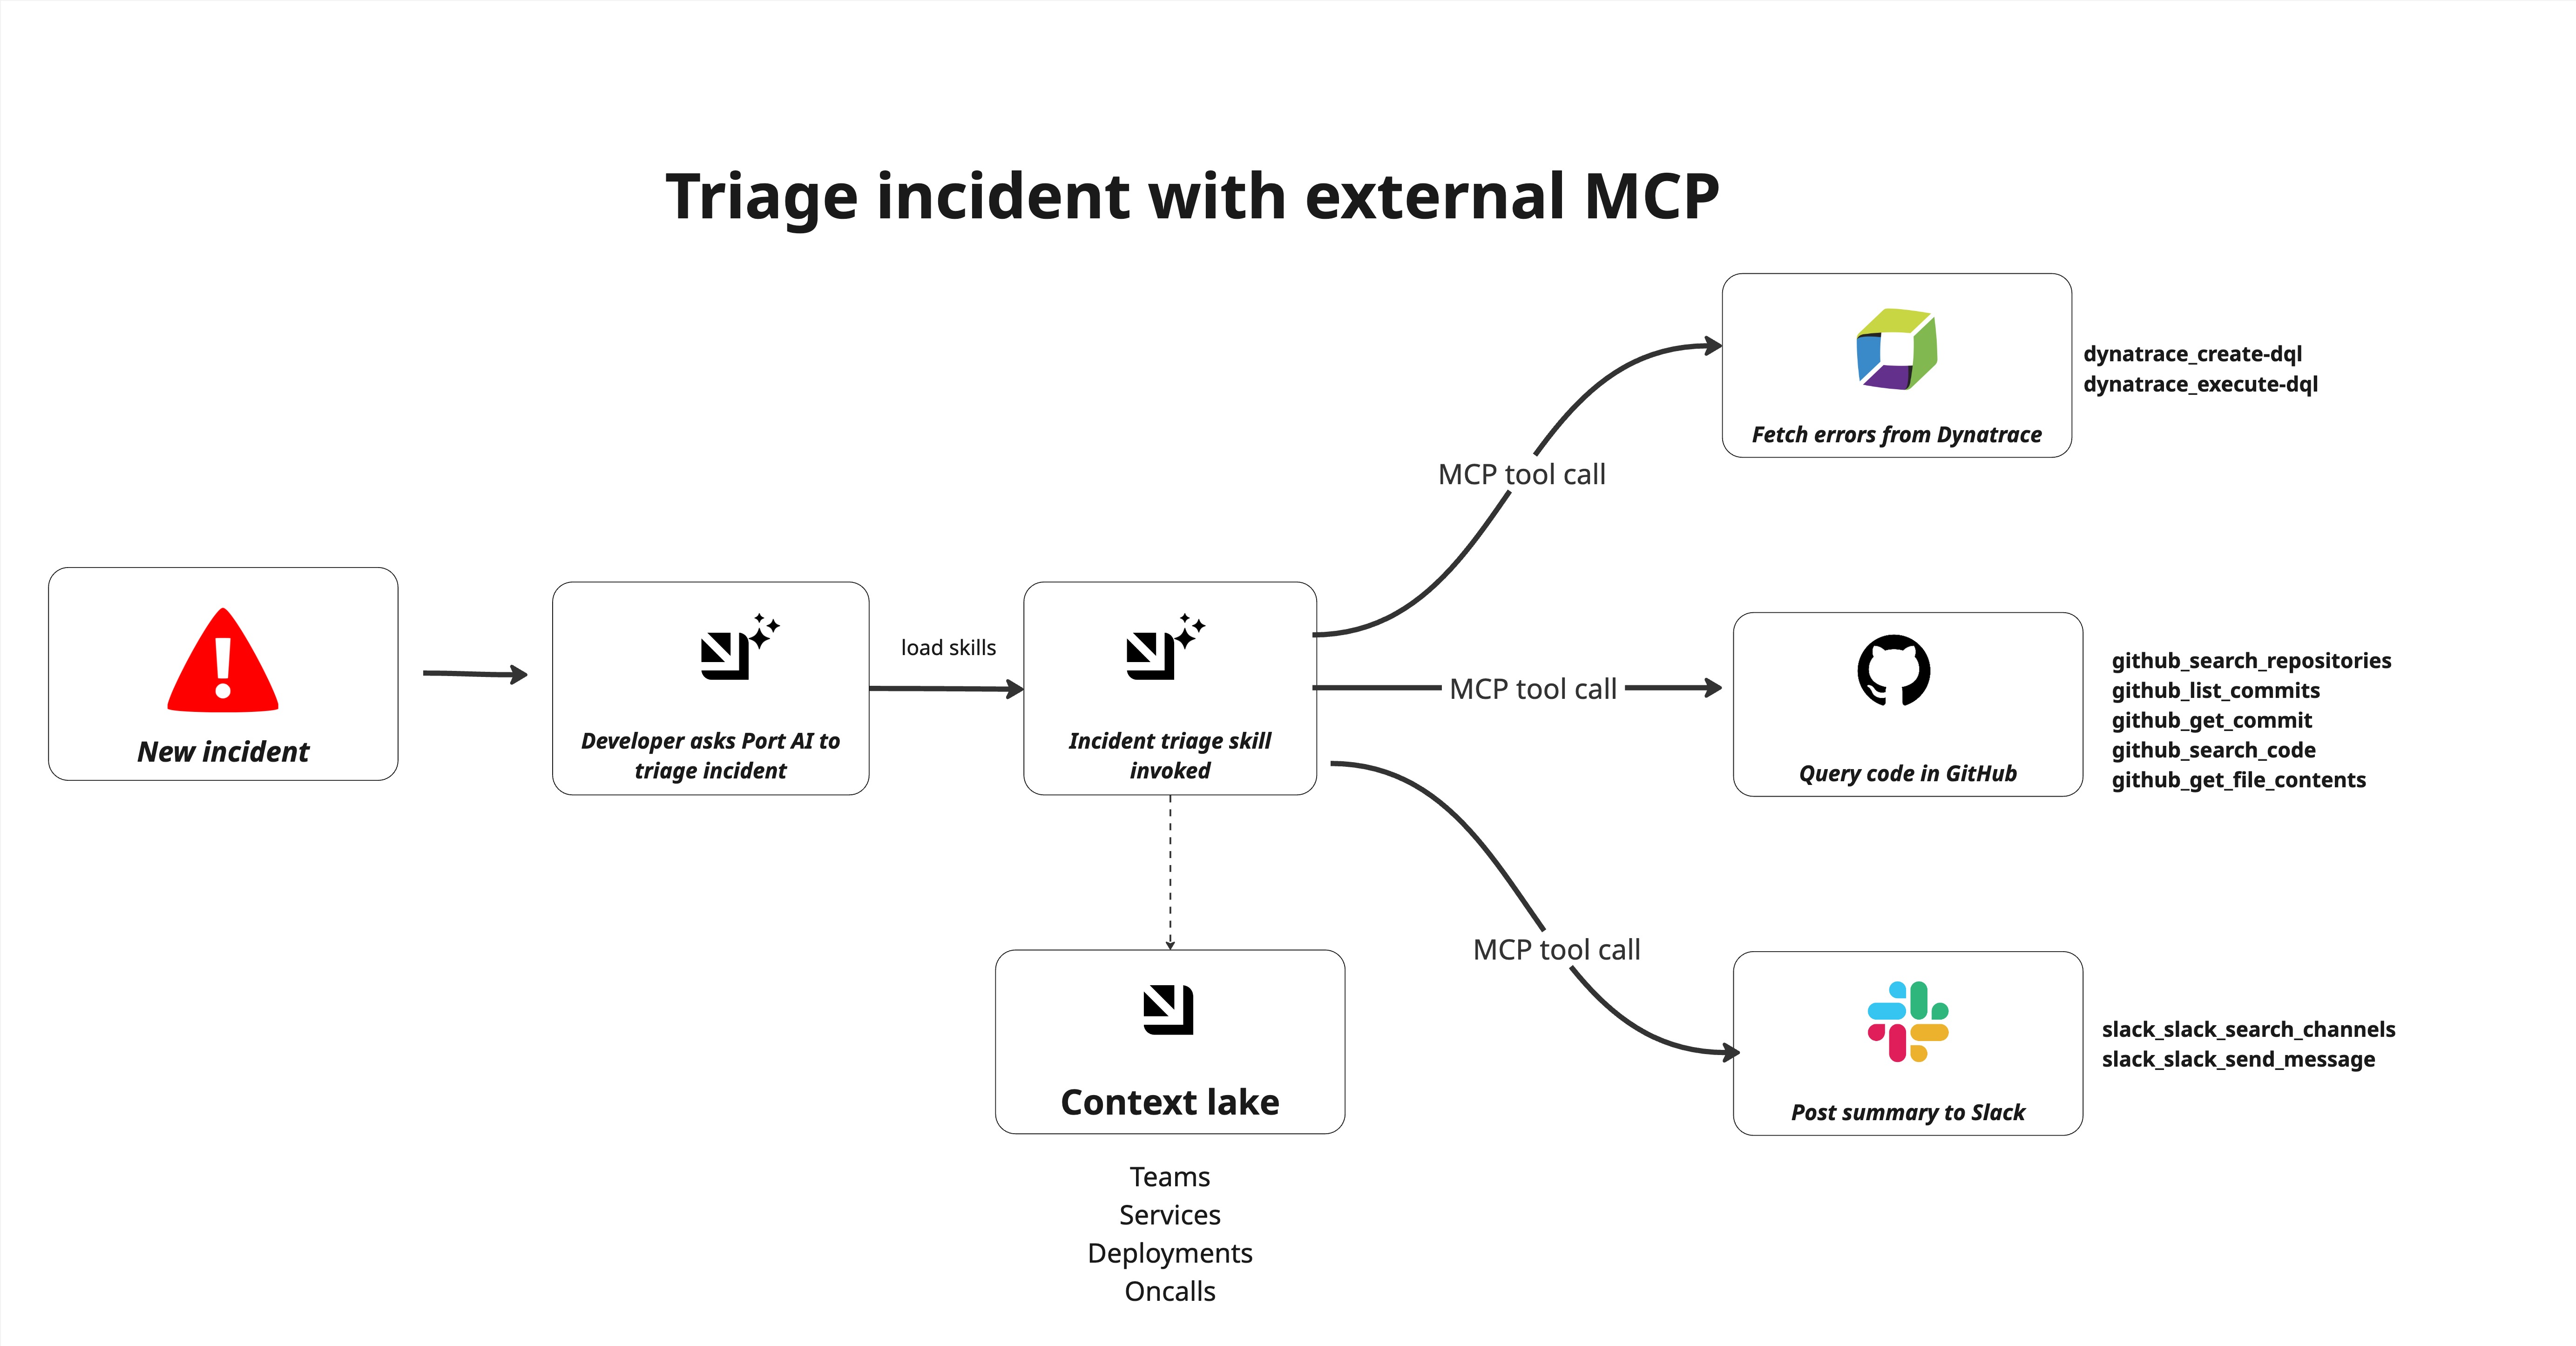
Incident triage requires you to quickly identify what broke, why it broke, and who owns the fix. This guide shows how to use Port AI with connected MCP tools to triage incidents in real time by querying Dynatrace telemetry, reading code and recent commits from GitHub, and posting a structured triage summary to Slack. The workflow runs through the Port AI chat interface and uses the ai-incident-triage skill.
Common use cases
- First-response triage: Generate a root-cause hypothesis within minutes of an incident being created.
- Deploy correlation: Compare the first-seen failure timestamp against recent commits to find likely regressions.
- Code-level diagnosis: Link telemetry signals to a specific file, function, and change in GitHub.
Prerequisites
This guide assumes the following:
- You have a Port account with the skills blueprint configured.
- You have implemented the incident blueprint pattern for incident workflows.
- You have a Dynatrace environment with logs or traces for the affected service.
- You have a GitHub repository that contains the affected service code.
- You have access to a Slack workspace.
Set up data model
You will use the incident blueprint pattern from the incident blueprint guide. This pattern already includes incident context fields and lifecycle timestamps such as triaged_at.
Connect external MCPs
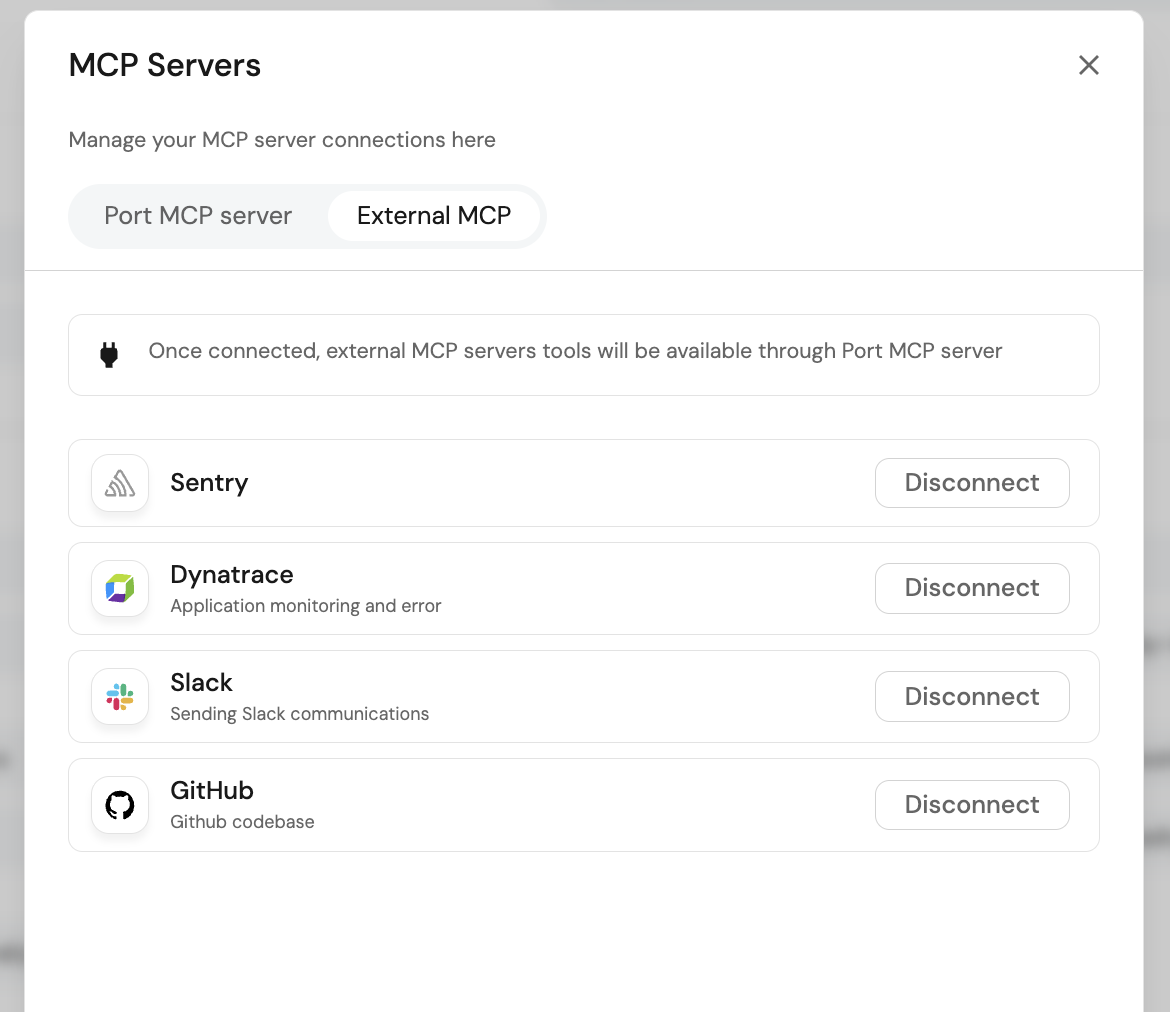
Connect MCP servers through Port's MCP connector gateway. You can learn more in MCP connectors.
Connect Dynatrace
- Go to your developer platform in Port.
- Click on your profile picture.
- Open MCP Servers.
- Move to the MCP External tab.
- Click Connect for Dynatrace.
- Complete the authentication flow for your account.
Confirm the following tools are enabled under Dynatrace's allowed tools:
dynatrace_create-dql.dynatrace_execute-dql.
Connect GitHub
- In the same MCP External tab, click Connect for GitHub.
- Complete the OAuth flow.
Confirm the following tools are enabled:
github_search_repositories.github_get_file_contents.github_list_commits.github_get_commit.
Connect Slack
- In the same MCP External tab, click Connect for Slack.
- Complete the OAuth flow.
- Enable Model Context Protocol in Slack under Agents & AI Apps.
Confirm the following tools are enabled:
slack_slack_search_channels.slack_slack_send_message.
Set up workflow
You will create a workflow that the agent will use to save triage results back to the incident entity.
Port workflows are currently in open beta and available to all users. Workflows may undergo changes without prior notice.
Update incident triage workflow
-
Go to the Workflows page of your portal.
-
Click on the
+ Workflowbutton in the top-right corner. -
Click on the
Skip to editorbutton. -
Copy and paste the following configuration to replace the example workflow:
Update incident triage workflow (click to expand)
{"identifier": "update_incident_triage","title": "Update Incident Triage","icon": "DefaultProperty","description": "Called by AI triage skill to store analysis results","allowAnyoneToViewRuns": true,"nodes": [{"identifier": "trigger","title": "Triage results","config": {"type": "SELF_SERVE_TRIGGER","userInputs": {"properties": {"incident_id": {"type": "string","title": "Incident ID"},"ai_suggested_severity": {"type": "string","title": "AI Suggested Severity","enum": ["sev1","sev2","sev3","sev4"]},"business_impact": {"type": "string","title": "Business Impact","format": "markdown"},"internal_comms_message": {"type": "string","title": "Internal Communications Message","format": "markdown"},"status_page_message": {"type": "string","title": "Status Page Message","format": "markdown"},"ai_suggested_owner": {"type": "string","title": "AI Suggested Owner","format": "user"},"ai_suggested_response_team": {"type": "string","title": "AI Suggested Response Team","format": "team"}},"required": ["incident_id","ai_suggested_severity","business_impact","internal_comms_message"],"order": ["incident_id","ai_suggested_severity","business_impact","internal_comms_message","status_page_message","ai_suggested_owner","ai_suggested_response_team"]},"published": true},"variables": {}},{"identifier": "update_incident","title": "Update incident entity","config": {"type": "UPSERT_ENTITY","blueprintIdentifier": "incident","mapping": {"identifier": "{{ .outputs.trigger.incident_id }}","properties": {"ai_suggested_severity": "{{ .outputs.trigger.ai_suggested_severity }}","business_impact": "{{ .outputs.trigger.business_impact }}","internal_comms_message": "{{ .outputs.trigger.internal_comms_message }}","status_page_message": "{{ .outputs.trigger.status_page_message }}","ai_suggested_owner": "{{ .outputs.trigger.ai_suggested_owner }}","ai_suggested_response_team": "{{ .outputs.trigger.ai_suggested_response_team }}"}}},"variables": {}}],"connections": [{"sourceIdentifier": "trigger","targetIdentifier": "update_incident"}]} -
Click Save to save the workflow.
Create the incident triage skill
Create the skill that Port AI will invoke when you ask it to triage an incident.
-
Go to the Skill catalog page in your portal.
-
Click
+ Skill. -
Toggle JSON Mode.
-
Copy and paste this configuration:
Incident triage skill (click to expand)
{"identifier": "ai-incident-triage","title": "ai-incident-triage","icon": "Alert","team": [],"properties": {"description": "Investigate an active incident end-to-end — pull errors and logs from Dynatrace, query relevant code and recent commits in GitHub, synthesize a root cause analysis, post a structured summary to Slack, and update the incident entity in Port. Use when an incident fires, when a user asks to triage or investigate an incident, or when someone says \"look into this\", \"what's causing X\", \"root cause\", \"RCA\", or \"what broke\" — even if they don't say the word incident explicitly.","instructions": "---\nname: ai-incident-triage\ndescription: Investigate an active incident end-to-end — pull errors and logs from Dynatrace, query relevant code and recent commits in GitHub, synthesize a root cause analysis, post a structured summary to Slack, and update the incident entity in Port. Use when an incident fires, when a user asks to triage or investigate an incident, or when someone says \"look into this\", \"what's causing X\", \"root cause\", \"RCA\", or \"what broke\" — even if they don't say the word incident explicitly.\n\n---\n\n# Incident Triage Assistant\n\nUse this skill to run first-response triage on an active incident. You will gather live signals from connected MCP tools, synthesize a root cause hypothesis, and deliver a structured triage to Slack and back to the incident entity in Port.\n\n## Step 1: Identify the Incident\n\nDetermine which incident to triage:\n\n- If triggered by a Port automation, the incident entity identifier and properties will be available in context\n- If invoked manually by a user, ask: \"Which incident should I triage? Please provide the incident name or Port entity identifier.\"\n\nFetch the full incident entity using `list_entities` on the `incident` blueprint (or whichever blueprint stores incidents) with filters. Extract:\n- **Title** — the incident name\n- **Affected service** — the service identifier or name\n- **Severity** — P1/P2/P3 or equivalent\n- **Created at** — timestamp\n- **Reported by** — user or system that created the entity\n- **Triage summary** — check if already populated; if so, notify the user and ask if they want to re-run triage\n\n## Step 2: Discover Available MCP Tools\n\nBefore fetching any external data, query the `_mcp_server` blueprint to understand what tools are currently connected and approved:\n\n1. Use `list_entities` on `_mcp_server` where `exposed = true`\n2. Build a mental map of available tool categories:\n - **Observability / error tracking** — look for servers with tools matching `dynatrace_dql-execute` or similar DQL execution tools (e.g. Dynatrace)\n - **Code** — look for servers with tools matching `search_code`, `get_file_contents`, `list_commits` (e.g. GitHub, GitLab)\n - **Incident management** — look for servers with tools matching incident or alert queries\n3. Proceed with whatever observability and code tools are available — do not hardcode tool names, use what the catalog tells you is connected\n4. If no observability tool is connected, note this in the triage output and proceed with Port context only\n\n## Step 3: Fetch Observability Data from Dynatrace\n\nUse the `dynatrace_dql-execute` tool to run DQL queries against Dynatrace. Follow these steps in order:\n\n### 3a. Discover the process name for the affected service\n\nRun the following DQL query to fetch all services and their associated process names:\n\n```dql\nfetch dt.entity.service\n| fieldsFlatten runs_on\n| fieldsAdd process.name = entityName(runs_on[dt.entity.process_group], type: \"dt.entity.process_group\")\n| fields entity.name, id, process.name\n| sort entity.name\n```\n\nFrom the results, identify the row where `entity.name` most closely matches the **affected service** name from Step 1. Record the corresponding `process.name` value. This is the key used to filter logs in the next step.\n\n- If multiple rows match, prefer the exact match on `entity.name`\n- If no exact match exists, use the closest partial match and note the ambiguity in the triage output\n- If the result is empty or the tool is unavailable, note this and skip to Step 4\n\n### 3b. Fetch error logs for the affected service\n\nUsing the `process.name` identified in Step 3a, run the following DQL query. Use the `dynatrace_dql-execute` tool:\n\n```dql\nfetch logs, from:now()-24h\n| filter dt.process.name == \"<REPLACE WITH SINGLE PROCESS NAME FROM 3a>\"\n| filter loglevel == \"ERROR\" or loglevel == \"WARN\"\n| fields timestamp, loglevel, content, dt.process.name, trace_id, span_id\n| sort timestamp, direction: \"descending\"\n| limit 100\n```\n\n**If no results are returned**, expand the time window to 72 hours and retry:\n\n```dql\nfetch logs, from:now()-72h\n| filter dt.process.name == \"<REPLACE SINGLE WITH PROCESS NAME FROM 3a>\"\n| filter loglevel == \"ERROR\" or loglevel == \"WARN\"\n| fields timestamp, loglevel, content, dt.process.name, trace_id, span_id\n| sort timestamp, direction: \"descending\"\n| limit 100\n```\n\n### 3c. Extract and record the following from the log results\n\n- **Process name** — the `dt.process.name` value used\n- **Time window** — 24h or 72h (whichever returned results)\n- **Error pattern** — the most frequently recurring `content` message or exception type\n- **First seen / last seen** — earliest and latest `timestamp` in the results\n- **Error frequency** — count of ERROR vs WARN records returned\n- **Top stack frame or exception** — extract from the `content` field the exception class, message, and any file/line reference\n- **Trace IDs** — note any non-null `trace_id` values for correlation with distributed tracing\n- **Any recurring pattern** — if the same error message appears many times, flag it as the primary signal\n\n### 3d. If no logs are found after 72h\n\n- Note in the triage output that no Dynatrace log signal was found for this service\n- Record the process name used so the gap can be investigated\n- Continue to Step 4 using GitHub and Port context only\n\n## Step 4: Query GitHub for Code Context\n\nUsing the code tools identified in Step 2:\n\n1. **Discover GitHub context first**\n\n * Use the available code tools to discover accessible **organizations / owners** and relevant **repositories**\n * Prefer repositories that match the affected service name, Port metadata, or any module name found in the Dynatrace log `content` field\n * Do not assume a default org or repository\n\n2. **Locate the relevant code**\n\n * From the error logs in Step 3, use the **exception class**, **file path**, or **function name** referenced in the `content` field to identify the most relevant code location\n * If the exact path is unknown, use `github_search_code` (or equivalent) to search by file name, function name, or error-related symbol\n * If the exact repo is unclear, search across the most likely candidate repositories first\n\n3. **Fetch file contents**\n\n * Use `github_get_file_contents` (or equivalent) to retrieve the relevant file\n * Extract the function or code block around the error location (about **±20 lines** around the referenced line if available)\n\n4. **Check recent changes**\n\n * Use `github_list_commits` (or equivalent) on the relevant file or repository for the last **few days**\n * Prioritize commits touching the same file or function referenced in the Dynatrace log content\n * If file-level history is unavailable, fall back to recent repo commits\n\n5. **Extract and record**\n\n * **Repository selected**\n * **File path and function**\n * **Relevant code snippet / behavior summary**\n * **Recent commits** — author, message, timestamp\n * **Any likely cause patterns** — null handling, type mismatch, config change, API contract change, dependency/version update\n\n6. **If no exact code match is found**\n\n * Fall back to the most likely repository for the affected service\n * Search by service name, module name, or recent commits only\n * If still ambiguous, note the gap and continue with Port + Dynatrace evidence rather than blocking triage\n\n## Step 5: Gather Port Context Signals\n\nQuery Port's catalog for additional context on the affected service:\n\n1. Use `list_entities` on the service entity to retrieve:\n - **Owning team** and team members\n - **Slack channel** the slack channel for communication\n - **On-call** assignment if modelled as a relation or property\n - **Recent deployments** — check deployment entities related to the service, look for any in the last 24-48 hours\n - **Open GitHub issues** related to the service if ingested\n - **Scorecard status** — is the service already below baseline on any rules?\n2. Cross-reference recent deployments with the first-seen timestamp of the Dynatrace errors if a deploy happened just before errors spiked, that is the leading hypothesis\n\n## Step 6: Synthesize the Triage\n\nCombine all signals into a structured triage. Reason through:\n\n1. **Probable root cause** — state your best hypothesis and confidence level (high / medium / low). Be specific: name the exception, the function, the commit, or the change most likely responsible. If multiple hypotheses exist, rank them.\n2. **Affected component** — which service, module, or dependency is the blast radius\n3. **Severity assessment** — based on error frequency, log volume, and service tier — confirm or adjust the reported severity\n4. **Suggested owner** — the on-call engineer or team lead based on the owning team from Port\n5. **Suggested next action** — one concrete action: rollback the deploy, fix the null check, investigate the dependency, escalate to the vendor, etc.\n\nFormat the triage as follows (you will use this both for Slack and for writing back to Port):\n\n```\n🚨 INCIDENT TRIAGE — [Incident Title]\n\nSeverity: [P1/P2/P3]\nAffected service: [service name]\nTriggered: [created at timestamp]\n\nPROBABLE ROOT CAUSE\n[1-2 sentences stating the hypothesis with evidence. E.g. \"A duplicate key ArgumentException in BrokerService began spiking at 17:52 UTC, 8 minutes after deploy v3.1.2 by @engineer. The commit introduced a dictionary insert without a duplicate guard.\"]\n\nERROR SIGNALS (from Dynatrace)\n• Process: [dt.process.name]\n• [Error type / exception]: [N] occurrences — first seen [timestamp], last seen [timestamp]\n• Top log content: [abbreviated error message, no raw stack trace]\n• Trace IDs available: [yes/no — count]\n\nCODE CONTEXT\nFile: [file path]\nFunction: [function name]\nRecent change: [commit message] by [author] at [timestamp]\n\nSUGGESTED OWNER\n[Team name] — [on-call name if available]\n\nSUGGESTED NEXT ACTION\n[Single concrete action]\n\nLinks: [Dynatrace logs URL if available] | [GitHub file URL] | [Port incident entity URL]\n```\n\n## Step 7: Post to Slack\n\nSend the triage summary to the relevant channel:\n\n1. Use the connected Slack MCP tool `slack_slack_send_message` to post the message to the identified channel (or whichever channel matches the affected service)\n2. Use the full formatted triage block from Step 6 as the message body\n3. Do not include raw stack traces or full log dumps in the Slack message, summarise the key exception only\n\n## Step 8: Update the Incident Entity in Port\n\nWrite the triage back to the incident entity for auditability:\n\n1. Use the `update_incident_triage` workflow to update the entity\n2. Set the following properties:\n - `incident_id`: The incident identifier (required)\n - `ai_suggested_severity`: sev1-sev4 (required)\n - `business_impact`: Detailed impact analysis in markdown (required)\n - `internal_comms_message`: Draft for stakeholders (required)\n - `status_page_message`: Draft for customers (optional)\n - `ai_suggested_owner`: User email of recommended incident commander (optional)\n - `ai_suggested_response_team`: Team identifier for response team (optional)\n3. Confirm the entity was updated and provide the direct Port URL to the incident entity\n\n## Step 9: Deliver the Response\n\nReport back to the user with:\n- Confirmation that the Slack message was posted (with channel name)\n- Confirmation that the incident entity was updated (with link)\n- A brief version of the triage summary inline in the chat\n- Any gaps: tools that were not available, data that could not be fetched, or signals that were ambiguous\n\n## Important Notes\n\n- **Always discover tools dynamically** from `_mcp_server` in Step 2 — never assume Dynatrace or GitHub are connected. If they are not, state what is missing and triage with available signals only.\n- **Use `dynatrace_dql-execute` for all Dynatrace queries** — do not attempt to call Dynatrace REST APIs directly.\n- **Always run Step 3a before Step 3b** — the process name lookup is required to correctly scope the log query. Do not guess the process name from the service name alone.\n- **Do not wait for perfect data.** If Dynatrace returns no results after 72h, proceed with GitHub and Port context. A partial triage posted quickly is more valuable than a complete triage posted late.\n- **Timestamp everything.** Every signal should include when it was observed — this is critical for correlating deploys with error spikes.\n- **One hypothesis, clearly stated.** Do not hedge with five possible causes. Pick the most likely one based on evidence and state your confidence level. List alternatives only if confidence is low.\n- **The Slack message is the deliverable.** Everything else — GitHub queries, entity updates — supports it. Prioritise getting a useful message to the incident channel above all else.\n- **Never include raw stack traces in the Slack message.** Summarise the relevant exception only. Full log content goes in the Port entity.\n"},"relations": {}} -
Click
Registerto add the skill.
Create sample incident entity
Create the incident entity that the skill will triage.
-
Go to the Incidents page in your portal.
-
Click
+ Incident. -
Click
JSON Mode. -
Use the following JSON:
Sample incident entity (click to expand)
{"identifier": "INC-1003","title": "broker-service - ArgumentException duplicate key on every inbound request","icon": "Alert","properties": {"severity": "sev3","status": "active","description": "BrokerService is throwing System.ArgumentException (An item with the same key has already been added. Key: 1) on every inbound HTTP request since 18:30:57 UTC. The exception is caught by ExceptionHandling.BrokerExceptionFilter but surfaces again as an unhandled exception at Microsoft.AspNetCore.Diagnostics.DeveloperExceptionPageMiddleware, indicating the filter is not suppressing propagation. Errors are firing at a consistent cadence of approximately every 8 seconds - consistent with a scheduled or polling-based request pattern rather than user-driven traffic. Each error pair shares a trace_id, confirming each request generates exactly two error log entries. 10 confirmed error pairs (20 log entries) recorded between 18:30:57 and 18:31:54 UTC. No null trace_ids on the ArgumentException entries - all requests are fully traced. The duplicate key on Key: 1 suggests a dictionary or collection is being populated with a hardcoded or non-unique key on every request, likely introduced in a recent code change.","alert_source": "dynatrace","impacted_customer_count": 0,"alerted_at": "2026-05-07T18:30:57.000Z"},"relations": {"primary_service": "broker_service","affected_services": ["broker_service"],"related_incidents": []}} -
Click Register.
The sample uses broker_service and INC-1003. Update these values to match your incident blueprint entities and service naming.
Test the triage workflow
Run the triage
-
Open the Port AI chat interface.
-
Enter the following prompt:
"Help me understand the root cause of INC-1003"
-
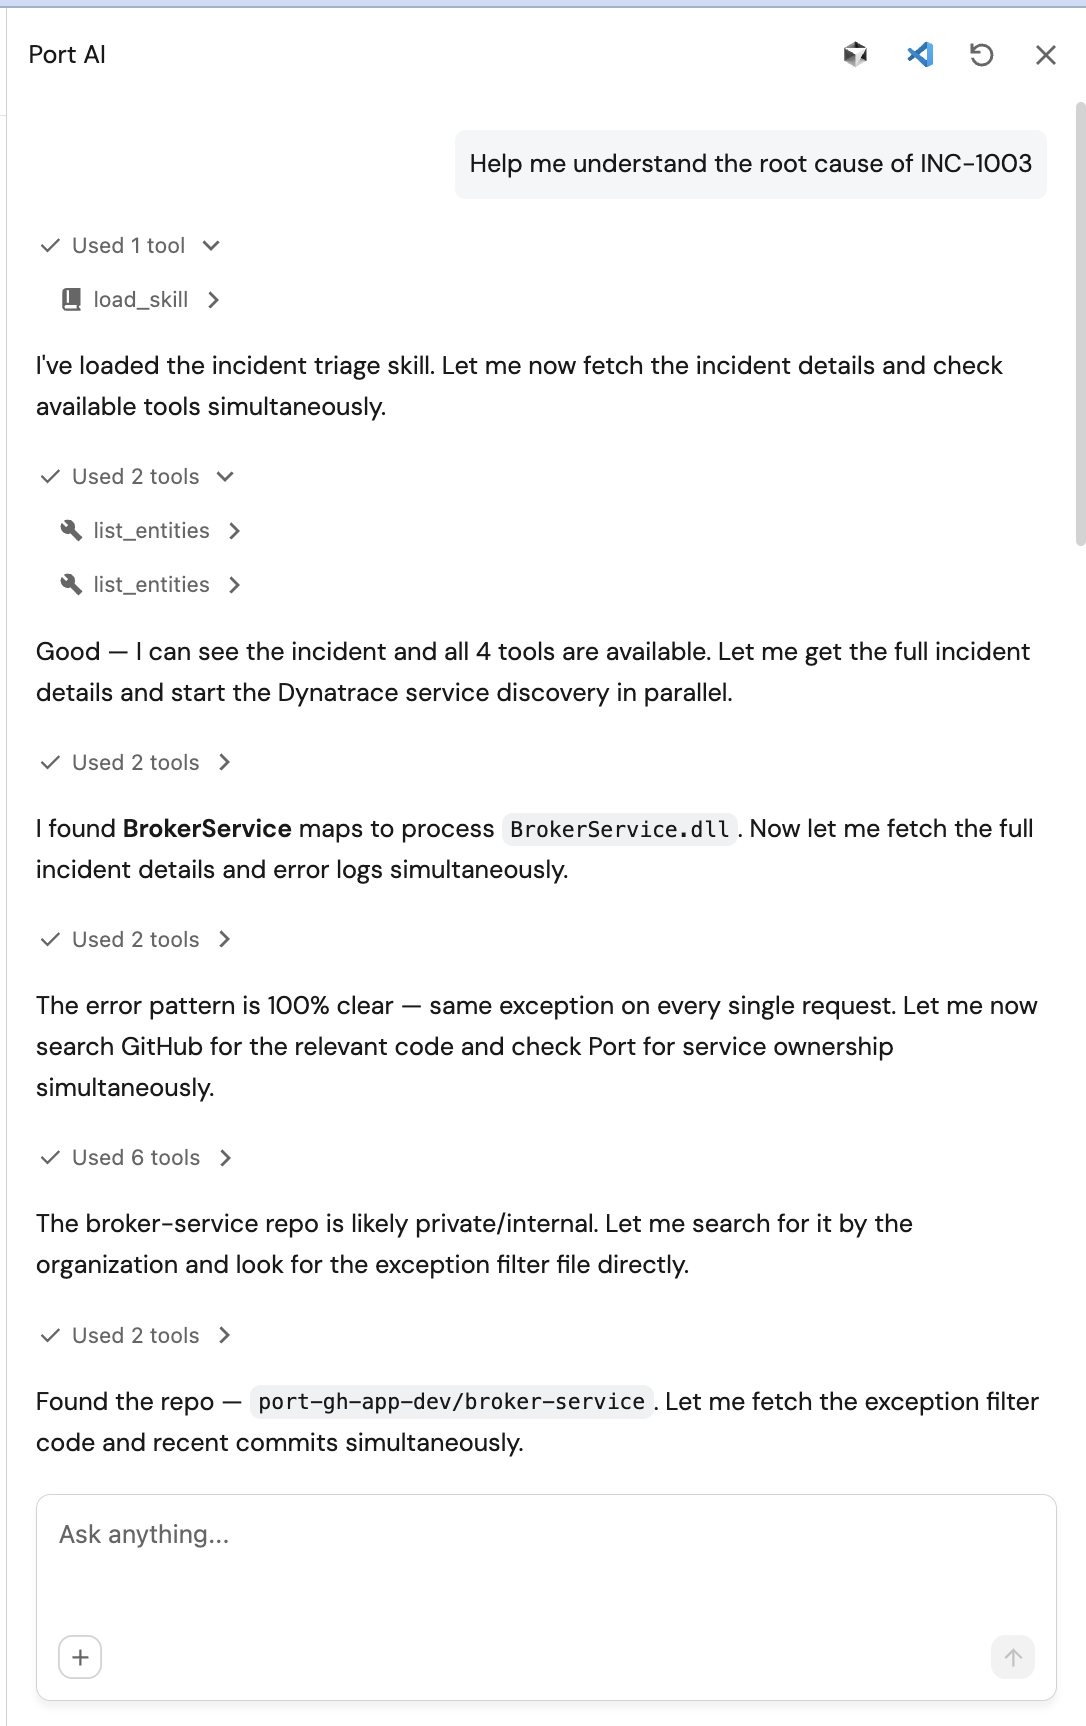
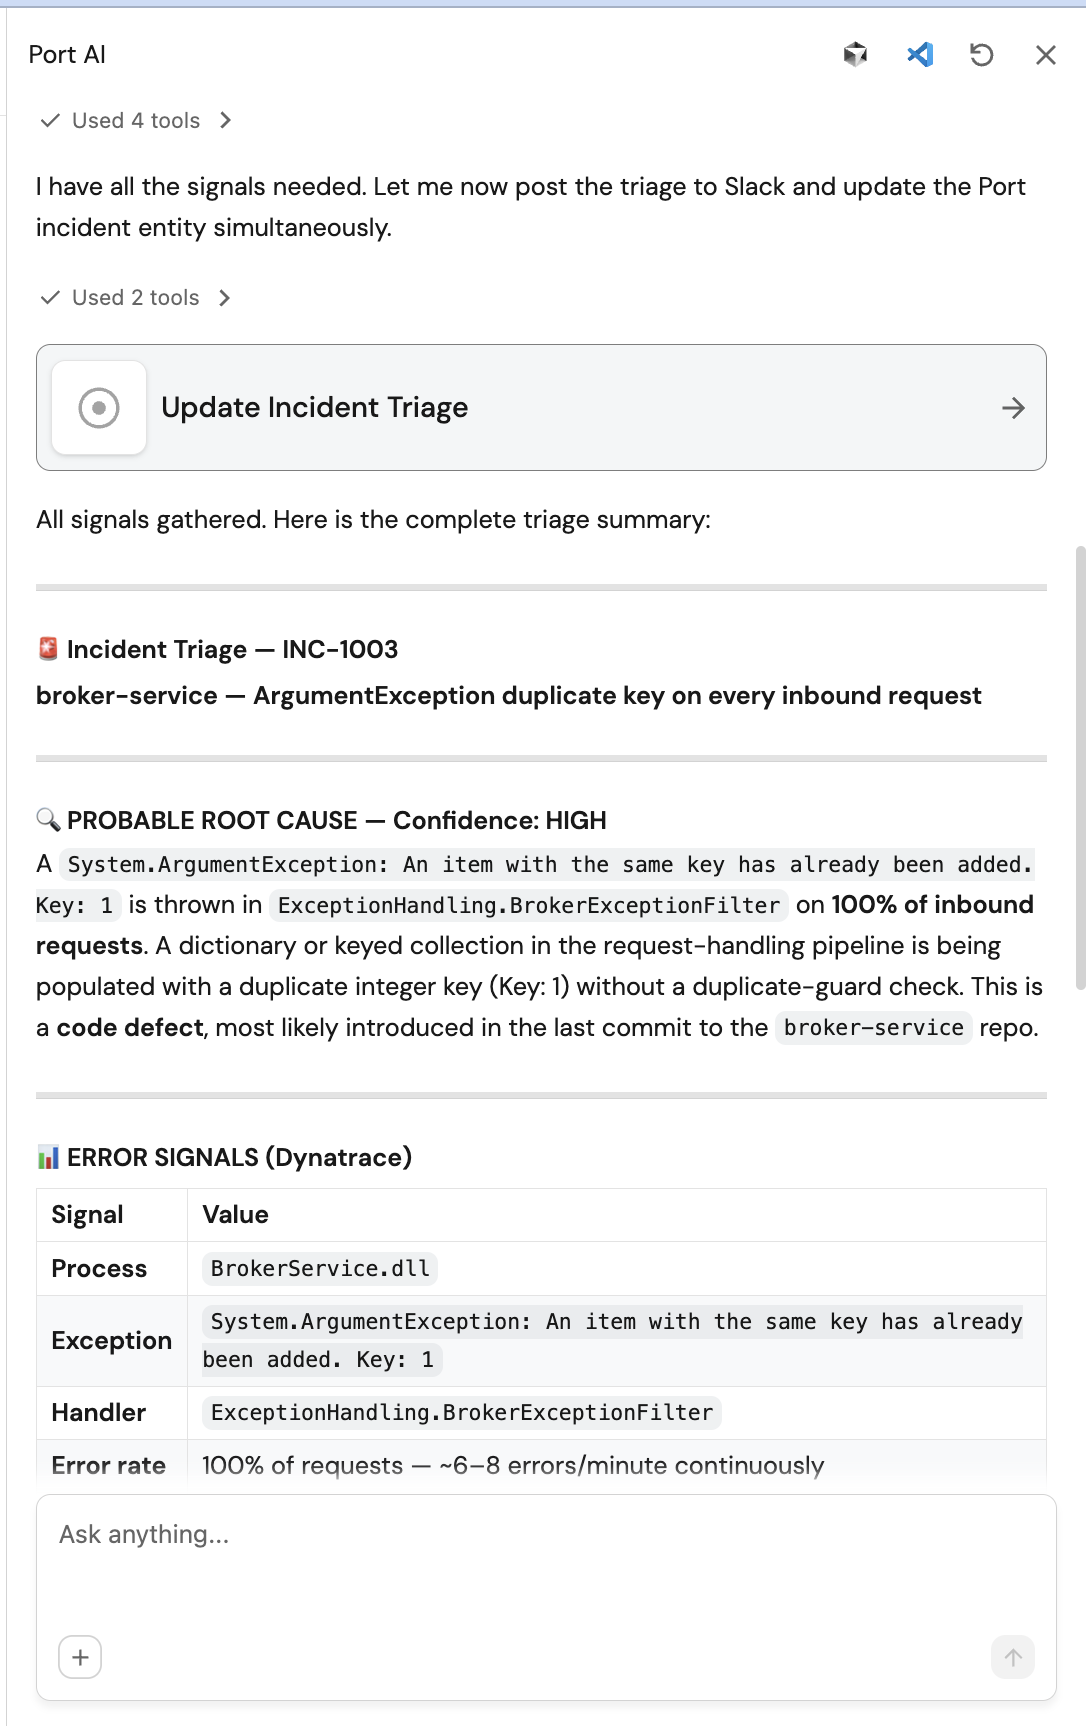
Confirm that Port AI loads the ai-incident-triage skill and executes Dynatrace, GitHub, and Slack tools in sequence.
Sample Port AI interface:
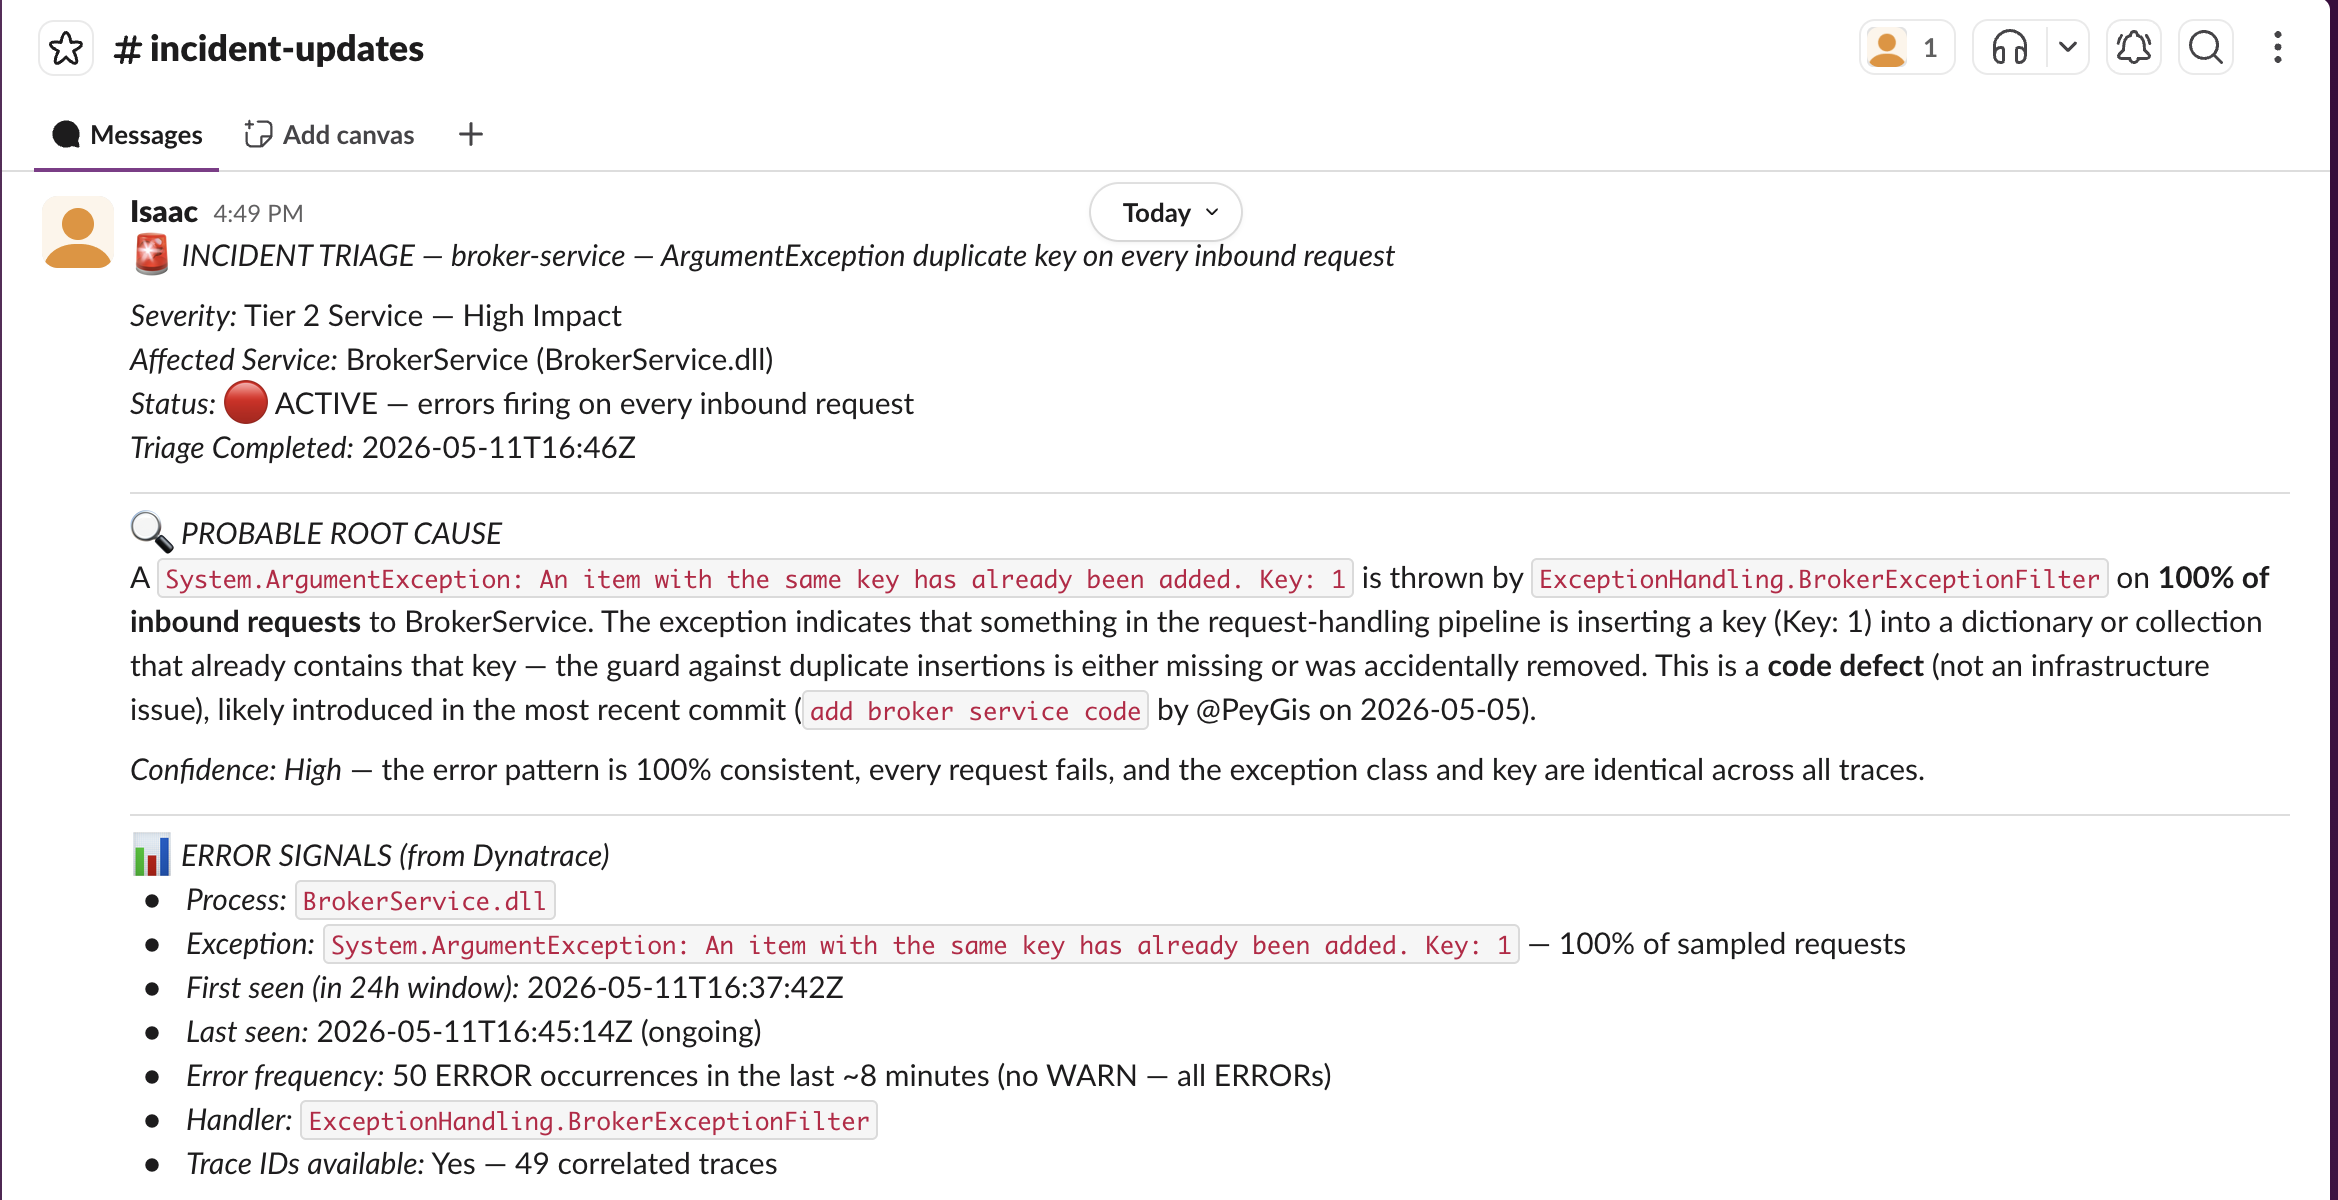
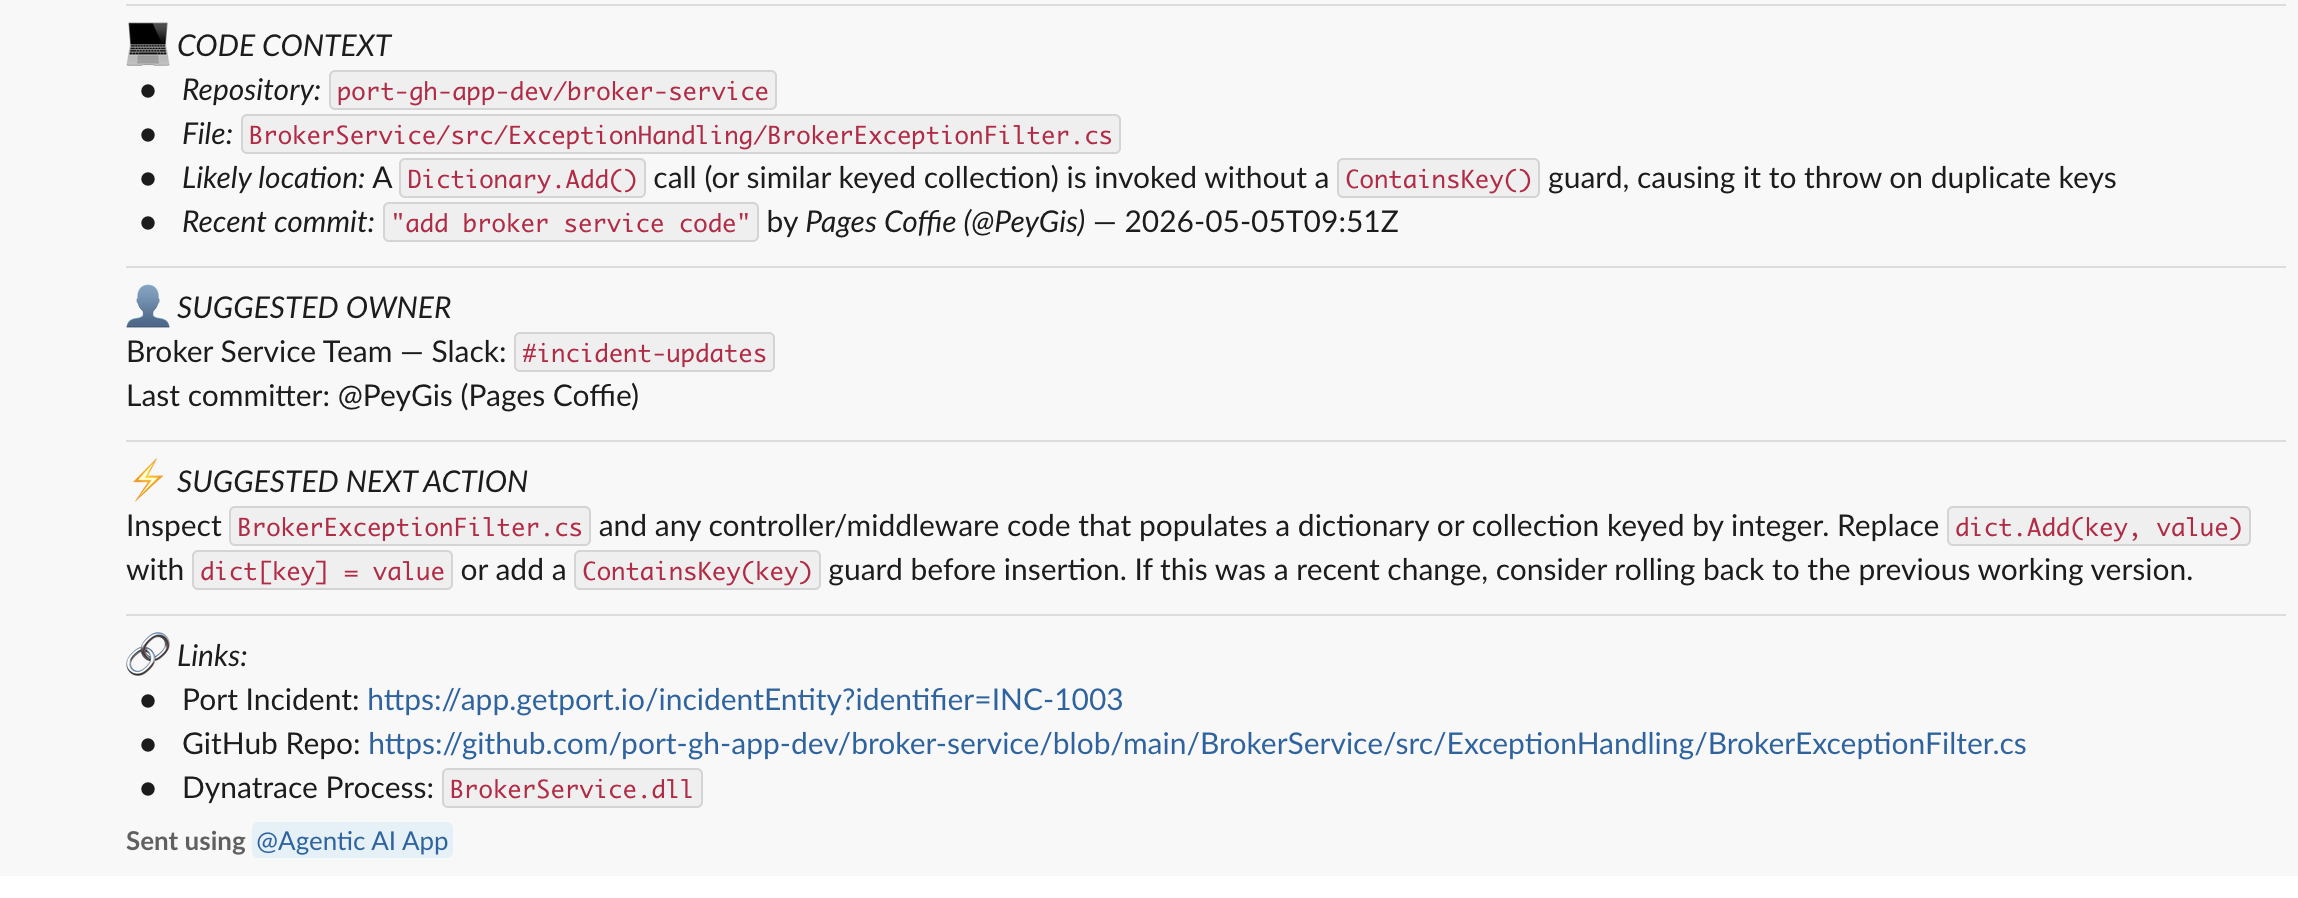
Sample Slack notification:
What to check
- The skill discovers MCP tools dynamically from
_mcp_server. - The observability analysis uses
dynatrace_create-dqlanddynatrace_execute-dql. - The summary references a concrete file, function, and recent commit.
- The Slack output includes the root-cause hypothesis and next action.