Track team work allocation with Jira
Send this guide to your coding agent.
Prerequisite: Install Port MCP
Open plan mode. Implement this Port guide in my org via MCP:

https://docs.port.io/guides/all/track-team-work-allocation-with-jira

Goal: get the guide's core flow working end-to-end in my org; adapting it to fit my existing setup takes priority over matching the guide 1:1.

Plan:
1. Confirm MCP is connected, in the right org, with sufficient permissions.
2. Diff the guide's data model (blueprints, properties, relations, actions, agents, automations, integrations, secrets) against mine.
3. Propose adaptations for gaps, reusing existing blueprints/relations over guide-named duplicates.
4. Flag what needs a UI click, credential, or secret from me, testing MCP capability empirically before ruling anything out.
5. Stop on any blocker and give me options. Approving this plan authorizes the writes it lists; pause only for writes beyond what's listed.

Build:
- Extend blueprint schema additively when upserting; don't remove or overwrite existing properties, and treat type conflicts as a blocker, not an auto-fix.
- List any mock data in the plan, minimal and labeled mock; once approved, seed it without re-asking, and tell me what you seeded.
- For anything the guide writes downstream (e.g. a webhook target), use a real entity, not a mock.
- For pages/widgets, use the real page identifier from the app URL, not a guessed slug.
- When you hit a UI step confirmed (not assumed) unsupported via MCP, pause, give exact clicks, then resume via MCP.
- Validate and give links after each meaningful step (only a tool-returned URL, no guessed paths); don't proceed if the last run wasn't a success.

Done:
- Confirm the guide's expected output exists and runs in Port.
- Summarize adaptations, seeded data, what was mocked or skipped, remaining UI steps, and how to verify.
Understanding how engineering effort is distributed across different types of work is critical for healthy teams. Without visibility into work allocation, teams can drift into reactive patterns where support and technical debt crowd out planned roadmap delivery.
This guide walks you through building a work allocation tracking system in Port that uses Jira labels to categorize issues into three work categories:
- Roadmap: planned features, product initiatives, and new capabilities.
- Tech Debt: refactoring, infrastructure improvements, and maintenance.
- Support: bug fixes, incidents, and customer-reported issues.
By the end of this guide, you will have aggregation properties on your team blueprint that automatically compute each category's share of the total work, along with dashboards that show allocation breakdowns per team.
Common use cases
- Detect when a team's support burden is crowding out roadmap delivery.
- Track whether tech debt investment targets (e.g. 20% of effort) are being met.
- Give engineering leaders a cross-team view of where effort is going.
- Identify trends over time, is support load growing or shrinking?
Prerequisites
This guide assumes the following:
- You have a Port account and have completed the onboarding process.
- Port's Jira integration is installed and syncing issues.
- Your Jira issues have a team relation set up (either via a Jira custom field or manually assigned in Port).
This guide uses Jira labels as the categorization mechanism because they are lightweight, easy to adopt, and don't require Jira admin changes. You can start using them immediately by asking teams to apply the labels described below to their issues.
Define your label convention
Before configuring Port, establish a labelling standard in Jira. Each issue should carry one label from the following groups:
| Category | Accepted labels | Examples |
|---|---|---|
| Roadmap | roadmap, feature, product | New user onboarding flow, API v2 endpoints |
| Tech Debt | tech-debt, refactor, maintenance, infrastructure | Migrate to new ORM, upgrade Node.js |
| Support | support, bug-fix, incident, hotfix | Fix login redirect, resolve production outage |
Issues that don't carry any of these labels are treated as Uncategorized and excluded from allocation percentages.
You can adjust the accepted labels to match your team's existing conventions. The important thing is that each category maps to a clearly defined set of labels and that the mapping is consistent across teams.
Set up data model
Add work category to the Jira issue blueprint
We will add a calculation property to the Jira Issue blueprint that automatically classifies each issue into a work category based on its labels.
-
Go to the Builder page of your portal.
-
Find the Jira Issue blueprint and click on it.
-
Click on the
...button in the top right corner, and choose{...} Edit JSON. -
Add the following calculation property inside the
calculationPropertiesobject:Work category calculation property (click to expand)
{"workCategory": {"title": "Work Category","icon": "Star","description": "Classifies work into Roadmap, Tech Debt, or Support based on Jira labels","calculation": "if (.properties.labels != null) then (if (.properties.labels | map(ascii_downcase) | any(. == \"roadmap\" or . == \"feature\" or . == \"product\")) then \"Roadmap\" elif (.properties.labels | map(ascii_downcase) | any(. == \"tech-debt\" or . == \"refactor\" or . == \"maintenance\" or . == \"infrastructure\")) then \"Tech Debt\" elif (.properties.labels | map(ascii_downcase) | any(. == \"support\" or . == \"bug-fix\" or . == \"incident\" or . == \"hotfix\")) then \"Support\" else \"Uncategorized\" end) else \"Uncategorized\" end","type": "string","colorized": true,"colors": {"Roadmap": "blue","Tech Debt": "orange","Support": "red","Uncategorized": "lightGray"}}} -
Click
Save.
Each issue will now display a color-coded Work Category badge based on its labels. The priority order is Roadmap > Tech Debt > Support, so if an issue carries multiple category labels, the first match wins.
Add aggregation properties to the team blueprint
Next, we add aggregation properties to the Team blueprint that count how many issues fall into each category. These roll up from all Jira issues related to a team.
-
Go to the Builder page of your portal.
-
Find the Team blueprint and click on it.
-
Click on the
...button in the top right corner, and choose{...} Edit JSON. -
Add the following aggregation properties inside the
aggregationPropertiesobject:Work allocation aggregation properties (click to expand)
{"roadmapIssues": {"title": "Roadmap Issues","icon": "Star","type": "number","target": "jiraIssue","description": "Count of issues labelled as Roadmap","query": {"combinator": "or","rules": [{ "property": "labels", "operator": "contains", "value": "roadmap" },{ "property": "labels", "operator": "contains", "value": "feature" },{ "property": "labels", "operator": "contains", "value": "product" }]},"calculationSpec": {"func": "count","calculationBy": "entities"}},"techDebtIssues": {"title": "Tech Debt Issues","icon": "DefaultProperty","type": "number","target": "jiraIssue","description": "Count of issues labelled as Tech Debt","query": {"combinator": "or","rules": [{ "property": "labels", "operator": "contains", "value": "tech-debt" },{ "property": "labels", "operator": "contains", "value": "refactor" },{ "property": "labels", "operator": "contains", "value": "maintenance" },{ "property": "labels", "operator": "contains", "value": "infrastructure" }]},"calculationSpec": {"func": "count","calculationBy": "entities"}},"supportIssues": {"title": "Support Issues","icon": "Alert","type": "number","target": "jiraIssue","description": "Count of issues labelled as Support","query": {"combinator": "or","rules": [{ "property": "labels", "operator": "contains", "value": "support" },{ "property": "labels", "operator": "contains", "value": "bug-fix" },{ "property": "labels", "operator": "contains", "value": "incident" },{ "property": "labels", "operator": "contains", "value": "hotfix" }]},"calculationSpec": {"func": "count","calculationBy": "entities"}},"totalCategorizedIssues": {"title": "Total Categorized Issues","icon": "DefaultProperty","type": "number","target": "jiraIssue","description": "Count of all Jira issues with a work category label","query": {"combinator": "or","rules": [{ "property": "labels", "operator": "contains", "value": "roadmap" },{ "property": "labels", "operator": "contains", "value": "feature" },{ "property": "labels", "operator": "contains", "value": "product" },{ "property": "labels", "operator": "contains", "value": "tech-debt" },{ "property": "labels", "operator": "contains", "value": "refactor" },{ "property": "labels", "operator": "contains", "value": "maintenance" },{ "property": "labels", "operator": "contains", "value": "infrastructure" },{ "property": "labels", "operator": "contains", "value": "support" },{ "property": "labels", "operator": "contains", "value": "bug-fix" },{ "property": "labels", "operator": "contains", "value": "incident" },{ "property": "labels", "operator": "contains", "value": "hotfix" }]},"calculationSpec": {"func": "count","calculationBy": "entities"}}}You can also add story point aggregations for a weighted allocation view:
Story point aggregation properties (click to expand)
{"roadmapStoryPoints": {"title": "Roadmap Story Points","icon": "Star","type": "number","target": "jiraIssue","description": "Total story points for Roadmap work","query": {"combinator": "or","rules": [{ "property": "labels", "operator": "contains", "value": "roadmap" },{ "property": "labels", "operator": "contains", "value": "feature" },{ "property": "labels", "operator": "contains", "value": "product" }]},"calculationSpec": {"func": "sum","calculationBy": "property","property": "storyPoints"}},"techDebtStoryPoints": {"title": "Tech Debt Story Points","icon": "DefaultProperty","type": "number","target": "jiraIssue","description": "Total story points for Tech Debt work","query": {"combinator": "or","rules": [{ "property": "labels", "operator": "contains", "value": "tech-debt" },{ "property": "labels", "operator": "contains", "value": "refactor" },{ "property": "labels", "operator": "contains", "value": "maintenance" },{ "property": "labels", "operator": "contains", "value": "infrastructure" }]},"calculationSpec": {"func": "sum","calculationBy": "property","property": "storyPoints"}},"supportStoryPoints": {"title": "Support Story Points","icon": "Alert","type": "number","target": "jiraIssue","description": "Total story points for Support work","query": {"combinator": "or","rules": [{ "property": "labels", "operator": "contains", "value": "support" },{ "property": "labels", "operator": "contains", "value": "bug-fix" },{ "property": "labels", "operator": "contains", "value": "incident" },{ "property": "labels", "operator": "contains", "value": "hotfix" }]},"calculationSpec": {"func": "sum","calculationBy": "property","property": "storyPoints"}}} -
Click
Save.
Add percentage calculation properties
Now add calculation properties to the Team blueprint that compute each category's share of the total.
-
In the same Team blueprint JSON editor, add the following inside the
calculationPropertiesobject:Allocation percentage calculations (click to expand)
{"roadmapPercent": {"title": "Roadmap Allocation (%)","icon": "Star","description": "Percentage of categorized issues that are Roadmap","calculation": "if (.properties.totalCategorizedIssues != null and .properties.totalCategorizedIssues > 0) then ((.properties.roadmapIssues / .properties.totalCategorizedIssues) * 100 | floor) else null end","type": "number"},"techDebtPercent": {"title": "Tech Debt Allocation (%)","icon": "DefaultProperty","description": "Percentage of categorized issues that are Tech Debt","calculation": "if (.properties.totalCategorizedIssues != null and .properties.totalCategorizedIssues > 0) then ((.properties.techDebtIssues / .properties.totalCategorizedIssues) * 100 | floor) else null end","type": "number"},"supportPercent": {"title": "Support Allocation (%)","icon": "Alert","description": "Percentage of categorized issues that are Support","calculation": "if (.properties.totalCategorizedIssues != null and .properties.totalCategorizedIssues > 0) then ((.properties.supportIssues / .properties.totalCategorizedIssues) * 100 | floor) else null end","type": "number"}} -
Click
Save.
Once saved, each team entity will automatically show its allocation percentages. For example, a team might display: Roadmap 60% · Tech Debt 20% · Support 20%.
If the labels property is missing from your mapping, add it by going to your Data sources page, selecting the Jira integration, and updating the mapping configuration to include the labels property like below:
kind: issue
selector:
  query: "true"
  port:
    entity:
      mappings:
      # ... existing mappings ...
      identifier: ".key",
      title: ".fields.summary",
      blueprint: "\"jiraIssue\"",
        labels: ".fields.labels"
Visualize work allocation
With the data model in place and labels flowing from Jira, we can add widgets directly on the team entity page. Widgets created on any team entity automatically appear on every other team entity, scoped to that team's data.
Add widgets to the team entity page
- Navigate to your software catalog and open any Team entity.
- Click
+ Widgeton the entity page to start adding the following widgets.
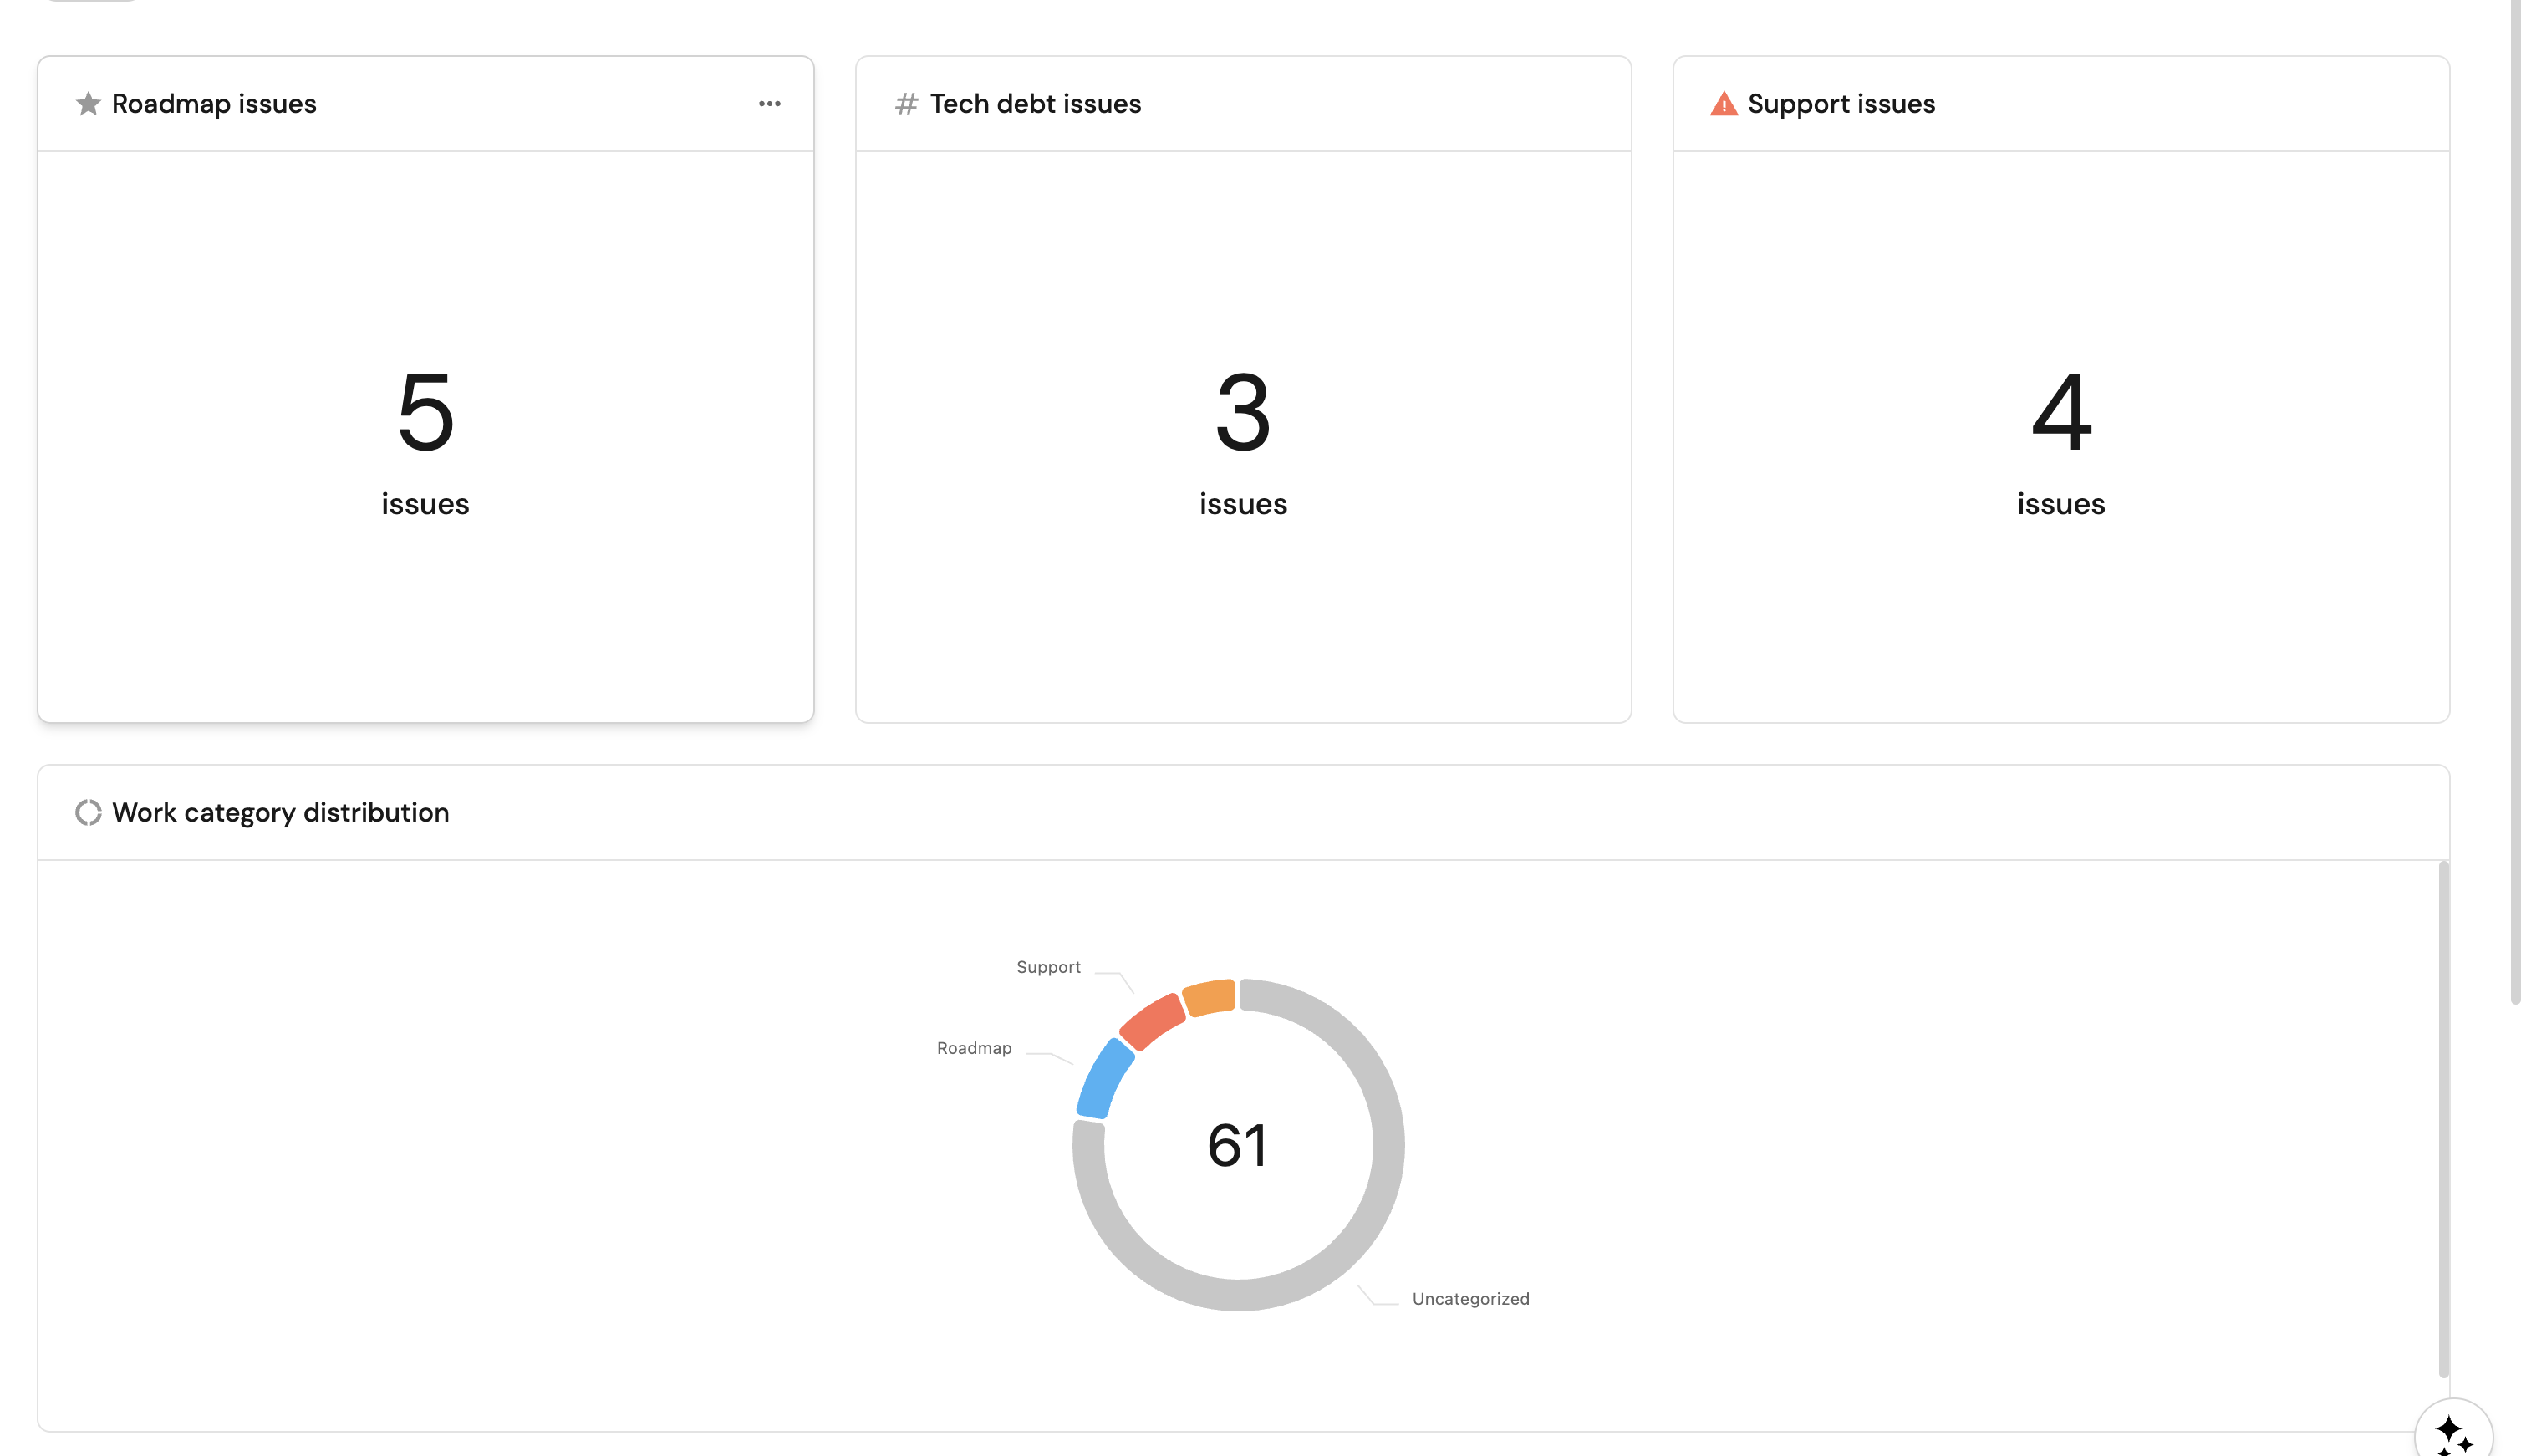
Roadmap issues (click to expand)
- Click
+ Widgetand select Number Chart. - Title:
Roadmap issues(add theStaricon). - Select
Count entitiesas the Chart type and choose Jira Issue as the Blueprint. - Select
countfor the Function. - Add this JSON to the Additional filters editor:
{"combinator": "or","rules": [{ "property": "labels", "operator": "contains", "value": "roadmap" },{ "property": "labels", "operator": "contains", "value": "feature" },{ "property": "labels", "operator": "contains", "value": "product" }]}
- Select
customas the Unit and inputissuesas the Custom unit. - Click
Save.
Tech debt issues (click to expand)
- Click
+ Widgetand select Number Chart. - Title:
Tech debt issues(add theDefaultPropertyicon). - Select
Count entitiesas the Chart type and choose Jira Issue as the Blueprint. - Select
countfor the Function. - Add this JSON to the Additional filters editor:
{"combinator": "or","rules": [{ "property": "labels", "operator": "contains", "value": "tech-debt" },{ "property": "labels", "operator": "contains", "value": "refactor" },{ "property": "labels", "operator": "contains", "value": "maintenance" },{ "property": "labels", "operator": "contains", "value": "infrastructure" }]}
- Select
customas the Unit and inputissuesas the Custom unit. - Click
Save.
Support issues (click to expand)
- Click
+ Widgetand select Number Chart. - Title:
Support issues(add theAlerticon). - Select
Count entitiesas the Chart type and choose Jira Issue as the Blueprint. - Select
countfor the Function. - Add this JSON to the Additional filters editor:
{"combinator": "or","rules": [{ "property": "labels", "operator": "contains", "value": "support" },{ "property": "labels", "operator": "contains", "value": "bug-fix" },{ "property": "labels", "operator": "contains", "value": "incident" },{ "property": "labels", "operator": "contains", "value": "hotfix" }]}
- Select
customas the Unit and inputissuesas the Custom unit. - Click
Save.
Work category distribution (click to expand)
- Click
+ Widgetand select Pie chart. - Title:
Work category distribution(add theJiraicon). - Choose the Jira Issue blueprint.
- Under
Breakdown by property, select the Work Category property. - Add this JSON to the Additional filters editor:
{"combinator": "and","rules": [{"property": "labels","operator": "isNotEmpty"}]}
- Click Save.
The allocation percentages (Roadmap Allocation (%), Tech Debt Allocation (%), Support Allocation (%)) are already visible as properties on each team entity, so they don't need separate widgets. For cross-team comparison, open the Teams page in your catalog and add these columns to the table view.
Summary
You now have a complete work allocation tracking system that:
- Categorizes Jira issues into Roadmap, Tech Debt, and Support using a lightweight label convention.
- Aggregates issue counts and story points per category at the team level.
- Computes allocation percentages automatically using calculation properties.
- Visualizes each team's allocation with a pie chart, trend line, and drill-down table directly on the team entity page.
This gives engineering leaders the data they need to have informed conversations about where effort is going and whether the balance is right for each team.