Track SLOs and SLIs for your services
Send this guide to your coding agent.
Prerequisite: Install Port MCP
Open plan mode if your tool supports it; otherwise present the plan below filled in and wait for my approval. Implement this Port guide in my org via MCP:

https://docs.port.io/guides/all/track-slos-and-slis-for-services

Read the raw markdown version at https://docs.port.io/guides/all/track-slos-and-slis-for-services.md - it contains every tab and code block without page markup.

Goal: get the guide's core flow working end-to-end in my org; adapting it to fit my existing setup takes priority over matching the guide 1:1.

Plan:
1. Confirm MCP is connected, in the right org, with sufficient permissions.
2. If the guide offers alternative implementation paths (tabs), pick the one matching my installed integrations and tools, confirm it with me, and implement only that path.
3. Diff the guide's data model (blueprints, properties, relations, workflows, actions, agents, automations, integrations, webhook data sources, secrets) against mine.
4. Propose adaptations for gaps, reusing existing blueprints/relations over guide-named duplicates.
5. Flag what needs a UI click, credential, or secret from me, testing MCP capability empirically before ruling anything out. If the guide has a "Set up via API" section, use it for anything MCP can't do before treating a step as UI-only.
6. Stop on any blocker and give me options. Approving this plan authorizes the writes it lists; pause only for writes beyond what's listed.

Build:
- Extend blueprint schema additively when upserting; don't remove or overwrite existing properties, and treat type conflicts as a blocker, not an auto-fix.
- Never print secret values into the chat or logs; ask me to set them in Port, or write them via the secrets API without echoing them back.
- List any mock data in the plan, minimal and labeled mock; once approved, seed it without re-asking, and tell me what you seeded.
- For anything the guide writes downstream (e.g. a webhook target), use a real entity, not a mock.
- For pages/widgets, use the real page identifier from the app URL, not a guessed slug.
- When you hit a UI step confirmed (not assumed) unsupported via MCP and not covered by the guide's API sections, pause, give exact clicks, then resume via MCP.
- Validate and give links after each meaningful step (only a tool-returned URL, no guessed paths); don't proceed if the last run wasn't a success.

Done:
- Run the guide's "Let's test it" steps where possible (e.g. execute a workflow test run) and confirm the expected output exists in Port.
- Summarize adaptations, seeded data, what was mocked or skipped, remaining UI steps, and how to verify.
This guide helps you set up a monitoring solution to track Service Level Indicators (SLIs) and compare them against Service Level Objectives (SLOs) using Port's integration with New Relic.
Common use cases
- Model and visualize service SLIs and compare them against SLOs.
- Create dashboards and reports to monitor SLOs over time.
Prerequisites
This guide assumes the following:
- You have a Port account and have completed the onboarding process.
- You have installed and set up Port's New Relic integration.
Set up data model
In this setup, we will create or update the New Relic Service Level blueprint.
Skip to update blueprint if you already have the blueprint.
Create the blueprint
Follow the steps below to create the New Relic Service Level blueprint:
-
Go to the Builder in your Port.
-
Click on "+ Blueprint".
-
Click on the
{...}button in the top right corner, and choose "Edit JSON". -
Add this JSON schema:
New Relic Service Level blueprint (Click to expand)
{"identifier": "newRelicServiceLevel","description": "This blueprint represents a New Relic Service Level","title": "New Relic Service Level","icon": "NewRelic","schema": {"properties": {"description": {"title": "Description","type": "string"},"targetThreshold": {"icon": "DefaultProperty","title": "Target Threshold","type": "number"},"createdAt": {"title": "Created At","type": "string","format": "date-time"},"updatedAt": {"title": "Updated At","type": "string","format": "date-time"},"createdBy": {"title": "Creator","type": "string","format": "user"},"sli": {"type": "number","title": "SLI"},"tags": {"type": "object","title": "Tags"}},"required": []},"mirrorProperties": {"running_service_identifier": {"title": "runningServiceIdentifier","path": "newRelicService.$identifier"},"domain": {"title": "Domain","path": "newRelicService.domain"}},"calculationProperties": {"sloStatus": {"title": "SLO Status","calculation": "if .properties.sli >= .properties.targetThreshold then \"Passed\" else \"Failed\" end","type": "string","colorized": true,"colors": {"Passed": "green","Failed": "red"}}},"aggregationProperties": {},"relations": {"newRelicService": {"title": "New Relic service","target": "newRelicService","required": false,"many": false}}} -
Click "Save" to create the blueprint.
Update the blueprint
Follow the steps below to update the New Relic Service Level blueprint:
-
Navigate to the
New Relic Service Levelblueprint in your Port Builder. -
Hover over it, click on the
...button on the right, and select "Edit JSON". -
Add the calculation property:
Calculation property (Click to expand)
"sloStatus": {"title": "SLO Status","calculation": "if .properties.sli >= .properties.targetThreshold then \"Passed\" else \"Failed\" end","type": "string","colorized": true,"colors": {"Passed": "green","Failed": "red"}} -
Add these mirror properties:
Mirror properties (Click to expand)
"running_service_identifier": {"title": "runningServiceIdentifier","path": "newRelicService.$identifier"},"domain": {"title": "Domain","path": "newRelicService.domain"}
Visualize metrics
In this section, you'll learn how to create dashboards that visualize key service metrics using SLIs and SLOs for production and engineering teams.
Create a dashboard
- Navigate to your context lake.
- Click on the
+button in the left sidebar. - Select New dashboard.
- Name the dashboard Production Deployment Overview and click
Create. - Repeat the same process to create an Engineering Overview dashboard.
You now have a blank dashboard where you can start adding widgets to visualize your SLIs and SLOs.
Add widgets
Production Deployment Overview - SLI vs SLO Table
-
Click
+ Widgetand select Table. -
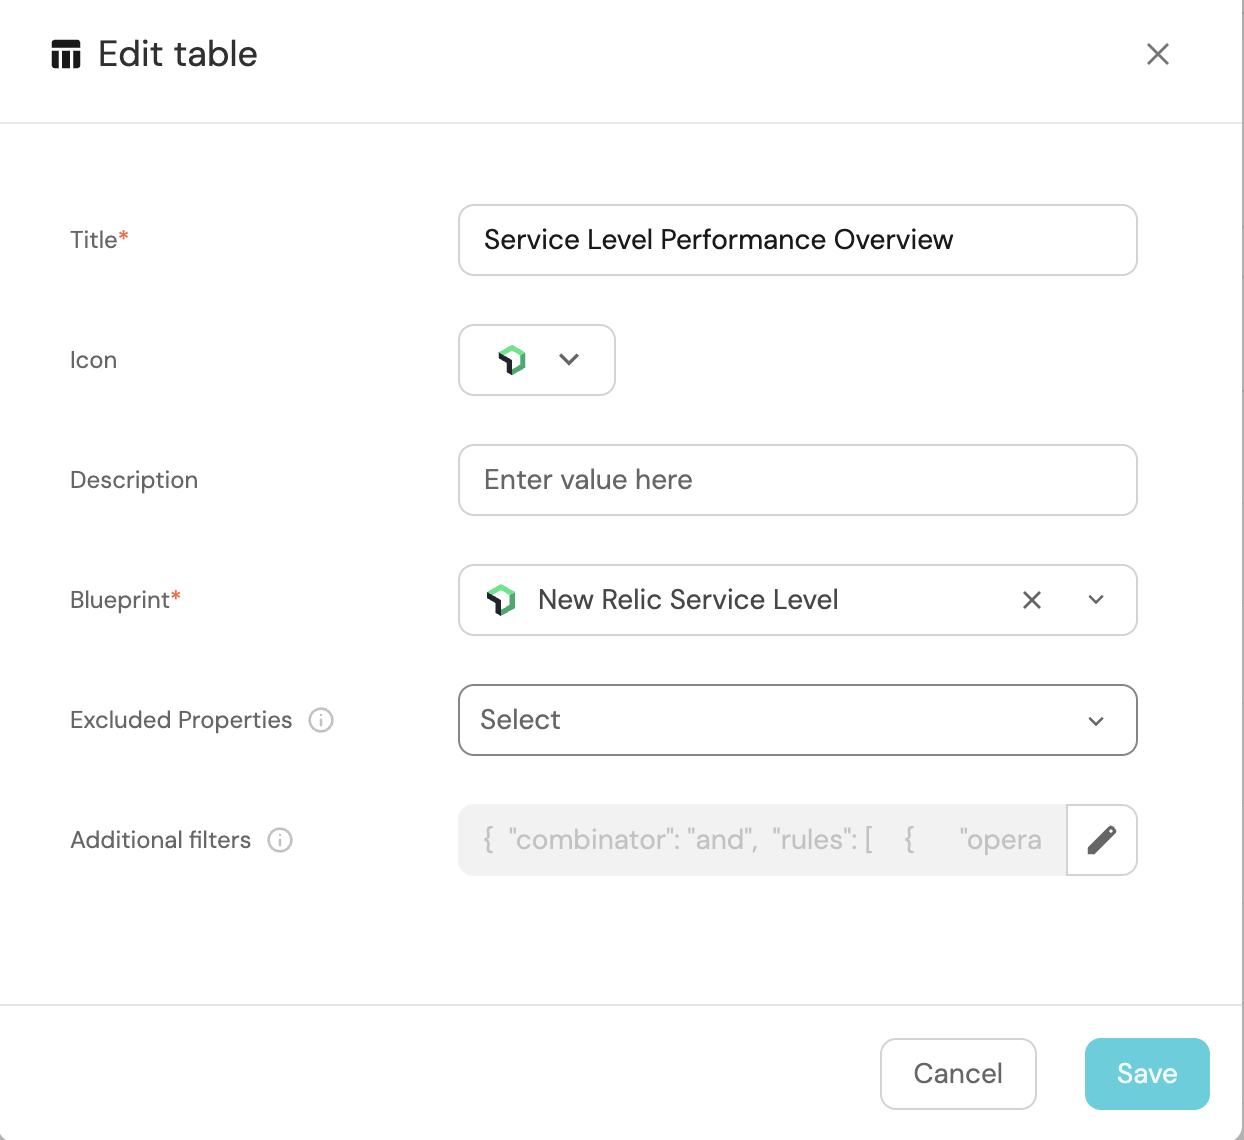
Title the widget Service Level Performance Overview.
-
Choose the New Relic Service Level blueprint.
-
Click Save.
-
Click on the
...button in the top right corner of the table and select Customize table. -
In the top right corner of the table, click on
Manage Propertiesbutton and add the following properties:- Running service identifier
- Target threshold
- SLI
- SLO Status
-
Click on the save icon on the far right top conner of the widget to save the state of the table.
This table gives you a high-level overview of how your services are performing against their SLOs.
Engineering Overview - Failed SLOs Table
-
Click
+ Widgetand select Table. -
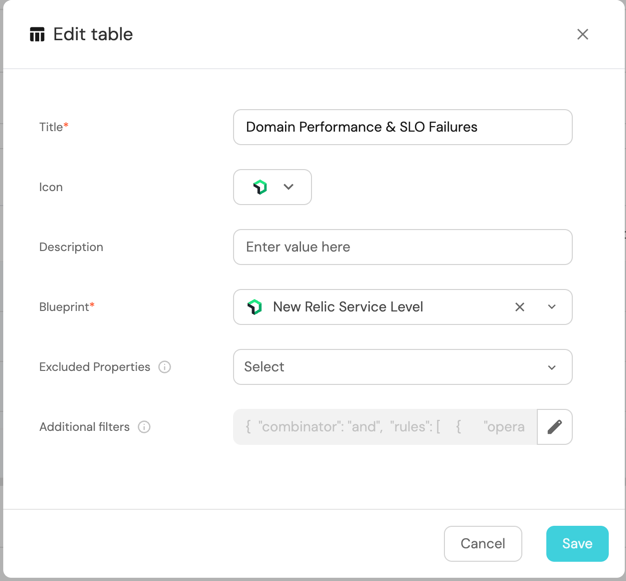
Title the widget Domain Performance & SLO Failures.
-
Choose the New Relic Service Level blueprint.
-
Click Save.
-
Click on the
...button in the top right corner of the table and select Customize table. -
Group the table by Domain.
-
Apply a filter to display only the Failed SLOs.
Visualize SLI trends
Tracking weekly performance trends for key services is crucial to identifying patterns and making data-driven decisions.
Weekly Latency Trend for API Gateway
- Click
+ Widgetand select Line Chart. - Title:
API Gateway Weekly Latency Trend. - Set X axis:
- Time interval:
Week.
- Time interval:
- Click + Line and configure:
- Title:
SLI. - Chart type:
Aggregate by property. - Blueprint:
New Relic Service Level. - Property:
SLI. - Function:
Average.
- Title:
- Click + Line and configure:
- Title:
Target threshold. - Chart type:
Aggregate by property. - Blueprint:
New Relic Service Level. - Property:
Target Threshold. - Function:
Average.
- Title:
- Click
Save.
Weekly Write Failure Trend for Main Database
- Click
+ Widgetand select Line Chart. - Title:
Main Database Weekly Write Failure Trend. - Set X axis:
- Time interval:
Week.
- Time interval:
- Click + Line and configure:
- Title:
SLI. - Chart type:
Aggregate by property. - Blueprint:
New Relic Service Level. - Property:
SLI. - Function:
Average.
- Title:
- Click + Line and configure:
- Title:
Target threshold. - Chart type:
Aggregate by property. - Blueprint:
New Relic Service Level. - Property:
Target Threshold. - Function:
Average.
- Title:
- Click
Save.
Weekly Transaction Volume for Payment Processing
- Click
+ Widgetand select Line Chart. - Title:
Payment Processing Weekly Transaction Volume Trend. - Set X axis:
- Time interval:
Week.
- Time interval:
- Click + Line and configure:
- Title:
SLI. - Chart type:
Aggregate by property. - Blueprint:
New Relic Service Level. - Property:
SLI. - Function:
Average.
- Title:
- Click + Line and configure:
- Title:
Target threshold. - Chart type:
Aggregate by property. - Blueprint:
New Relic Service Level. - Property:
Target Threshold. - Function:
Average.
- Title:
- Click
Save.
Team-Level and Organization-Level dashboards
You can also create dashboards specific to teams or organization-wide, depending on the scope of monitoring.
- First, add the following properties to the New Relic Service blueprint:
Calculation and aggregation properties
"calculationProperties": {
    "has_slo": {
      "title": "Has SLO",
      "icon": "DefaultProperty",
      "description": "Boolean for if SLO exists",
      "calculation": ".properties.number_of_slos != null",
      "type": "boolean"
    }
  },
  "aggregationProperties": {
    "number_of_slos": {
      "title": "Number of SLOs",
      "icon": "DefaultProperty",
      "type": "number",
      "target": "newRelicServiceLevel",
      "calculationSpec": {
        "func": "count",
        "calculationBy": "entities"
      }
    }
- Add the dashboards
Create My Team’s SLOs Dashboard (Team Lead View)
- Click
+in the sidebar to create a new dashboard. - Name the dashboard My Team’s SLOs.
- Click
Create.
Create Organization SLOs Dashboard (SRE View)
- Click
+in the sidebar to create a new dashboard. - Name the dashboard Organization SLOs.
- Click
Create.
SLO tables and charts
All SLOs Table
- Click
+ Widgetand select Table. - Title the widget All SLOs.
- Select the New Relic Service Level blueprint.
- Click
Saveto add the widget to the dashboard.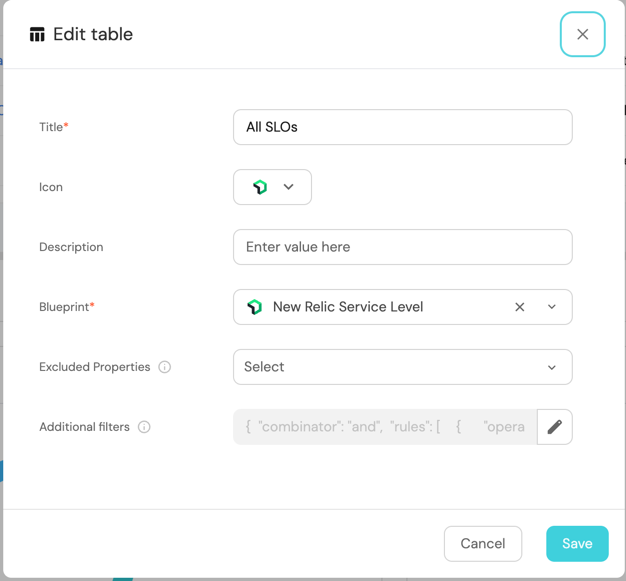
5.Click Save.
SLO Status Pie Chart
-
Click
+ Widgetand select Pie Chart. -
Title the chart SLO Status.
-
Choose the New Relic Service Level blueprint.
-
Select the SLO Status property as
Breakdown by Propertyvalue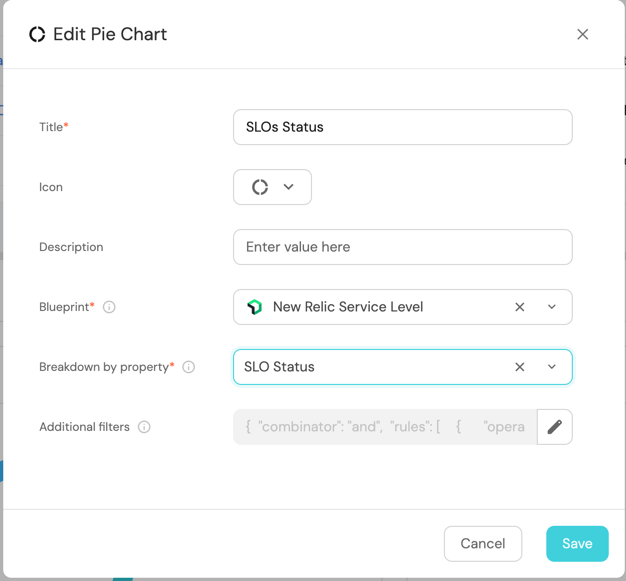
-
Click
Save.
Services with a Defined SLO Pie Chart
-
Click
+ Widgetand select Pie Chart. -
Title the chart Services with a Defined SLO.
-
Choose the New Relic Service blueprint.
-
Select the Has SLO property as
Breakdown by Propertyfor ser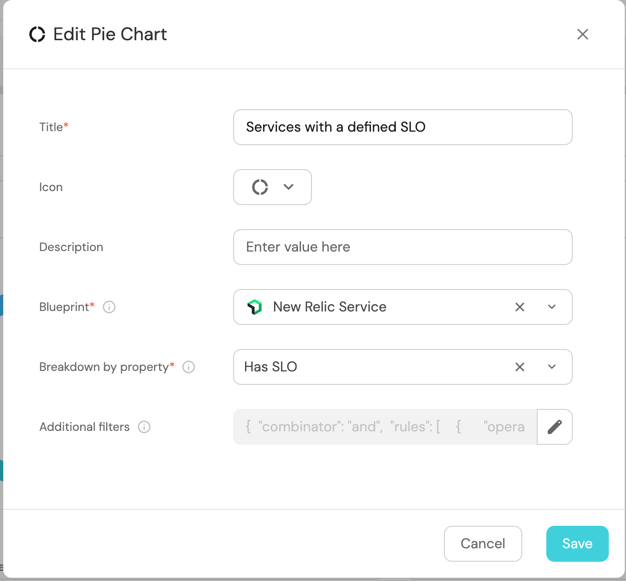
-
Click
Save.
Latency SLI Chart
-
Click
+ Widgetand select Line Chart. -
Title:
Latency SLI. -
Set X axis:
- Time interval:
Day. - Time range:
In the past 90 days.
- Time interval:
-
Click + Line and configure:
- Title:
SLI. - Chart type:
Aggregate by property. - Blueprint:
New Relic Service Level. - Entity: choose an entity.
- Property:
SLI. - Function:
Average.
- Title:
-
Click + Line and configure:
- Title:
Target threshold. - Chart type:
Aggregate by property. - Blueprint:
New Relic Service Level. - Entity: choose an entity.
- Property:
Target Threshold. - Function:
Average.
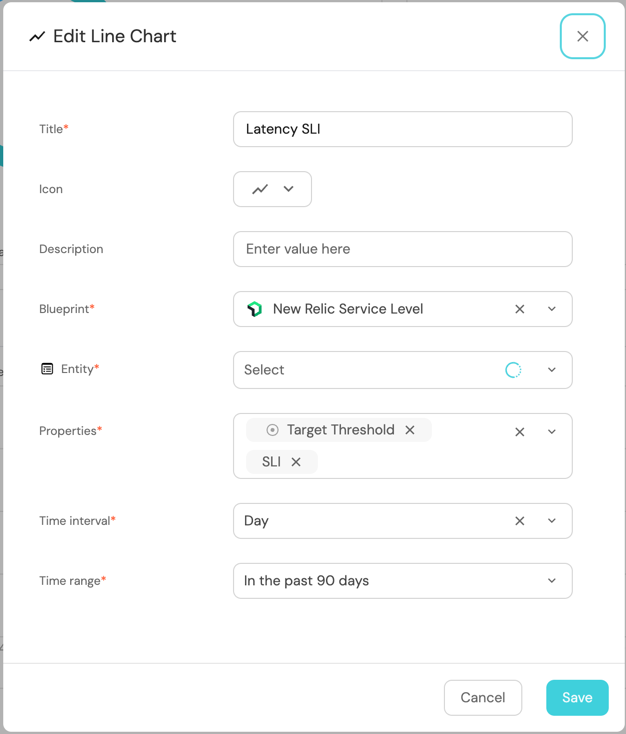
- Title:
-
Click
Save.
Success SLI Chart
-
Click
+ Widgetand select Line Chart. -
Title:
Success SLI. -
Set X axis:
- Time interval:
Day. - Time range:
In the past 90 days.
- Time interval:
-
Click + Line and configure:
- Title:
SLI. - Chart type:
Aggregate by property. - Blueprint:
New Relic Service Level. - Entity: choose an entity.
- Property:
SLI. - Function:
Average.
- Title:
-
Click + Line and configure:
- Title:
Target threshold. - Chart type:
Aggregate by property. - Blueprint:
New Relic Service Level. - Entity: choose an entity.
- Property:
Target Threshold. - Function:
Average.
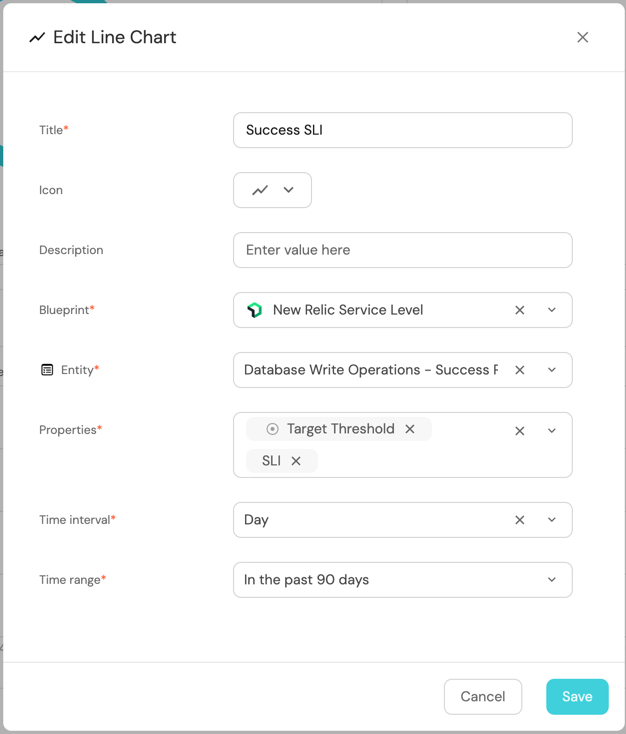
- Title:
-
Click
Save.
You can use the above steps for both team and an organization level dashboard.
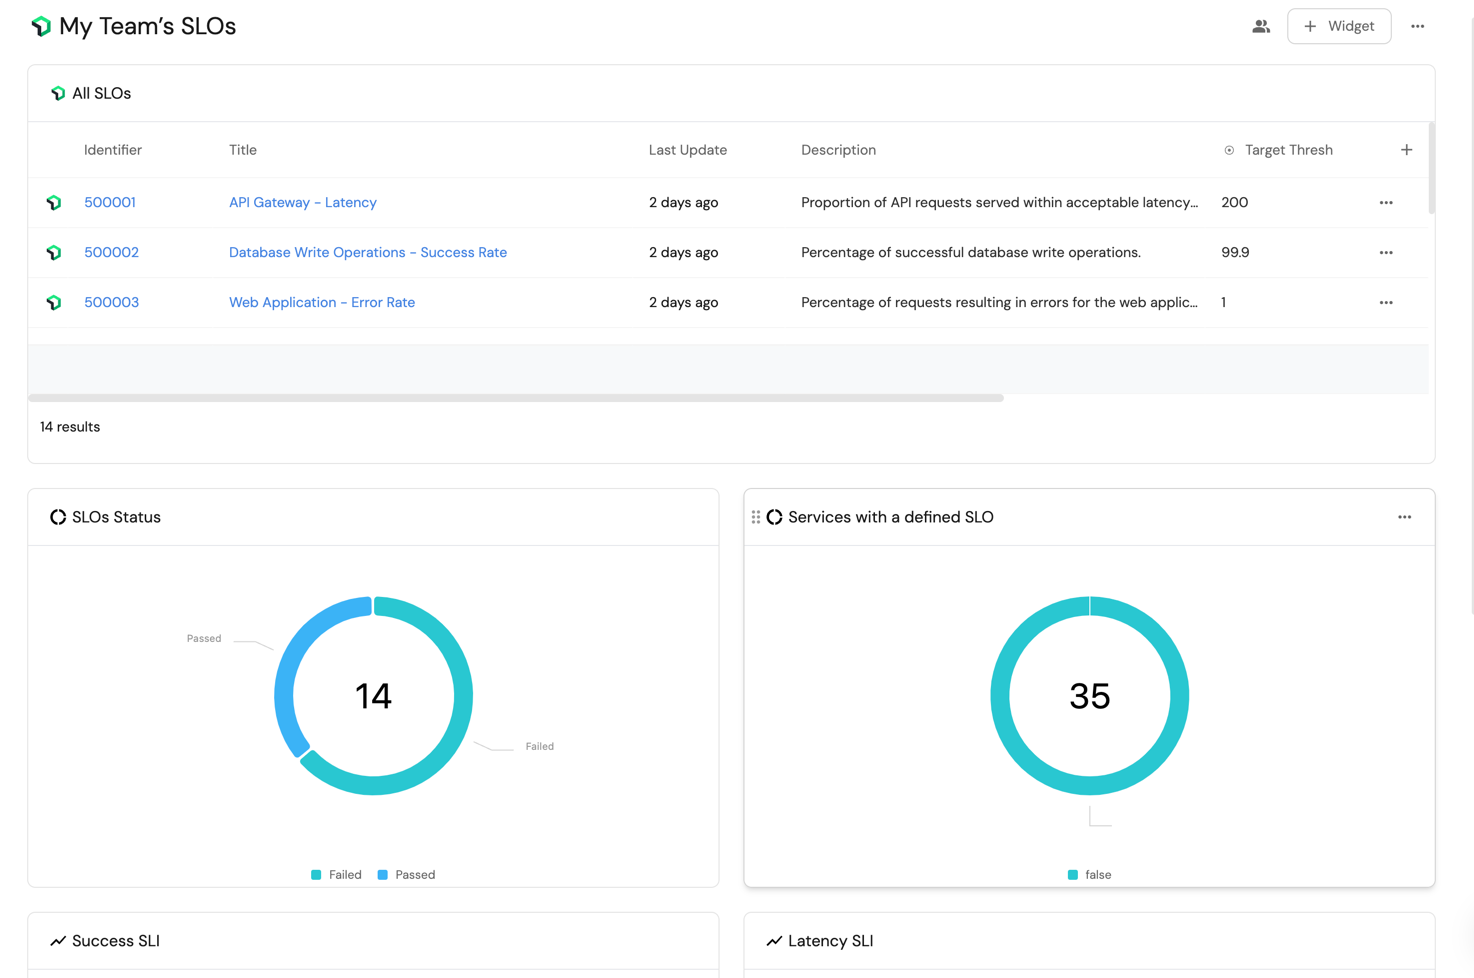
By following this guide, you have successfully set up dashboards to track your services' SLIs and SLOs. These visualizations provide real-time insights into service performance and compliance, allowing your teams to quickly identify and address underperforming services.