Track AI coding assistants costs
As organizations adopt multiple AI coding assistants, understanding the cost impact of each coding assistant becomes critical. Without centralized visibility, teams overspend or fail to detect runaway costs across Cursor, Claude, and GitHub Copilot.
This guide shows you how to build a unified cost analysis dashboard in Port that aggregates spending data from your existing AI coding assistant integrations, giving you a single pane of glass for AI cost monitoring.
Prerequisites
This guide assumes the following:
- You have a Port account and have completed the onboarding process.
- You have installed at least one of the following integrations and have data flowing into Port:
- Cursor integration: provides
total_centscost data at organization, user, and team levels. - Claude integration: provides Claude Platform cost records (
claude_platform_cost_record) and token usage data by workspace and model. - GitHub Copilot integration: provides usage metrics (suggestions, acceptances, active users) that correlate with seat-based licensing costs.
- Cursor integration: provides
If you haven't installed any of these integrations yet, follow the linked documentation above to set them up. Each integration page includes installation instructions, blueprint definitions, and mapping configurations. Once data is flowing, return to this guide to build your cost dashboard.
Available cost data
Each integration brings different cost-related data into Port. Here is a summary of what is available:
- Cursor
- Claude
- GitHub Copilot
The Cursor integration ingests daily usage records that include a total_cents property representing actual spend. Cost data is available at three levels:
| Blueprint | Description | Cost property |
|---|---|---|
cursor_usage_record | Organization-level daily metrics. | total_cents - total cost in cents for the day. |
cursor_user_usage_record | Per-user daily metrics. | total_cents - cost attributed to a specific user. |
cursor_team_usage_record | Per-team daily metrics. | total_cents - cost attributed to a specific team. |
Additional properties useful for cost analysis include usage_based_reqs, api_key_reqs, subscription_included_reqs, and token counts (total_input_tokens, total_output_tokens).
For full blueprint definitions and setup instructions, see the Cursor integration documentation.
The Claude integration provides dedicated cost records alongside token usage data:
| Blueprint | Description | Cost property |
|---|---|---|
claude_platform_cost_record | Daily cost tracking from the Anthropic cost report API. | amount - cost amount in the specified currency. |
claude_platform_usage_record | Daily token consumption metrics. | Token counts (input, output, cache) for estimating costs. |
claude_platform_workspace_usage | Usage broken down by workspace. | Token counts per workspace for cost attribution. |
claude_platform_model_usage | Usage broken down by model. | Token counts per model (e.g., Opus vs. Haiku) for understanding cost drivers. |
The claude_platform_cost_record blueprint provides the most direct cost data, while token-level breakdowns help you understand what drives costs.
For full blueprint definitions and setup instructions, see the Claude integration documentation.
GitHub Copilot uses seat-based licensing, so the integration provides usage metrics rather than direct cost data. You can use these metrics to calculate cost-per-value:
| Blueprint | Description | Usage properties |
|---|---|---|
github_copilot_usage | Daily usage metrics at team or organization level. | total_active_users, total_suggestions_count, total_acceptances_count, total_lines_accepted. |
To estimate costs, multiply total_active_users by your per-seat cost (e.g., $19/month for Business, $39/month for Enterprise). The acceptance_rate calculation property helps you evaluate whether the cost per seat is justified.
For full blueprint definitions and setup instructions, see the GitHub Copilot integration documentation.
Visualize costs
With your integration data flowing into Port, create a dashboard to visualize AI tool costs and usage across all tools.
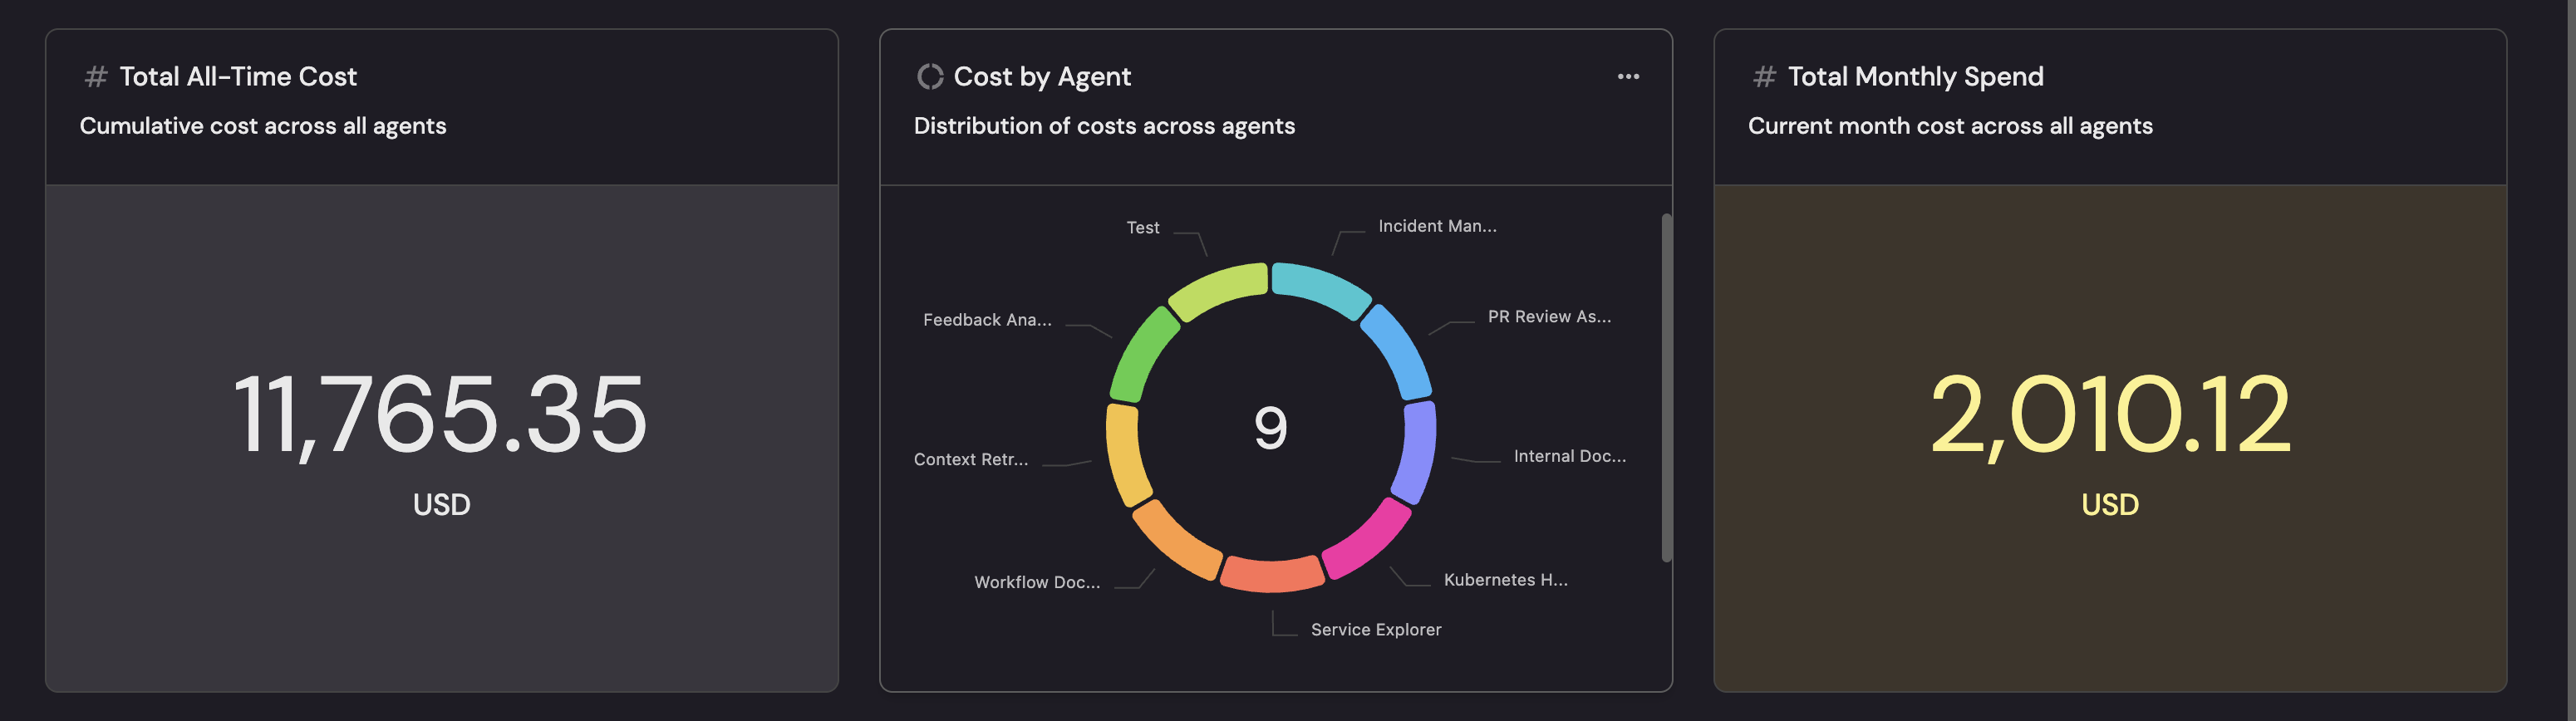
Create a dashboard
- Navigate to your context lake.
- Click on the
+button in the left sidebar. - Select New dashboard.
- Name the dashboard AI Tool Costs.
- Input
Track and compare AI coding tool costs across your organizationunder Description. - Select the
DollarSignicon. - Click
Create.
Add widgets
In the new dashboard, create widgets based on the integrations you have installed. Select the relevant tab below:
- Cursor
- Claude
- GitHub Copilot
Total daily spend number chart (click to expand)
- Click
+ Widgetand select Number Chart. - Title:
Cursor Daily Spend. - Description:
Total Cursor cost in cents for the current period. - Select
Aggregate by propertyChart type and choose Cursor Usage Record as the Blueprint. - Select
total_centsas the Property. - Select
sumfor the Function. - Select
customas the Unit and inputcentsas the Custom unit. - Click
Save.
Cost per team bar chart (click to expand)
- Click
+ Widgetand select Bar Chart. - Title:
Cursor Cost by Team. - Description:
Cost distribution across teams. - Choose the Cursor Team Usage Record blueprint.
- Under
Breakdown by property, select the Team property. - Click
Save.
Cost details table (click to expand)
- Click
+ Widgetand select Table. - Title:
Cursor Cost Details. - Choose the Cursor Usage Record blueprint.
- Click
Saveto add the widget to the dashboard. - Click on the
...button in the top right corner of the table and select Customize table. - In the top right corner of the table, click on
Manage Propertiesand add the following columns:- Record Date (UTC): The date of the usage record.
- Organization: The Cursor organization.
- Total Cost (cents): The cost for that day.
- Usage-based Requests: Requests billed on usage.
- Total Active Users: Number of active users.
- Most Used Model: The model consuming the most resources.
- Click on the save icon in the top right corner of the widget to save the customized table.
High-cost users table (click to expand)
-
Click
+ Widgetand select Table. -
Title:
Cursor High-Cost Users. -
Choose the Cursor User Usage Record blueprint.
-
Add a filter with the following configuration:
{"combinator": "and","rules": [{"value": 1000,"property": "total_cents","operator": ">="}]} -
Click
Save.
Total daily spend number chart (click to expand)
- Click
+ Widgetand select Number Chart. - Title:
Claude Daily Spend. - Description:
Total Claude API cost for the current period. - Select
Aggregate by propertyChart type and choose Claude AI Cost Record as the Blueprint. - Select
amountas the Property. - Select
sumfor the Function. - Select
customas the Unit and inputUSDas the Custom unit. - Click
Save.
Cost by model pie chart (click to expand)
- Click
+ Widgetand select Pie Chart. - Title:
Claude Usage by Model. - Description:
Token distribution across Claude models. - Choose the Claude AI Model Usage blueprint.
- Under
Breakdown by property, select the Model property. - Click
Save.
Cost details table (click to expand)
- Click
+ Widgetand select Table. - Title:
Claude Cost Details. - Choose the Claude AI Cost Record blueprint.
- Click
Saveto add the widget to the dashboard. - Click on the
...button in the top right corner of the table and select Customize table. - In the top right corner of the table, click on
Manage Propertiesand add the following columns:- Record Date (UTC): The date of the cost record.
- Cost Amount: The cost for that day.
- Currency: The currency of the amount.
- Click on the save icon in the top right corner of the widget to save the customized table.
Workspace usage table (click to expand)
- Click
+ Widgetand select Table. - Title:
Claude Workspace Usage. - Choose the Claude AI Workspace Usage blueprint.
- Click
Saveto add the widget to the dashboard. - Click on the
...button in the top right corner of the table and select Customize table. - In the top right corner of the table, click on
Manage Propertiesand add the following columns:- Record Date (UTC): The date of the record.
- Workspace ID: The workspace identifier.
- Uncached Input Tokens: Tokens not served from cache.
- Output Tokens: Tokens generated by the model.
- Total Tokens: Combined input and output tokens.
- Click on the save icon in the top right corner of the widget to save the customized table.
Active users number chart (click to expand)
- Click
+ Widgetand select Number Chart. - Title:
Copilot Active Users. - Description:
Total active Copilot users (cost is per-seat). - Select
Aggregate by propertyChart type and choose GitHub Copilot Usage as the Blueprint. - Select
total_active_usersas the Property. - Select
averagefor the Function. - Click
Save.
Acceptance rate number chart (click to expand)
- Click
+ Widgetand select Number Chart. - Title:
Copilot Acceptance Rate. - Description:
Average suggestion acceptance rate (cost efficiency indicator). - Select
Aggregate by propertyChart type and choose GitHub Copilot Usage as the Blueprint. - Select
acceptance_rateas the Property. - Select
averagefor the Function. - Select
customas the Unit and input%as the Custom unit. - Click
Save.
Usage details table (click to expand)
- Click
+ Widgetand select Table. - Title:
Copilot Usage Details. - Choose the GitHub Copilot Usage blueprint.
- Click
Saveto add the widget to the dashboard. - Click on the
...button in the top right corner of the table and select Customize table. - In the top right corner of the table, click on
Manage Propertiesand add the following columns:- Record Date: The date of the usage record.
- GitHub Org: The GitHub organization.
- GitHub Team: The team (if using team-level metrics).
- Total Active Users: Number of users with active seats.
- Total Suggestions Count: Code suggestions shown.
- Total Acceptances Count: Suggestions accepted.
- Acceptance Rate: Percentage of suggestions accepted.
- Click on the save icon in the top right corner of the widget to save the customized table.
Suggestions vs. acceptances bar chart (click to expand)
- Click
+ Widgetand select Bar Chart. - Title:
Copilot Suggestions vs Acceptances. - Description:
Compare suggestion volume against acceptance to evaluate cost efficiency. - Choose the GitHub Copilot Usage blueprint.
- Under
Breakdown by property, select the GitHub Team property. - Click
Save.