Set up DORA scorecards
If you signed up for Port on or after May 1, 2026, DORA scorecards are already set up in your portal. Follow this guide to customize the DORA tier thresholds based on your organization's performance targets.
Scorecards let you define maturity levels for your services and teams, giving engineering leaders a clear view of which areas meet delivery standards and which need attention.
This guide builds on the Track DORA metrics guide, which sets up the underlying aggregation and calculation properties. Here, we will create scorecards that automatically grade each service and team against DORA State of DevOps performance tiers for deployment frequency, lead time for changes, change failure rate (CFR), and mean time to recovery (MTTR).
Each metric gets its own scorecard, evaluated at both the service and team level, using progressive maturity levels: Bronze (Medium), Silver (High), and Gold (Elite).
Common use cases
- Set clear, measurable delivery and reliability expectations across engineering teams.
- Identify services that are falling behind on deployment velocity, lead time, or incident response.
- Compare team delivery maturity at a glance and drive improvement initiatives.
- Gate deployments or trigger alerts when services drop below a minimum scorecard level.
Steps to set up DORA scorecards
- Review prerequisites: ensure the DORA metrics data model is in place with the required aggregation and calculation properties on your service and team blueprints.
- Understand the thresholds: review the DORA performance tiers and how they map to Port scorecard levels.
- Create service-level scorecards: add a scorecard for each DORA metric on the service blueprint, grading individual services.
- Create team-level scorecards: add the same scorecards on the team blueprint, with deployment frequency normalized per service for fair comparison.
- Visualize scorecard results: build a dashboard with pie charts and tables to monitor DORA maturity across the organization.
This guide creates scorecards at two levels:
- Service level: grades each individual service against DORA benchmarks, giving service owners direct visibility into their delivery performance.
- Team level: grades teams using the same thresholds, with deployment frequency normalized by the number of services the team owns (so teams of different sizes are compared fairly).
Prerequisites
This guide assumes the following:
- You have a Port account and have completed the onboarding process.
- You have completed the Create foundational Engineering Intelligence data model guide, which provisions the core Organization, Team, and Service blueprints (with team ownership on services) for GitHub, GitLab, and Azure DevOps.
- You have completed the Track DORA metrics guide, which configures the required aggregation and calculation properties on the
serviceand_teamblueprints. - For CFR and MTTR scorecards, you have an incident integration (e.g., PagerDuty) connected as described in the DORA metrics guide.
Maturity levels
Port scorecards use four fixed maturity levels. An entity must pass all rules at a given level (and all levels below it) to achieve that level.
| Level | DORA Tier | Description |
|---|---|---|
| Basic | Low | Entity exists but meets no scorecard criteria |
| Bronze | Medium | Foundational: deploys monthly, lead time under a month |
| Silver | High | Good practices: deploys weekly, lead time under a week |
| Gold | Elite | Excellence: deploys daily, lead time under a day |
Port scorecards use fixed level names (Basic, Bronze, Silver, Gold). The DORA tier calculation properties on your entities use the standard DORA labels (Low, Medium, High, Elite). Both represent the same thresholds as shown in the table above.
DORA thresholds
Each scorecard uses thresholds aligned with the DORA State of DevOps benchmarks:
| Metric | Bronze (Medium) | Silver (High) | Gold (Elite) |
|---|---|---|---|
| Deployment Frequency | >= 0.25/week (monthly) | >= 1/week | >= 7/week (daily) |
| Lead Time for Changes | <= 720 hours (1 month) | <= 168 hours (1 week) | <= 24 hours (1 day) |
| Change Failure Rate | <= 30% | <= 20% | <= 5% |
| MTTR | <= 43,200 min (1 month) | <= 1,440 min (1 day) | <= 60 min (1 hour) |
For deployment frequency, lead time, and CFR, the Bronze threshold aligns with the DORA "Medium" tier. For MTTR however, the Bronze threshold of 1 month is more lenient than the DORA "Medium" boundary (1 day – 1 week), so it maps to the "Low" tier instead. This ensures services with infrequent incidents still receive a baseline score rather than being marked as Basic.
Create the scorecards
Each DORA metric is a separate scorecard so you can see individual metric performance as distinct badges on each entity. Select the level you want to configure:
- Service
- Team
Deployment frequency
Blueprint: Service
| # | Rule | Level | Property | Condition |
|---|---|---|---|---|
| 1 | Deploys at least monthly | Bronze | deployment_frequency | >= 0.25 |
| 2 | Deploys at least weekly | Silver | deployment_frequency | >= 1 |
| 3 | Deploys at least daily | Gold | deployment_frequency | >= 7 |
The deployment blueprint that backs the deployment_frequency property is provider-agnostic. Deployments from GitHub, GitLab, and Azure DevOps all land in the same blueprint, so all deploy frequency scorecard rules use github_svc_df_* identifiers regardless of which SCM provider you use.
Create the deployment frequency scorecard
-
Go to the Builder page of your portal.
-
Search for the Service blueprint and select it.
-
Click on the Scorecards tab.
-
Click + New Scorecard.
-
Click on the
{...} Edit JSONbutton in the top right corner. -
Paste the following JSON configuration:
Service Deployment Frequency scorecard (click to expand)
{"identifier": "dora_deploy_freq","title": "Deployment Frequency","levels": [{"color": "paleBlue","title": "Basic"},{"color": "bronze","title": "Bronze"},{"color": "silver","title": "Silver"},{"color": "gold","title": "Gold"}],"rules": [{"identifier": "github_svc_df_medium","title": "Deploys at least monthly (>= 0.25/week)","description": "DORA Medium tier - service deploys to production at least once per month.","level": "Bronze","query": {"combinator": "and","conditions": [{"operator": ">=","property": "deployment_frequency","value": 0.25}]}},{"identifier": "github_svc_df_high","title": "Deploys at least weekly (>= 1/week)","description": "DORA High tier - service deploys to production at least once per week.","level": "Silver","query": {"combinator": "and","conditions": [{"operator": ">=","property": "deployment_frequency","value": 1}]}},{"identifier": "github_svc_df_elite","title": "Deploys at least daily (>= 7/week)","description": "DORA Elite tier - service deploys to production at least once per day.","level": "Gold","query": {"combinator": "and","conditions": [{"operator": ">=","property": "deployment_frequency","value": 7}]}}]} -
Click Save to create the scorecard.
Lead time for changes
Blueprint: Service
If your organization uses services across multiple SCM providers, work through all relevant tabs below. The GitHub tab creates the scorecard, the GitLab and Azure DevOps tabs append rules to the same scorecard. This ensures every service is evaluated for lead time regardless of which provider hosts its repository.
- GitHub (Ocean)
- GitLab
- Azure DevOps
| # | Rule | Level | Property | Condition |
|---|---|---|---|---|
| 1 | Lead time under 1 month | Bronze | github_lead_time_for_change | <= 720 hours |
| 2 | Lead time under 1 week | Silver | github_lead_time_for_change | <= 168 hours |
| 3 | Lead time under 1 day | Gold | github_lead_time_for_change | <= 24 hours |
Create the lead time for changes scorecard
-
Go to the Builder page of your portal.
-
Search for the Service blueprint and select it.
-
Click on the Scorecards tab.
-
Click + New Scorecard.
-
Click on the
{...} Edit JSONbutton in the top right corner. -
Paste the following JSON configuration:
Service Lead Time for Changes scorecard (click to expand)
{"identifier": "dora_lead_time","title": "Lead Time for Changes","levels": [{"color": "paleBlue","title": "Basic"},{"color": "bronze","title": "Bronze"},{"color": "silver","title": "Silver"},{"color": "gold","title": "Gold"}],"rules": [{"identifier": "github_svc_lt_medium","title": "Lead time under 1 month (< 720h)","description": "DORA Medium tier - average lead time from PR creation to deployment is under one month.","level": "Bronze","query": {"combinator": "and","conditions": [{"operator": "<=","property": "github_lead_time_for_change","value": 720}]}},{"identifier": "github_svc_lt_high","title": "Lead time under 1 week (< 168h)","description": "DORA High tier - average lead time is under one week.","level": "Silver","query": {"combinator": "and","conditions": [{"operator": "<=","property": "github_lead_time_for_change","value": 168}]}},{"identifier": "github_svc_lt_elite","title": "Lead time under 1 day (< 24h)","description": "DORA Elite tier - average lead time is under one day.","level": "Gold","query": {"combinator": "and","conditions": [{"operator": "<=","property": "github_lead_time_for_change","value": 24}]}}]} -
Click Save to create the scorecard.
| # | Rule | Level | Property | Condition |
|---|---|---|---|---|
| 1 | Lead time under 1 month | Bronze | gitlab_lead_time_for_change | <= 720 hours |
| 2 | Lead time under 1 week | Silver | gitlab_lead_time_for_change | <= 168 hours |
| 3 | Lead time under 1 day | Gold | gitlab_lead_time_for_change | <= 24 hours |
Add GitLab rules to the existing lead time for changes scorecard
The dora_lead_time scorecard already exists on the Service blueprint (created in the GitHub tab). Open it and append the following rules to its rules array.
-
Go to the Builder page of your portal.
-
Search for the Service blueprint and select it.
-
Click on the Scorecards tab.
-
Open the existing Lead Time for Changes (
dora_lead_time) scorecard. -
Click on the
{...} Edit JSONbutton in the top right corner. -
Append the following rules to the existing
rulesarray:GitLab rules to append to existing scorecard (click to expand)
[{"identifier": "gitlab_svc_lt_medium","title": "Lead time under 1 month (< 720h)","description": "DORA Medium tier - average lead time from MR creation to deployment is under one month.","level": "Bronze","query": {"combinator": "and","conditions": [{"operator": "<=","property": "gitlab_lead_time_for_change","value": 720}]}},{"identifier": "gitlab_svc_lt_high","title": "Lead time under 1 week (< 168h)","description": "DORA High tier - average lead time is under one week.","level": "Silver","query": {"combinator": "and","conditions": [{"operator": "<=","property": "gitlab_lead_time_for_change","value": 168}]}},{"identifier": "gitlab_svc_lt_elite","title": "Lead time under 1 day (< 24h)","description": "DORA Elite tier - average lead time is under one day.","level": "Gold","query": {"combinator": "and","conditions": [{"operator": "<=","property": "gitlab_lead_time_for_change","value": 24}]}}] -
Click Save to update the scorecard.
| # | Rule | Level | Property | Condition |
|---|---|---|---|---|
| 1 | Lead time under 1 month (< 720h) | Bronze | ado_lead_time_for_change | <= 720 hours |
| 2 | Lead time under 1 week (< 168h) | Silver | ado_lead_time_for_change | <= 168 hours |
| 3 | Lead time under 1 day (< 24h) | Gold | ado_lead_time_for_change | <= 24 hours |
Add Azure DevOps rules to the existing lead time for changes scorecard
The dora_lead_time scorecard already exists on the Service blueprint (created in the GitHub tab). Open it and append the following rules to its rules array.
-
Go to the Builder page of your portal.
-
Search for the Service blueprint and select it.
-
Click on the Scorecards tab.
-
Open the existing Lead Time for Changes (
dora_lead_time) scorecard. -
Click on the
{...} Edit JSONbutton in the top right corner. -
Append the following rules to the existing
rulesarray:Azure DevOps rules to append to existing scorecard (click to expand)
[{"identifier": "ado_svc_lt_medium","title": "Lead time under 1 month (< 720h)","description": "DORA Medium tier - average lead time from linked Azure DevOps PRs is under one month.","level": "Bronze","query": {"combinator": "and","conditions": [{"operator": "<=","property": "ado_lead_time_for_change","value": 720}]}},{"identifier": "ado_svc_lt_high","title": "Lead time under 1 week (< 168h)","description": "DORA High tier - average lead time is under one week.","level": "Silver","query": {"combinator": "and","conditions": [{"operator": "<=","property": "ado_lead_time_for_change","value": 168}]}},{"identifier": "ado_svc_lt_elite","title": "Lead time under 1 day (< 24h)","description": "DORA Elite tier - average lead time is under one day.","level": "Gold","query": {"combinator": "and","conditions": [{"operator": "<=","property": "ado_lead_time_for_change","value": 24}]}}] -
Click Save to update the scorecard.
Change failure rate (CFR)
This scorecard requires an incident integration (e.g., PagerDuty) to be configured. See the Track DORA metrics guide for setup instructions.
Blueprint: Service
| # | Rule | Level | Conditions |
|---|---|---|---|
| 1 | CFR <= 30% and has deployments | Bronze | change_failure_rate <= 30 AND total_deployments > 0 |
| 2 | CFR <= 20% and has deployments | Silver | change_failure_rate <= 20 AND total_deployments > 0 |
| 3 | CFR <= 5% and has deployments | Gold | change_failure_rate <= 5 AND total_deployments > 0 |
Without the total_deployments > 0 condition, services with no deployments would automatically achieve Gold (since 0 incidents / 0 deployments = no failures). The extra condition ensures only services with real deployment activity are evaluated.
Create the change failure rate scorecard
-
Go to the Builder page of your portal.
-
Search for the Service blueprint and select it.
-
Click on the Scorecards tab.
-
Click + New Scorecard.
-
Click on the
{...} Edit JSONbutton in the top right corner. -
Paste the following JSON configuration:
Service Change Failure Rate scorecard (click to expand)
{"identifier": "dora_cfr","title": "Change Failure Rate","levels": [{"color": "paleBlue","title": "Basic"},{"color": "bronze","title": "Bronze"},{"color": "silver","title": "Silver"},{"color": "gold","title": "Gold"}],"rules": [{"identifier": "svc_cfr_medium","title": "CFR <= 30% (requires deployments)","description": "DORA Medium tier - fewer than 30% of deployments cause incidents.","level": "Bronze","query": {"combinator": "and","conditions": [{"operator": "<=","property": "change_failure_rate","value": 30},{"operator": ">","property": "total_deployments","value": 0}]}},{"identifier": "svc_cfr_high","title": "CFR <= 20% (requires deployments)","description": "DORA High tier - fewer than 20% of deployments cause incidents.","level": "Silver","query": {"combinator": "and","conditions": [{"operator": "<=","property": "change_failure_rate","value": 20},{"operator": ">","property": "total_deployments","value": 0}]}},{"identifier": "svc_cfr_elite","title": "CFR <= 5% (requires deployments)","description": "DORA Elite tier - fewer than 5% of deployments cause incidents.","level": "Gold","query": {"combinator": "and","conditions": [{"operator": "<=","property": "change_failure_rate","value": 5},{"operator": ">","property": "total_deployments","value": 0}]}}]} -
Click Save to create the scorecard.
Mean time to recovery (MTTR)
This scorecard requires an incident integration (e.g., PagerDuty) to be configured. See the Track DORA metrics guide for setup instructions.
Blueprint: Service
| # | Rule | Level | Conditions |
|---|---|---|---|
| 1 | MTTR under 1 month and has incidents | Bronze | mean_time_to_recovery <= 43200 AND total_incidents > 0 |
| 2 | MTTR under 1 day and has incidents | Silver | mean_time_to_recovery <= 1440 AND total_incidents > 0 |
| 3 | MTTR under 1 hour and has incidents | Gold | mean_time_to_recovery <= 60 AND total_incidents > 0 |
Without the total_incidents > 0 condition, services with no incidents would automatically achieve Gold (since there's nothing to recover from). The extra condition ensures only services with real incident activity are evaluated.
Create the MTTR scorecard
-
Go to the Builder page of your portal.
-
Search for the Service blueprint and select it.
-
Click on the Scorecards tab.
-
Click + New Scorecard.
-
Click on the
{...} Edit JSONbutton in the top right corner. -
Paste the following JSON configuration:
Service MTTR scorecard (click to expand)
{"identifier": "dora_mttr","title": "MTTR","levels": [{"color": "paleBlue","title": "Basic"},{"color": "bronze","title": "Bronze"},{"color": "silver","title": "Silver"},{"color": "gold","title": "Gold"}],"rules": [{"identifier": "svc_mttr_low","title": "MTTR under 1 month (< 43200 min, requires incidents)","description": "DORA Low tier - incidents are resolved within one month on average.","level": "Bronze","query": {"combinator": "and","conditions": [{"operator": "<=","property": "mean_time_to_recovery","value": 43200},{"operator": ">","property": "total_incidents","value": 0}]}},{"identifier": "svc_mttr_high","title": "MTTR under 1 day (< 1440 min, requires incidents)","description": "DORA High tier - incidents are resolved within one day on average.","level": "Silver","query": {"combinator": "and","conditions": [{"operator": "<=","property": "mean_time_to_recovery","value": 1440},{"operator": ">","property": "total_incidents","value": 0}]}},{"identifier": "svc_mttr_elite","title": "MTTR under 1 hour (< 60 min, requires incidents)","description": "DORA Elite tier - incidents are resolved within one hour on average.","level": "Gold","query": {"combinator": "and","conditions": [{"operator": "<=","property": "mean_time_to_recovery","value": 60},{"operator": ">","property": "total_incidents","value": 0}]}}]} -
Click Save to create the scorecard.
What you should see: After creating all four service-level scorecards, each service entity will display four scorecard badges, one for each DORA metric. Services with sufficient data will show Bronze, Silver, or Gold based on their performance. Services without deployment or incident data will show Basic.

Team-level scorecards use the same thresholds as service-level, with one key difference: deployment frequency uses a per-service normalized metric (deployment_frequency_per_service) so that teams are evaluated fairly regardless of how many services they own.
Lead time, CFR, and MTTR thresholds are unchanged since they already represent averages that scale naturally.
Deployment frequency
Blueprint: Team
| # | Rule | Level | Property | Condition |
|---|---|---|---|---|
| 1 | Deploys at least monthly per service | Bronze | deployment_frequency_per_service | >= 0.25 |
| 2 | Deploys at least weekly per service | Silver | deployment_frequency_per_service | >= 1 |
| 3 | Deploys at least daily per service | Gold | deployment_frequency_per_service | >= 7 |
The deployment blueprint that backs the deployment_frequency_per_service property is provider-agnostic. Deployments from GitHub, GitLab, and Azure DevOps all land in the same blueprint, so all deploy frequency scorecard rules use github_team_df_* identifiers regardless of which SCM provider you use.
Create the deployment frequency scorecard
-
Go to the Builder page of your portal.
-
Search for the Team blueprint and select it.
-
Click on the Scorecards tab.
-
Click + New Scorecard.
-
Click on the
{...} Edit JSONbutton in the top right corner. -
Paste the following JSON configuration:
Team Deployment Frequency scorecard (click to expand)
{"identifier": "team_dora_deploy_freq","title": "Deployment Frequency","levels": [{"color": "paleBlue","title": "Basic"},{"color": "bronze","title": "Bronze"},{"color": "silver","title": "Silver"},{"color": "gold","title": "Gold"}],"rules": [{"identifier": "github_team_df_medium","title": "Deploys at least monthly per service (>= 0.25/week)","description": "DORA Medium tier - each service in the team deploys at least once per month on average.","level": "Bronze","query": {"combinator": "and","conditions": [{"operator": ">=","property": "deployment_frequency_per_service","value": 0.25}]}},{"identifier": "github_team_df_high","title": "Deploys at least weekly per service (>= 1/week)","description": "DORA High tier - each service in the team deploys at least once per week on average.","level": "Silver","query": {"combinator": "and","conditions": [{"operator": ">=","property": "deployment_frequency_per_service","value": 1}]}},{"identifier": "github_team_df_elite","title": "Deploys at least daily per service (>= 7/week)","description": "DORA Elite tier - each service in the team deploys at least once per day on average.","level": "Gold","query": {"combinator": "and","conditions": [{"operator": ">=","property": "deployment_frequency_per_service","value": 7}]}}]} -
Click Save to create the scorecard.
Lead time for changes
Blueprint: Team
If your organization uses services across multiple SCM providers, work through all relevant tabs below. The GitHub tab creates the scorecard, the GitLab and Azure DevOps tabs append rules to the same scorecard. This ensures every team is evaluated for lead time regardless of which provider its services use.
- GitHub (Ocean)
- GitLab
- Azure DevOps
| # | Rule | Level | Property | Condition |
|---|---|---|---|---|
| 1 | Lead time under 1 month | Bronze | github_lead_time_for_change | <= 720 hours |
| 2 | Lead time under 1 week | Silver | github_lead_time_for_change | <= 168 hours |
| 3 | Lead time under 1 day | Gold | github_lead_time_for_change | <= 24 hours |
Create the lead time for changes scorecard
-
Go to the Builder page of your portal.
-
Search for the Team blueprint and select it.
-
Click on the Scorecards tab.
-
Click + New Scorecard.
-
Click on the
{...} Edit JSONbutton in the top right corner. -
Paste the following JSON configuration:
Team Lead Time for Changes scorecard (click to expand)
{"identifier": "team_dora_lead_time","title": "Lead Time for Changes","levels": [{"color": "paleBlue","title": "Basic"},{"color": "bronze","title": "Bronze"},{"color": "silver","title": "Silver"},{"color": "gold","title": "Gold"}],"rules": [{"identifier": "github_team_lt_medium","title": "Lead time under 1 month (< 720h)","description": "DORA Medium tier - average lead time across team services is under one month.","level": "Bronze","query": {"combinator": "and","conditions": [{"operator": "<=","property": "github_lead_time_for_change","value": 720}]}},{"identifier": "github_team_lt_high","title": "Lead time under 1 week (< 168h)","description": "DORA High tier - average lead time across team services is under one week.","level": "Silver","query": {"combinator": "and","conditions": [{"operator": "<=","property": "github_lead_time_for_change","value": 168}]}},{"identifier": "github_team_lt_elite","title": "Lead time under 1 day (< 24h)","description": "DORA Elite tier - average lead time across team services is under one day.","level": "Gold","query": {"combinator": "and","conditions": [{"operator": "<=","property": "github_lead_time_for_change","value": 24}]}}]} -
Click Save to create the scorecard.
| # | Rule | Level | Property | Condition |
|---|---|---|---|---|
| 1 | Lead time under 1 month | Bronze | gitlab_lead_time_for_change | <= 720 hours |
| 2 | Lead time under 1 week | Silver | gitlab_lead_time_for_change | <= 168 hours |
| 3 | Lead time under 1 day | Gold | gitlab_lead_time_for_change | <= 24 hours |
Add GitLab rules to the existing lead time for changes scorecard
The team_dora_lead_time scorecard already exists on the Team blueprint (created in the GitHub tab). Open it and append the following rules to its rules array.
-
Go to the Builder page of your portal.
-
Search for the Team blueprint and select it.
-
Click on the Scorecards tab.
-
Open the existing Lead Time for Changes (
team_dora_lead_time) scorecard. -
Click on the
{...} Edit JSONbutton in the top right corner. -
Append the following rules to the existing
rulesarray:GitLab rules to append to existing scorecard (click to expand)
[{"identifier": "gitlab_team_lt_medium","title": "Lead time under 1 month (< 720h)","description": "DORA Medium tier - average lead time across team services is under one month.","level": "Bronze","query": {"combinator": "and","conditions": [{"operator": "<=","property": "gitlab_lead_time_for_change","value": 720}]}},{"identifier": "gitlab_team_lt_high","title": "Lead time under 1 week (< 168h)","description": "DORA High tier - average lead time across team services is under one week.","level": "Silver","query": {"combinator": "and","conditions": [{"operator": "<=","property": "gitlab_lead_time_for_change","value": 168}]}},{"identifier": "gitlab_team_lt_elite","title": "Lead time under 1 day (< 24h)","description": "DORA Elite tier - average lead time across team services is under one day.","level": "Gold","query": {"combinator": "and","conditions": [{"operator": "<=","property": "gitlab_lead_time_for_change","value": 24}]}}] -
Click Save to update the scorecard.
| # | Rule | Level | Property | Condition |
|---|---|---|---|---|
| 1 | Lead time under 1 month (< 720h) | Bronze | ado_lead_time_for_change | <= 720 hours |
| 2 | Lead time under 1 week (< 168h) | Silver | ado_lead_time_for_change | <= 168 hours |
| 3 | Lead time under 1 day (< 24h) | Gold | ado_lead_time_for_change | <= 24 hours |
Add Azure DevOps rules to the existing lead time for changes scorecard
The team_dora_lead_time scorecard already exists on the Team blueprint (created in the GitHub tab). Open it and append the following rules to its rules array.
-
Go to the Builder page of your portal.
-
Search for the Team blueprint and select it.
-
Click on the Scorecards tab.
-
Open the existing Lead Time for Changes (
team_dora_lead_time) scorecard. -
Click on the
{...} Edit JSONbutton in the top right corner. -
Append the following rules to the existing
rulesarray:Azure DevOps rules to append to existing scorecard (click to expand)
[{"identifier": "ado_team_lt_medium","title": "Lead time under 1 month (< 720h)","description": "DORA Medium tier - team average lead time from Azure DevOps PRs is under one month.","level": "Bronze","query": {"combinator": "and","conditions": [{"operator": "<=","property": "ado_lead_time_for_change","value": 720}]}},{"identifier": "ado_team_lt_high","title": "Lead time under 1 week (< 168h)","description": "DORA High tier - team average lead time is under one week.","level": "Silver","query": {"combinator": "and","conditions": [{"operator": "<=","property": "ado_lead_time_for_change","value": 168}]}},{"identifier": "ado_team_lt_elite","title": "Lead time under 1 day (< 24h)","description": "DORA Elite tier - team average lead time is under one day.","level": "Gold","query": {"combinator": "and","conditions": [{"operator": "<=","property": "ado_lead_time_for_change","value": 24}]}}] -
Click Save to update the scorecard.
Change failure rate (CFR)
This scorecard requires an incident integration (e.g., PagerDuty) to be configured. See the Track DORA metrics guide for setup instructions.
Blueprint: Team
| # | Rule | Level | Conditions |
|---|---|---|---|
| 1 | CFR <= 30% (requires deployments) | Bronze | change_failure_rate <= 30 AND change_failure_rate is not empty |
| 2 | CFR <= 20% (requires deployments) | Silver | change_failure_rate <= 20 AND change_failure_rate is not empty |
| 3 | CFR <= 5% (requires deployments) | Gold | change_failure_rate <= 5 AND change_failure_rate is not empty |
Create the change failure rate scorecard
-
Go to the Builder page of your portal.
-
Search for the Team blueprint and select it.
-
Click on the Scorecards tab.
-
Click + New Scorecard.
-
Click on the
{...} Edit JSONbutton in the top right corner. -
Paste the following JSON configuration:
Team Change Failure Rate scorecard (click to expand)
{"identifier": "team_dora_cfr","title": "Change Failure Rate","levels": [{"color": "paleBlue","title": "Basic"},{"color": "bronze","title": "Bronze"},{"color": "silver","title": "Silver"},{"color": "gold","title": "Gold"}],"rules": [{"identifier": "team_cfr_medium","title": "CFR <= 30% (requires deployments)","description": "DORA Medium tier - fewer than 30% of deployments cause incidents.","level": "Bronze","query": {"combinator": "and","conditions": [{"operator": "<=","property": "change_failure_rate","value": 30},{"operator": "isNotEmpty","property": "change_failure_rate"}]}},{"identifier": "team_cfr_high","title": "CFR <= 20% (requires deployments)","description": "DORA High tier - fewer than 20% of deployments cause incidents.","level": "Silver","query": {"combinator": "and","conditions": [{"operator": "<=","property": "change_failure_rate","value": 20},{"operator": "isNotEmpty","property": "change_failure_rate"}]}},{"identifier": "team_cfr_elite","title": "CFR <= 5% (requires deployments)","description": "DORA Elite tier - fewer than 5% of deployments cause incidents.","level": "Gold","query": {"combinator": "and","conditions": [{"operator": "<=","property": "change_failure_rate","value": 5},{"operator": "isNotEmpty","property": "change_failure_rate"}]}}]} -
Click Save to create the scorecard.
Mean time to recovery (MTTR)
This scorecard requires an incident integration (e.g., PagerDuty) to be configured. See the Track DORA metrics guide for setup instructions.
Blueprint: Team
| # | Rule | Level | Conditions |
|---|---|---|---|
| 1 | MTTR under 1 month and has incidents | Bronze | mean_time_to_recovery <= 43200 AND total_incidents > 0 |
| 2 | MTTR under 1 day and has incidents | Silver | mean_time_to_recovery <= 1440 AND total_incidents > 0 |
| 3 | MTTR under 1 hour and has incidents | Gold | mean_time_to_recovery <= 60 AND total_incidents > 0 |
Create the MTTR scorecard
-
Go to the Builder page of your portal.
-
Search for the Team blueprint and select it.
-
Click on the Scorecards tab.
-
Click + New Scorecard.
-
Click on the
{...} Edit JSONbutton in the top right corner. -
Paste the following JSON configuration:
Team MTTR scorecard (click to expand)
{"identifier": "team_dora_mttr","title": "MTTR","levels": [{"color": "paleBlue","title": "Basic"},{"color": "bronze","title": "Bronze"},{"color": "silver","title": "Silver"},{"color": "gold","title": "Gold"}],"rules": [{"identifier": "team_mttr_low","title": "MTTR under 1 month (< 43200 min, requires incidents)","description": "DORA Low tier - incidents are resolved within one month on average.","level": "Bronze","query": {"combinator": "and","conditions": [{"operator": "<=","property": "mean_time_to_recovery","value": 43200},{"operator": ">","property": "total_incidents","value": 0}]}},{"identifier": "team_mttr_high","title": "MTTR under 1 day (< 1440 min, requires incidents)","description": "DORA High tier - incidents are resolved within one day on average.","level": "Silver","query": {"combinator": "and","conditions": [{"operator": "<=","property": "mean_time_to_recovery","value": 1440},{"operator": ">","property": "total_incidents","value": 0}]}},{"identifier": "team_mttr_elite","title": "MTTR under 1 hour (< 60 min, requires incidents)","description": "DORA Elite tier - incidents are resolved within one hour on average.","level": "Gold","query": {"combinator": "and","conditions": [{"operator": "<=","property": "mean_time_to_recovery","value": 60},{"operator": ">","property": "total_incidents","value": 0}]}}]} -
Click Save to create the scorecard.
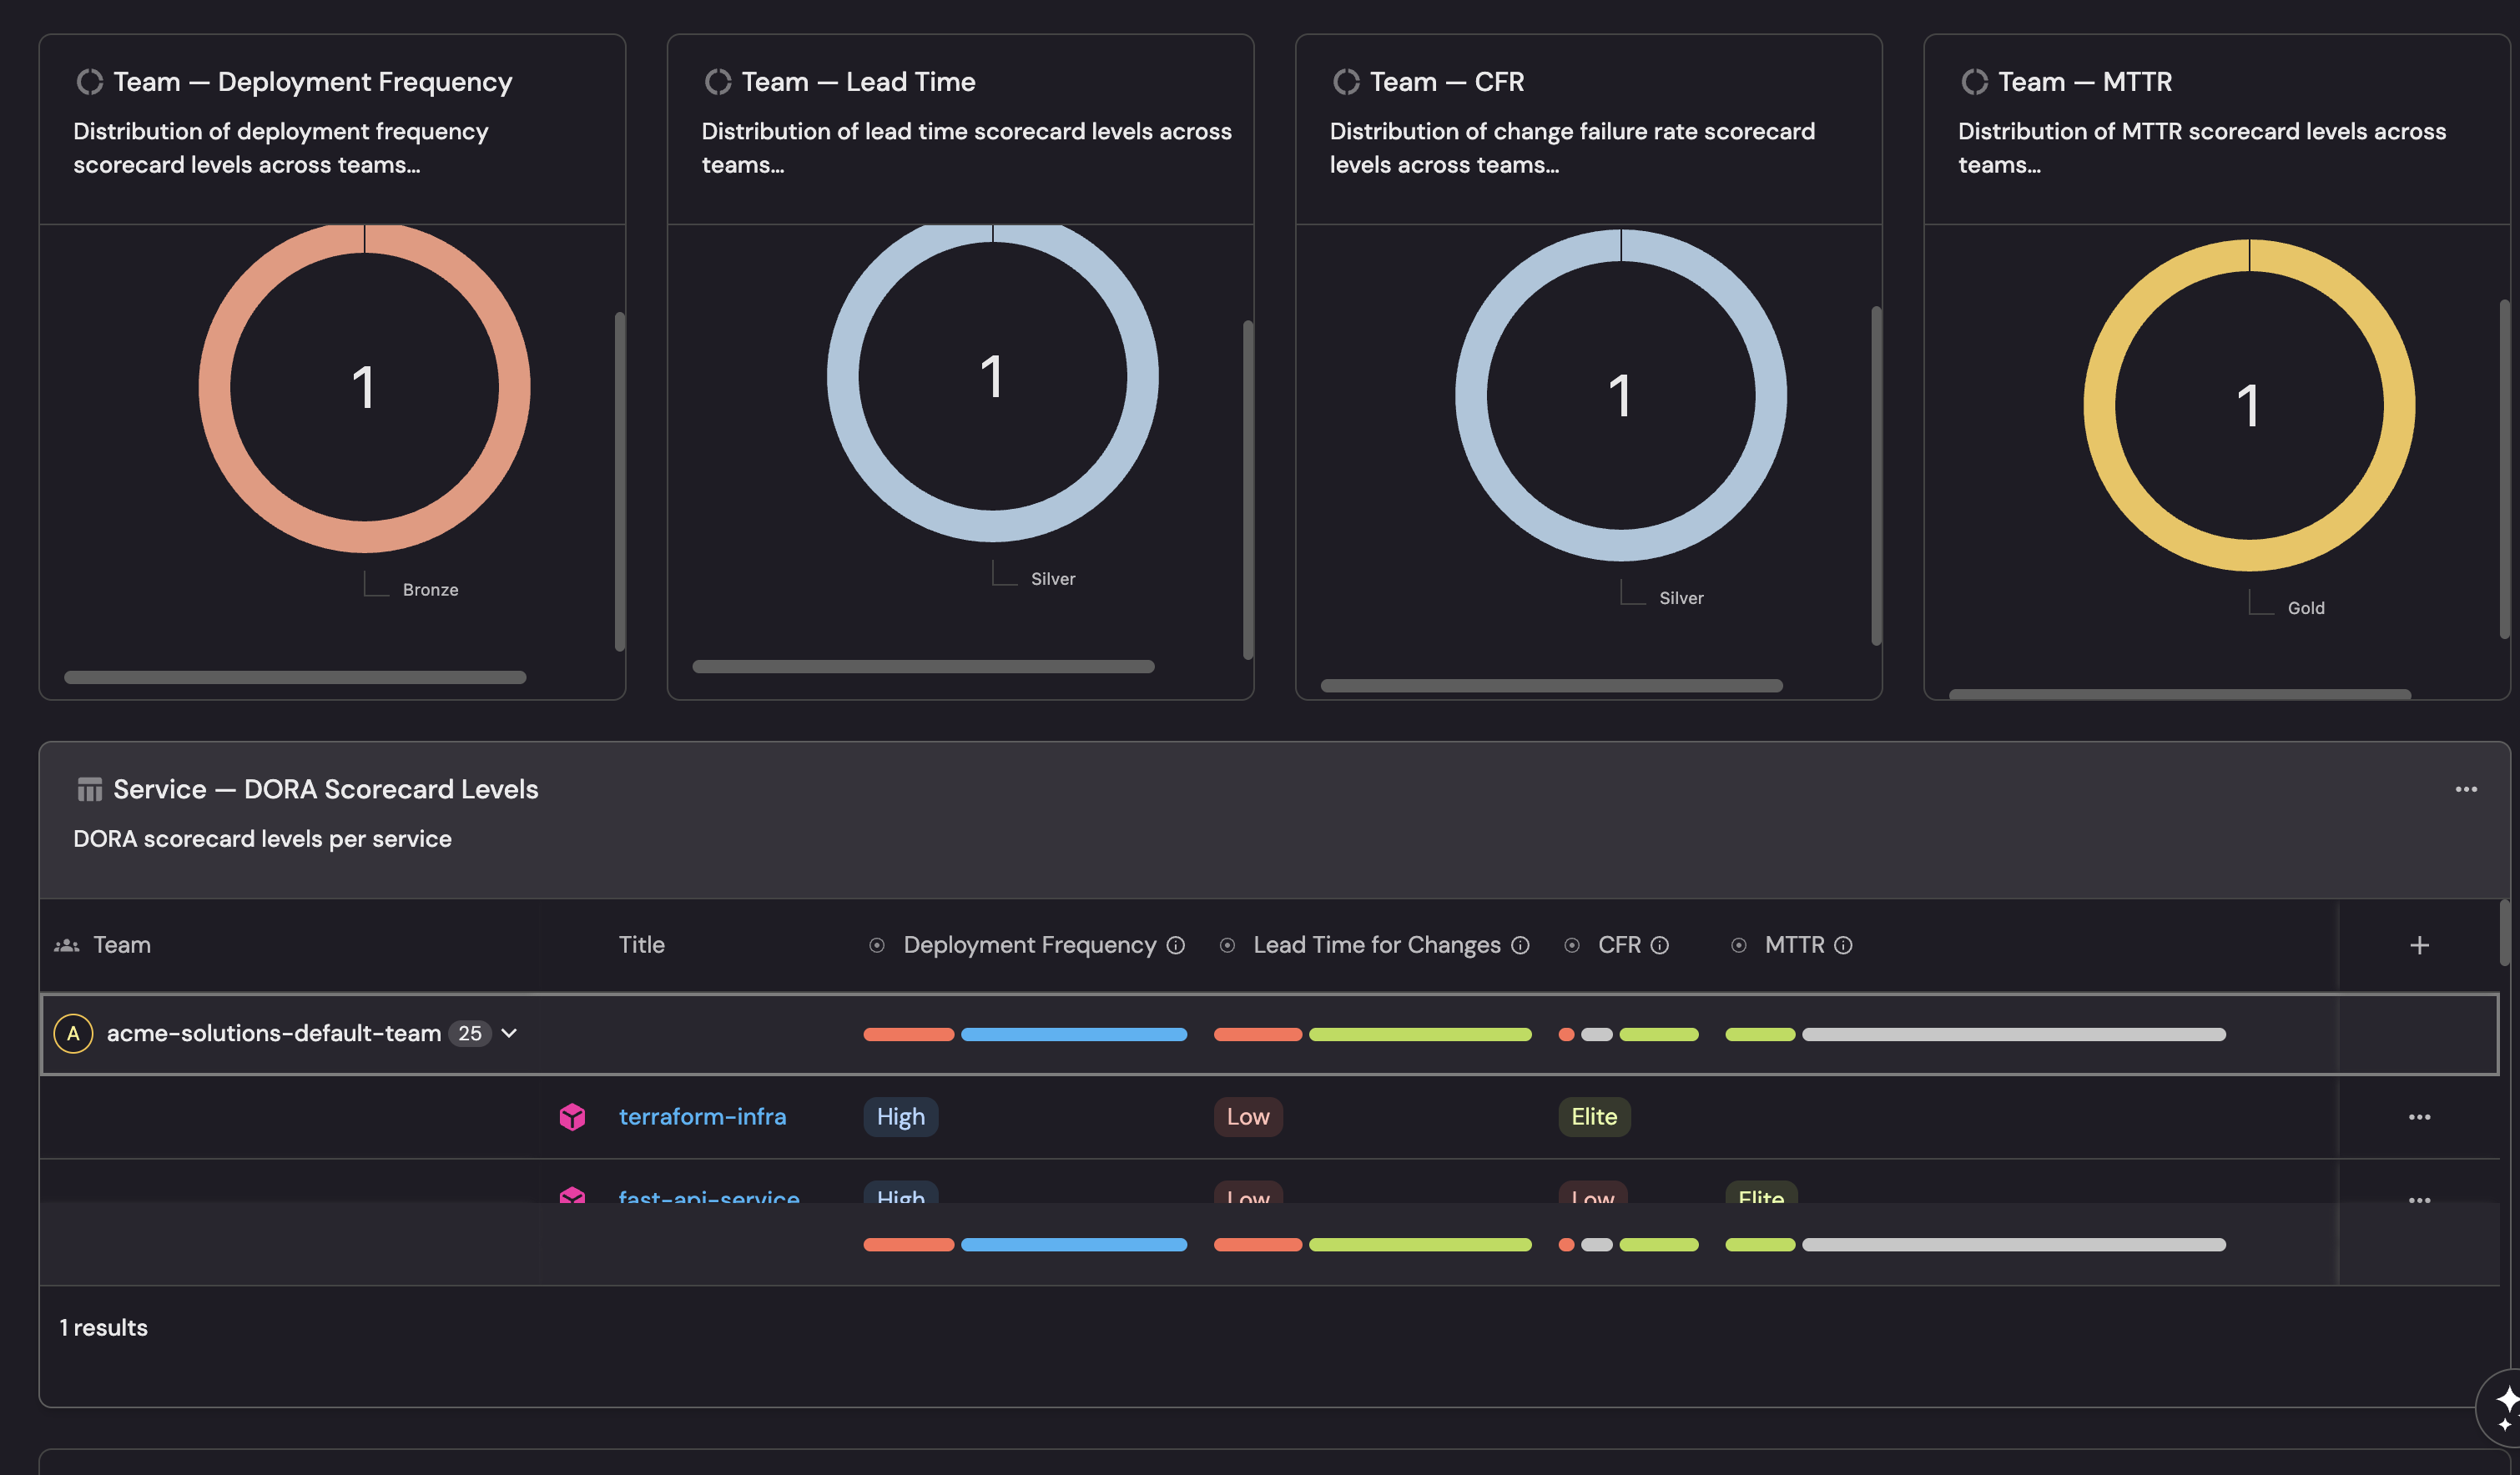
What you should see: After creating all four team-level scorecards, each team entity will display four scorecard badges. Team deployment frequency uses a per-service normalized metric, so teams managing different numbers of services are compared fairly.
Visualize scorecard results
Once the scorecards are in place, create a dashboard to monitor DORA maturity across services and teams.
Create the dashboard
- Navigate to your software catalog.
- Click on the
+button in the left sidebar. - Select New folder.
- Name the folder Engineering Intelligence and click Create. If the folder already exists, skip this step.
- Inside the Engineering Intelligence folder, click the
+button again. - Select New dashboard.
- Name the dashboard DORA Scorecards and click Create.
Add widgets
You can populate the dashboard using either an API script or by manually creating each widget through the UI.
- API script
- Manual setup
The fastest way to set up the dashboard is by using Port's API to create all widgets at once.
Get your Port API token
-
In your Port application, click on your profile picture
 .
. -
Select Credentials.
-
Click Generate API token.
-
Copy the generated token and store it as an environment variable:
export PORT_ACCESS_TOKEN="YOUR_GENERATED_TOKEN"
If your portal is hosted in the EU region, replace api.port.io with api.port-eu.io in the dashboard creation command below.
Create the dashboard with widgets
Save the following JSON to a file named dora_scorecards_dashboard.json:Dashboard JSON payload (click to expand)
Then run the following command to create the dashboard with all widgets:
curl -s -X POST "https://api.port.io/v1/pages" \
  -H "Authorization: Bearer $PORT_ACCESS_TOKEN" \
  -H "Content-Type: application/json" \
  -d @dora_scorecards_dashboard.json | python3 -m json.tool
The script assumes an engineering_intelligence folder already exists in your catalog. If you haven't created it yet, follow steps 1-4 in the create the dashboard section first.
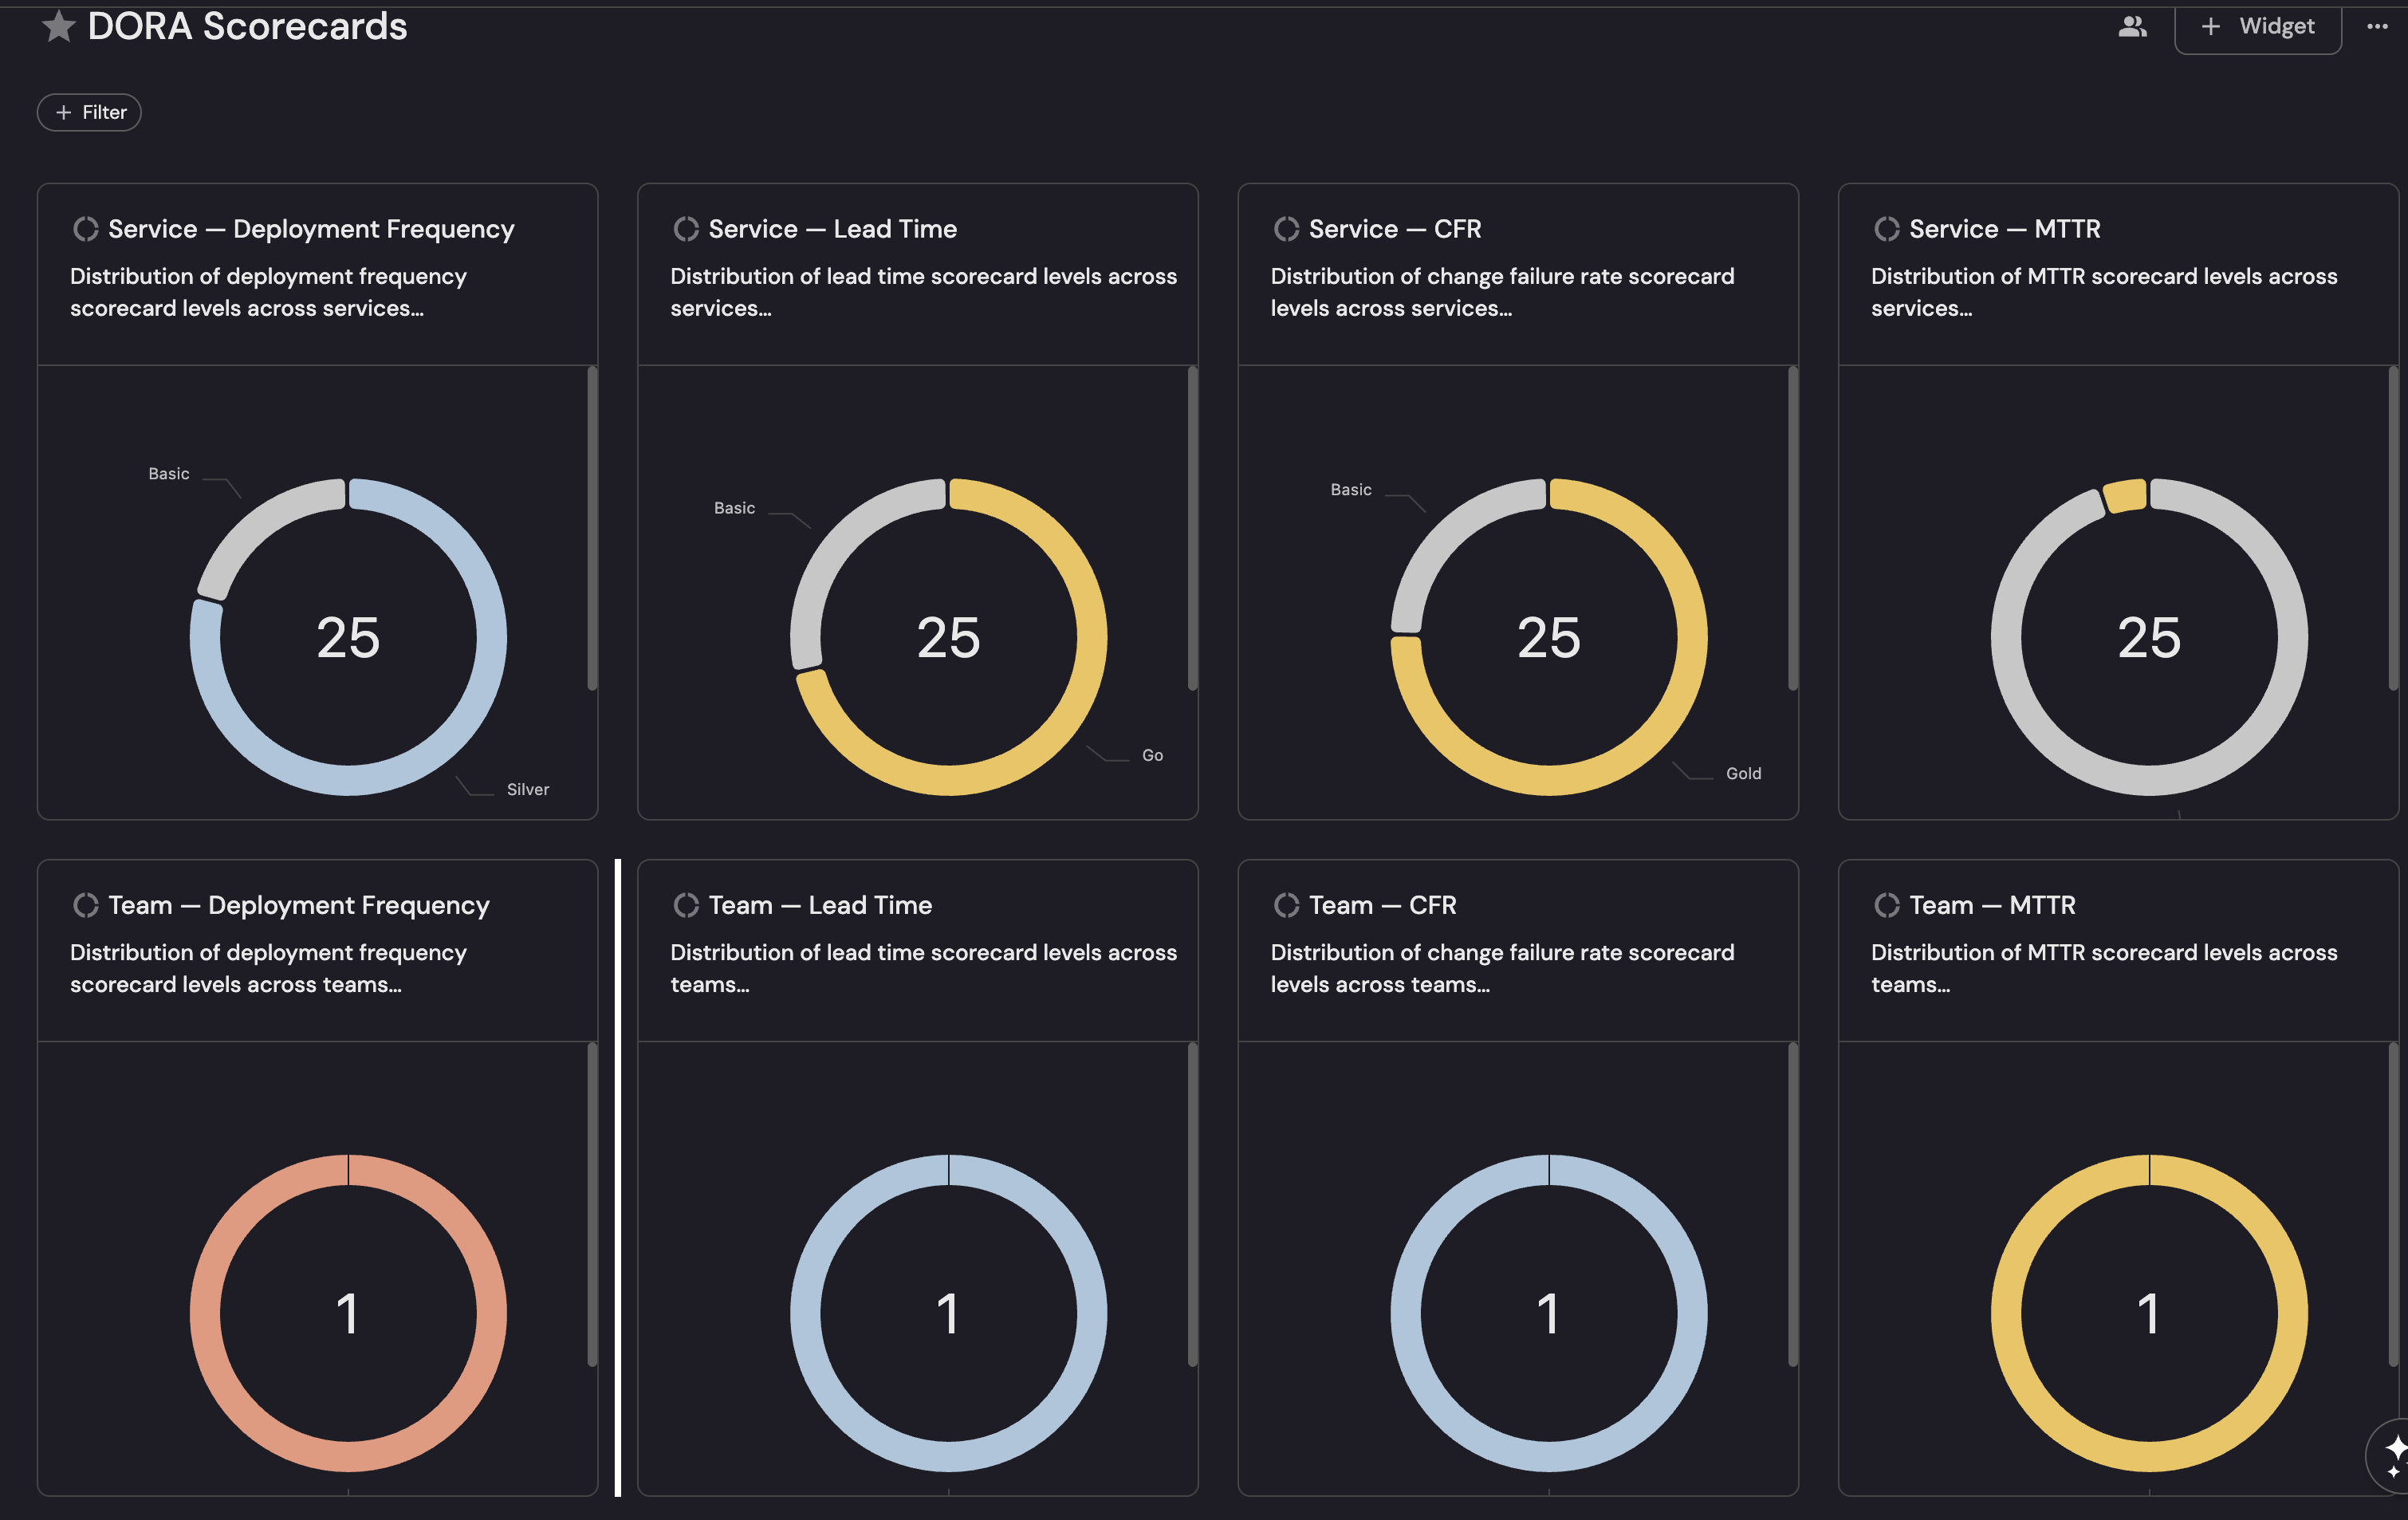
Scorecard level distribution (pie charts)
Create a pie chart for each DORA metric at both service and team level:Service deployment frequency distribution (click to expand)
+ Widget and select Pie Chart.Service Deployment Frequency.Deployment Frequency under Scorecard as the property to group by.Service lead time distribution (click to expand)
+ Widget and select Pie Chart.Service Lead Time.Lead Time for Changes under Scorecard as the property to group by.Service CFR distribution (click to expand)
+ Widget and select Pie Chart.Service CFR.Change Failure Rate under Scorecard as the property to group by.Service MTTR distribution (click to expand)
+ Widget and select Pie Chart.Service MTTR.MTTR under Scorecard as the property to group by.
Repeat the same pattern for team-level pie charts, selecting the Team blueprint and the corresponding team scorecard. Add a dataset filter type = team to exclude groups and organizations.
Service and team tables
Service DORA scorecard levels table (click to expand)
- Click
+ Widgetand select Table. - Title:
Service DORA Scorecard Levels. - Choose the Service blueprint.
- Click Save.
- Click on the
...button in the top right corner of the table and select Customize table. - In the top right corner of the table, click on Manage Properties and add the following columns:
- Owning Teams (
$team): The team that owns the service. - Deployment Frequency (scorecard): The scorecard badge level.
- Deploy Freq Tier (
deploy_freq_tier): The DORA tier label (Elite/High/Medium/Low). - Lead Time for Changes (scorecard): The scorecard badge level.
- Lead Time Tier (
github_lead_time_tierfor GitHub,gitlab_lead_time_tierfor GitLab,ado_lead_time_tierfor Azure DevOps): The DORA tier label. - Change Failure Rate (scorecard): The scorecard badge level.
- CFR Tier (
cfr_tier): The DORA tier label. - MTTR (scorecard): The scorecard badge level.
- MTTR Tier (
mttr_tier): The DORA tier label.
- Owning Teams (
- Group by Owning Teams (
$teamfor GitHub,teamfor GitLab/Azure) for easier comparison.
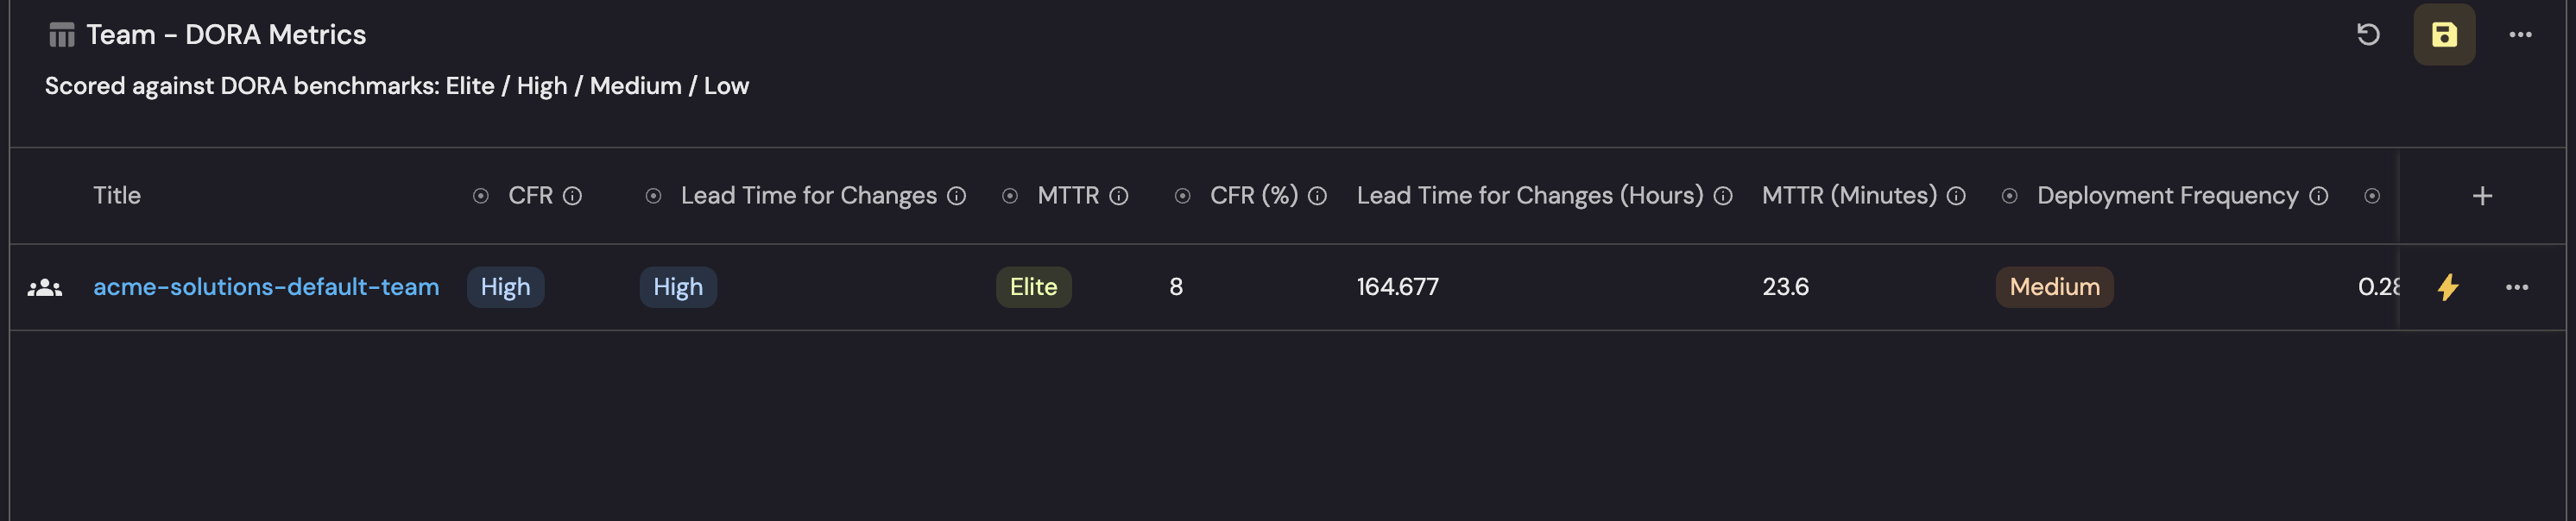
Team DORA scorecard levels table (click to expand)
- Click
+ Widgetand select Table. - Title:
Team DORA Scorecard Levels. - Choose the Team blueprint.
- Add a dataset filter: type
=team. - Click Save.
- Click on the
...button in the top right corner of the table and select Customize table. - In the top right corner of the table, click on Manage Properties and add the same scorecard and tier columns as the service table.
What you should see: The completed DORA Scorecards dashboard displays pie charts showing the distribution of scorecard levels across services and teams, followed by table widgets listing each entity with its DORA scorecard grades and tier labels side by side.
Design decisions
Per-metric scorecards vs. combined scorecard
Unlike the Delivery Performance scorecard which combines multiple PR metrics into a single scorecard, DORA scorecards are split into four separate scorecards (one per metric). This is intentional:
- Independent evaluation: A service can be Elite at deployment frequency but Low at lead time. A combined scorecard would mask this by averaging across metrics.
- Targeted improvement: Teams can focus on the specific metric that needs attention without being penalized by other metrics.
- Conditional metrics: CFR and MTTR require an incident integration. Separate scorecards allow you to start with deployment frequency and lead time, then add CFR and MTTR when incidents are configured.
Team-level normalization
Team deployment frequency uses a per-service normalized metric (deployment_frequency_per_service). This divides the team's total deployment frequency by the number of services it owns, so a team with 10 services deploying 70 times per week is evaluated the same as a team with 1 service deploying 7 times per week both achieve Gold.
Lead time, CFR, and MTTR thresholds are unchanged at team level since they already represent averages that scale naturally.
Guard conditions on CFR and MTTR
Service CFR rules require total_deployments > 0 and MTTR rules require total_incidents > 0. Team CFR rules use isNotEmpty on change_failure_rate - since change_failure_rate is itself null when there are no deployments, this serves the same purpose. Without these guard conditions, entities with no data would trivially pass all rules and achieve Gold which would be misleading.
Threshold sources
Thresholds are aligned with the DORA State of DevOps performance tiers as published by Google Cloud's DevOps Research and Assessment program.
Next steps
- Add automations: Use Port automations to send Slack notifications when a service drops below Bronze on any DORA metric, or create Jira tickets for teams with consistently Low deployment frequency.
- Customize thresholds: Adjust the numeric values in the scorecard rules to match your organization's delivery standards. For example, if daily deployments aren't realistic for your team, lower the Gold threshold from 7/week to 5/week.
- Combine with delivery performance scorecards: Use both DORA and delivery performance scorecards together for a comprehensive view of engineering maturity.
Related guides
- Track DORA metrics: Set up the underlying data model and metrics these scorecards depend on.
- Set up delivery performance scorecards: PR-focused scorecards for throughput, cycle time, and stale PR management.
- Measure PR delivery metrics: Set up PR delivery metrics at service and team level.