Set up deployments and incidents using Jira issues
Send this guide to your coding agent.
Prerequisite: Install Port MCP
Open plan mode. Implement this Port guide in my org via MCP:

https://docs.port.io/guides/all/setup-dora-metrics-jira

Goal: get the guide's core flow working end-to-end in my org; adapting it to fit my existing setup takes priority over matching the guide 1:1.

Plan:
1. Confirm MCP is connected, in the right org, with sufficient permissions.
2. Diff the guide's data model (blueprints, properties, relations, actions, agents, automations, integrations, secrets) against mine.
3. Propose adaptations for gaps, reusing existing blueprints/relations over guide-named duplicates.
4. Flag what needs a UI click, credential, or secret from me, testing MCP capability empirically before ruling anything out.
5. Stop on any blocker and give me options. Approving this plan authorizes the writes it lists; pause only for writes beyond what's listed.

Build:
- Extend blueprint schema additively when upserting; don't remove or overwrite existing properties, and treat type conflicts as a blocker, not an auto-fix.
- List any mock data in the plan, minimal and labeled mock; once approved, seed it without re-asking, and tell me what you seeded.
- For anything the guide writes downstream (e.g. a webhook target), use a real entity, not a mock.
- For pages/widgets, use the real page identifier from the app URL, not a guessed slug.
- When you hit a UI step confirmed (not assumed) unsupported via MCP, pause, give exact clicks, then resume via MCP.
- Validate and give links after each meaningful step (only a tool-returned URL, no guessed paths); don't proceed if the last run wasn't a success.

Done:
- Confirm the guide's expected output exists and runs in Port.
- Summarize adaptations, seeded data, what was mocked or skipped, remaining UI steps, and how to verify.
The Create & track DORA metrics in your portal guide walks you through installing the DORA metrics experience in Port, using GitHub and PagerDuty as the default deployment and incident methods.
This guide assumes you have already completed that setup and shows how to adapt it for Jira users.
By following this guide, you will see how to define deployments and incidents in Port using Jira issues. By the end, you will be able to leverage DORA metrics using Jira, providing accurate deployment and incident insights in your portal.
Prerequisites
To set up Jira issues for DORA metrics in your portal, you will need:
- Admin permissions (to install the experience and execute self-service actions).
- An installed DORA Metrics experience, based on: Create & track DORA metrics in your portal.
- An installed Jira integration.
Configure your deployments and incidents
Map Jira issues as deployments or incidents
- Navigate to Data Sources and select your Jira integration.
- Add new mappings to ingest Jira issues as deployment or incident entities.
These mappings ingest Jira events into the dora_deployment_event or dora_incident_event blueprints. For more details, see the Create & track DORA metrics in your portal.
Deployments using Jira issues:
- kind: issue
  selector:
  query: 'true'
  jql: (statusCategory != Done) OR (created >= -4w) OR (updated >= -4w)
  port:
  entity:
       mappings:
       identifier: .key
       title: .fields.summary
       blueprint: '"dora_deployment_event"'
       properties:
           deployment_type: '"Jira Issue"'
           deployment_time: .fields.resolutiondate
           status: >-
           if (.fields.resolutiondate != null) then "success" else "pending"
           end
           lead_time_hours: >-
           if (.fields.resolutiondate != null and .fields.created != null)
           then ((.fields.resolutiondate[0:19] + "Z" | fromdateiso8601) -
           (.fields.created[0:19] + "Z" | fromdateiso8601)) / 86400 else null
           end
Incidents using Jira issues:
- kind: issue
  selector:
  query: 'true'
  jql: >-
      ((statusCategory != Done) OR (created >= -1w) OR (updated >= -1w))
  port:
  entity:
      mappings:
      identifier: .key
      title: .fields.summary
      blueprint: '"dora_incident_event"'
      properties:
          incident_type: '"Jira Issue"'
          description: .fields.description.content| .. | objects | select(.type? == "text") | .text
          incident_url: ( .self | split("/") | .[0:3] | join("/") ) + "/browse/" + .key
          created_at: .fields.created
          resolved_at: .fields.resolutiondate
          time_to_resolve: >-
          if (.fields.resolutiondate != null and .fields.created != null)
          then ((.fields.resolutiondate[0:19] + "Z" | fromdateiso8601) -
          (.fields.created[0:19] + "Z" | fromdateiso8601)) / 86400 else null
          end
You can map Jira custom fields to track additional incident information. Here's an example of mapping custom fields for urgency, status, and priority:
urgency: .fields.customfield_00000
status: .fields.customfield_00000
priority: .fields.customfield_00000
After you save the mappings, Port will begin ingesting matching Jira issues as deployments or incidents.
Filtering or tagging (optional)
You can filter or tag deployments and incidents by project, issue types, statuses, or other criteria.
This can be accomplished by using JQL (Jira Query Language) within your mapping configuration. For additional information, refer to JQL documentation.
Test your configuration
- Create or move to done a Jira ticket matching your mappings.
- In Port, navigate to the corresponding deployment or incident blueprint to verify that the new entity appears correctly.
Next steps
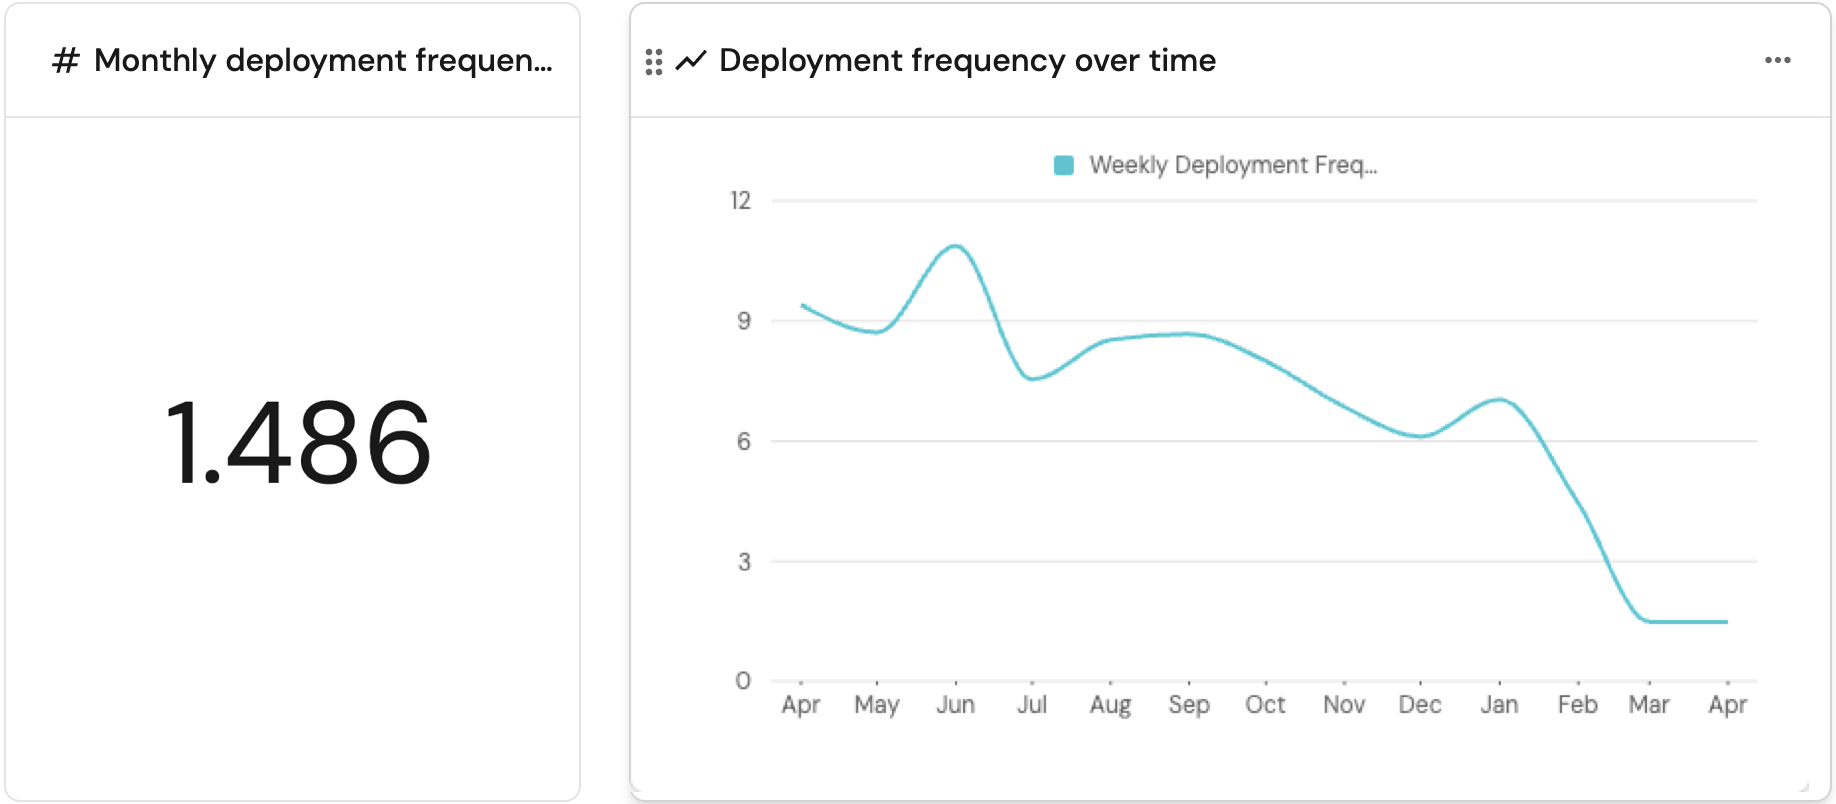
- Once your Jira integration data begins populating, view your DORA metrics dashboard to analyze deployment and incident trends.
- Link deployments and incidents to teams or services for more detailed insights.