Track DORA metrics
If you signed up for Port on or after May 1, 2026, DORA metrics are already tracked in your portal. Follow this guide to customize the DORA calculations to match your organization's deployment workflow and tooling.
The four DORA (DevOps Research and Assessment) metrics deployment frequency, lead time for changes, change failure rate, and mean time to recovery are the industry standard for measuring software delivery performance.
By tracking these metrics, you can identify areas for improvement and ensure your team is delivering high-quality software efficiently.
This guide walks you through building DORA metrics tracking in Port for deployment frequency, lead time for changes, change failure rate (CFR), and mean time to recovery (MTTR) at both the service and team level.
By the end of this guide, you will have a DORA metrics dashboard providing visibility into delivery performance across services and teams, with automatic tier classification (Elite, High, Medium, Low) based on DORA benchmarks.
Steps to build DORA metrics
- Validate your data model: ensure the foundational blueprints (
service,Team) and relations are in place and aligned. DORA metrics build on top of this foundation. - Track deployments: create the deployment blueprint and map merged PRs to deployment entities. This is the recommended default strategy. For organizations that require a more customized approach, alternative strategies such as workflow runs, CI/CD pipelines, or releases are also supported.
- Track incidents (optional): connect PagerDuty (or another tool) to enable CFR and MTTR.
- Configure metrics: add aggregation and tier calculation properties for deployment frequency, lead time, CFR, and MTTR at the service and team level.
- Build the dashboard: create widgets to visualize DORA metrics across your organization.
Prerequisites
This guide assumes the following:
- A Port account with the onboarding process completed.
- Foundational data model in place: complete the Create foundational Engineering Intelligence data model guide, which provisions the core Organization, Team, and Service blueprints (with team ownership on services) for GitHub, GitLab, and Azure DevOps.
- A connected Git repository (GitHub, GitLab, or Azure Repos) linked to Port. Note: Other Git providers are supported, though this guide focuses on the three mentioned above.
- An active Git integration: For GitHub users ensure Port's GitHub integration or Port's GitHub Ocean integration is installed.
- (Optional) Incident Management integration: To track change failure rate and MTTR metrics, a PagerDuty integration with the
pagerdutyIncidentblueprint is required.
Change failure rate and MTTR require an incident management integration with incident entities linked to services. This guide uses PagerDuty as the example, but the same approach applies to other tools like OpsGenie, FireHydrant, or ServiceNow. You just need to adjust the blueprint identifier and property names to match your integration.
Without an incident integration, only deployment frequency and lead time metrics will be available.
Tracking deployments
Deployments refer to releasing new or updated code into various environments such as Production, Staging, or Testing.
Tracking deployments helps you understand how efficiently your team ships features and monitor release stability.
By default, this guide creates deployment entities from merged pull requests to the default branch, which is the simplest and most common approach. If your organization requires a more customized deployment tracking strategy (e.g., via CI/CD pipelines, workflow runs, or releases), see Alternative deployment tracking strategies below.
Deployments contribute to three key DORA metrics: deployment frequency, change failure rate, and lead time for changes.
Create the deployment blueprint
-
Navigate to your Port Builder page.
-
Click the
+ Blueprintbutton to create a new blueprint. -
Click on the
{...} Edit JSONbutton in the top right corner. -
Paste the JSON for your Git provider and click Save:
- GitHub
- GitLab
- Azure DevOps
Deployment blueprint (click to expand)
{"identifier": "deployment","title": "Deployment","icon": "Deployment","description": "A production deployment created from a merged PR to the default branch","schema": {"properties": {"deploymentStatus": {"title": "Deployment Status","type": "string","enum": ["Success", "Failure"],"enumColors": {"Success": "green","Failure": "red"}},"environment": {"title": "Environment","type": "string","enum": ["Production", "Staging", "Development"],"enumColors": {"Production": "green","Staging": "yellow","Development": "blue"}},"createdAt": {"title": "Deployment Time","type": "string","format": "date-time"}},"required": []},"mirrorProperties": {"github_lead_time_hours": {"title": "Lead Time for Changes (Hours)","path": "github_pull_request.cycle_time_hours"},"github_repo_id": {"title": "GitHub Repository ID","path": "github_pull_request.repository.$identifier"},"gitlab_repo_id": {"title": "GitLab Repository ID","path": "gitlab_merge_request.repository.$identifier"},"ado_repo_id": {"title": "ADO Repository ID","path": "ado_pull_request.repository.$identifier"}},"calculationProperties": {},"aggregationProperties": {},"relations": {"service": {"target": "service","title": "Service","many": false,"required": false},"github_pull_request": {"target": "githubPullRequest","title": "Pull Request","many": false,"required": false}}}Deployment blueprint (click to expand)
{"identifier": "deployment","title": "Deployment","icon": "Deployment","description": "A production deployment created from a merged MR to the default branch","schema": {"properties": {"deploymentStatus": {"title": "Deployment Status","type": "string","enum": ["Success", "Failure", "Pending"],"enumColors": {"Success": "green","Failure": "red","Pending": "yellow"}},"environment": {"title": "Environment","type": "string","enum": ["Production", "Staging", "Development"],"enumColors": {"Production": "green","Staging": "yellow","Development": "blue"}},"createdAt": {"title": "Deployment Time","type": "string","format": "date-time"}},"required": []},"mirrorProperties": {"gitlab_lead_time_hours": {"title": "Lead Time for Changes (Hours)","path": "gitlab_merge_request.cycle_time_hours"},"gitlab_repo_id": {"title": "GitLab Repository ID","path": "gitlab_merge_request.repository.$identifier"}},"calculationProperties": {},"aggregationProperties": {},"relations": {"service": {"target": "service","title": "Service","many": false,"required": false},"gitlab_merge_request": {"target": "gitlabMergeRequest","title": "Merge Request","many": false,"required": false}}}Deployment blueprint (click to expand)
{"identifier": "deployment","title": "Deployment","icon": "Deployment","description": "A production deployment created from a merged PR to the default branch","schema": {"properties": {"deploymentStatus": {"title": "Deployment Status","type": "string","enum": ["Success", "Failure", "Pending"],"enumColors": {"Success": "green","Failure": "red","Pending": "yellow"}},"environment": {"title": "Environment","type": "string","enum": ["Production", "Staging", "Development"],"enumColors": {"Production": "green","Staging": "yellow","Development": "blue"}},"createdAt": {"title": "Deployment Time","type": "string","format": "date-time"}},"required": []},"mirrorProperties": {"ado_lead_time_hours": {"title": "Lead Time for Changes (Hours)","path": "ado_pull_request.cycle_time_hours"},"ado_repo_id": {"title": "ADO Repository ID","path": "ado_pull_request.repository.$identifier"}},"calculationProperties": {},"aggregationProperties": {},"relations": {"service": {"target": "service","title": "Service","many": false,"required": false},"ado_pull_request": {"target": "azureDevopsPullRequest","title": "Pull Request","many": false,"required": false}}}
What you should see: After saving, the Deployment blueprint appears in your Builder with relations to both Service and your PR/MR blueprint, plus a lead time mirror property (github_lead_time_hours for GitHub, gitlab_lead_time_hours for GitLab, ado_lead_time_hours for Azure DevOps).
If you do not have the lead time (cycle_time_hours) configured on your pull request / merge request blueprint, follow the relevant guide for your Git provider:
- GitHub: Map repositories and pull requests
- GitLab: Map projects, README.md, and merge requests
- Azure DevOps: Map repositories, policies, and pull requests
Alternatively, you can use the default leadTimeHours property that comes with some integrations and update the mirror property path to github_pull_request.leadTimeHours (GitHub), gitlab_merge_request.leadTimeHours (GitLab), or ado_pull_request.leadTimeHours (Azure DevOps).
Map deployments from merged PRs
The recommended approach is to create deployment entities automatically when pull requests are merged into the default branch. Each merged PR creates a deployment entity with the lead time calculated as the time from PR creation to merge. If your organization requires a more complex setup (e.g., workflow runs, CI/CD pipelines, releases, or custom API), see Alternative deployment tracking strategies below.
- Navigate to the data sources page in your Port portal.
- Select your Git integration.
Add the deployment mapping configuration for your provider:
- GitHub
- GitLab
- Azure DevOps
- GitHub (Ocean)
- GitHub (Sunset)
Deployment mapping from merged PRs (click to expand)
The deploymentStatus is hardcoded to Success and environment to Production in these examples. You can modify these values based on your requirements.
- kind: pull-request
  selector:
    query: .base.ref == "main" and .state == "closed" and .merged_at != null
    states: ["closed"]
    maxResults: 100
    since: 90
  port:
    entity:
      mappings:
        identifier: .head.repo.name + "-deploy-" + (.number | tostring)
        title: '"Merge: " + .title'
        blueprint: '"deployment"'
        properties:
          environment: '"Production"'
          deploymentStatus: '"Success"'
          createdAt: .merged_at
        relations:
          service: .head.repo.name
          github_pull_request: .head.repo.name + "-pr-" + (.number | tostring)
Set github_pull_request to the same expression as the identifier in your GitHub Ocean pull-request resource (often .head.repo.name + "-pr-" + (.number|tostring)). Tune maxResults and since to limit how many closed pull requests sync. See GitHub Ocean examples and Migrate from the GitHub app.
Deployment mapping from merged PRs (click to expand)
The deploymentStatus is hardcoded to Success and environment to Production in these examples. You can modify these values based on your requirements.
- kind: pull-request
  selector:
    query: .base.ref == "main" and .state == "closed" and .merged_at != null
    closedPullRequests: true
  port:
    entity:
      mappings:
        identifier: .head.repo.name + "-deploy-" + (.number | tostring)
        title: '"Merge: " + .title'
        blueprint: '"deployment"'
        properties:
          environment: '"Production"'
          deploymentStatus: '"Success"'
          createdAt: .merged_at
        relations:
          service: .head.repo.name
          github_pull_request: .head.repo.name + "-pr-" + (.number | tostring)
GitHub (Sunset) is in sunset and will be fully deprecated on September 15, 2026. Use the GitHub ocean integration instead.
You must set closedPullRequests: true so merged pull requests sync; otherwise the app ingests open pull requests only. See Fetch closed pull requests.
Set up GitHub deployment service relations
The service relation on deployment entities is set in two ways:
- At ingest: the mapping sets
servicedirectly using.head.repo.name, matching the service identifier by repository name. - Via automation: the
set_github_deployment_relationsautomation fires whenever a service'sgithub_repositoryrelation changes and bulk-updates all deployment entities wheregithub_pull_requestis not null andgithub_repo_idmatches the new repository identifier.
github_repository relation on serviceThis automation requires the service blueprint to have a github_repository relation pointing to githubRepository. This relation is set up by the Create foundational Engineering Intelligence data model guide.
- Go to the automations page.
- Click + Automation.
- Click the
{...} Edit JSONbutton. - Paste the following JSON and click Save:
Set GitHub Deployment relations automation (click to expand)
{
  "identifier": "set_github_deployment_relations",
  "title": "Set GitHub Deployment relations",
  "trigger": {
    "type": "automation",
    "event": {"type": "ANY_ENTITY_CHANGE", "blueprintIdentifier": "service"},
    "condition": {
      "type": "JQ",
      "expressions": [
        ".diff.before.relations.github_repository != .diff.after.relations.github_repository",
        ".diff.after.relations.github_repository != null"
      ],
      "combinator": "and"
    }
  },
  "invocationMethod": {
    "type": "WEBHOOK",
    "url": "https://api.port.io/v1/migrations",
    "agent": false,
    "synchronized": true,
    "method": "POST",
    "headers": {"Content-Type": "application/json", "RUN_ID": "{{ .run.id }}"},
    "body": {
      "sourceBlueprint": "deployment",
      "mapping": {
        "blueprint": "deployment",
        "filter": ".relations.github_pull_request != null and .properties.github_repo_id == \"{{ .event.diff.after.relations.github_repository }}\"",
        "entity": {
          "identifier": ".identifier",
          "relations": {"service": "\"{{ .event.context.entityIdentifier }}\""}
        }
      }
    }
  }
}
Deployment mapping from merged MRs (click to expand)
The deploymentStatus is hardcoded to Success and environment to Production in these examples. You can modify these values based on your requirements.
- kind: merge-request
  selector:
    query: .target_branch == "main" and .state == "merged"
  port:
    entity:
      mappings:
        identifier: (.references.full | gsub("!"; "-mr-") | gsub("/"; "-"))
        title: '"Deploy: " + .title'
        blueprint: '"deployment"'
        properties:
          environment: '"Production"'
          deploymentStatus: '"Success"'
          createdAt: .merged_at
        relations:
          service: .references.full | gsub("!.+"; "")
          gitlab_merge_request: .id | tostring
The mapping uses gitlab_merge_request as the relation key, matching the relation identifier defined in the deployment blueprint above.
Set up GitLab deployment service relations
The service relation on deployment entities is set in the integration mapping above. The following automation keeps these relations in sync whenever a service's linked GitLab repository changes - it bulk-updates all deployment entities whose gitlab_repo_id matches the new repository value.
gitlab_repository relation on serviceThis automation requires the service blueprint to have a gitlab_repository relation pointing to gitlabRepository. This relation is set up by the Create foundational Engineering Intelligence data model guide.
- Go to the automations page.
- Click + Automation.
- Click the
{...} Edit JSONbutton. - Paste the following JSON and click Save:
Set GitLab Deployment relations automation (click to expand)
{
  "identifier": "set_gitlab_deployment_relations",
  "title": "Set GitLab Deployment relations",
  "trigger": {
    "type": "automation",
    "event": {"type": "ANY_ENTITY_CHANGE", "blueprintIdentifier": "service"},
    "condition": {
      "type": "JQ",
      "expressions": [
        ".diff.before.relations.gitlab_repository != .diff.after.relations.gitlab_repository",
        ".diff.after.relations.gitlab_repository != null"
      ],
      "combinator": "and"
    }
  },
  "invocationMethod": {
    "type": "WEBHOOK",
    "url": "https://api.port.io/v1/migrations",
    "agent": false,
    "synchronized": true,
    "method": "POST",
    "headers": {"Content-Type": "application/json", "RUN_ID": "{{ .run.id }}"},
    "body": {
      "sourceBlueprint": "deployment",
      "mapping": {
        "blueprint": "deployment",
        "filter": ".relations.gitlab_merge_request != null and .properties.gitlab_repo_id == \"{{ .event.diff.after.relations.gitlab_repository }}\"",
        "entity": {
          "identifier": ".identifier",
          "relations": {"service": "\"{{ .event.context.entityIdentifier }}\""}
        }
      }
    }
  }
}
gitlab_repo_id mirrorProperty dependencygitlab_repo_id is populated via a mirrorProperty from the linked gitlab_merge_request.repository.$identifier. The automation filter .properties.gitlab_repo_id will not match for deployment entities where the gitlab_merge_request relation is not yet set. Deployments without a linked MR will not have their service relation updated by this automation.
Deployment mapping from merged PRs (click to expand)
The deploymentStatus is hardcoded to Success and environment to Production in these examples. You can modify these values based on your requirements.
- kind: pull-request
  selector:
    query: .status == "completed"
    minTimeInDays: 90
  port:
    entity:
      mappings:
        identifier: (.repository.id + "/" + (.pullRequestId | tostring) + "/deploy") | gsub(" "; "")
        title: '"Merge: " + .title'
        blueprint: '"deployment"'
        properties:
          environment: '"Production"'
          deploymentStatus: '"Success"'
          createdAt: .closedDate
        relations:
          ado_pull_request: .repository.id + "/" + (.pullRequestId | tostring)
          service:
            combinator: '"and"'
            rules:
              - property: '"ado_repository_id"'
                operator: '"="'
                value: .repository.id
Set up Azure DevOps deployment service relations
The service relation on deployment entities is set in two ways:
- At ingest: the mapping sets
servicevia a search query onado_repository_id, matching the service with the corresponding Azure DevOps repository. - Via automation: the
set_ado_deployment_relationsautomation fires whenever a service'sazureDevopsRepositoryrelation changes and bulk-updates all deployment entities whereado_pull_requestis not null andado_repo_idmatches the new repository identifier.
azureDevopsRepository relation on serviceThis automation requires the service blueprint to have an azureDevopsRepository relation pointing to azureDevopsRepository. This relation is set up by the Create foundational Engineering Intelligence data model guide.
- Go to the automations page.
- Click + Automation.
- Click the
{...} Edit JSONbutton. - Paste the following JSON and click Save:
Set Azure DevOps Deployment relations automation (click to expand)
{
  "identifier": "set_ado_deployment_relations",
  "title": "Set Azure Devops Deployment relations",
  "trigger": {
    "type": "automation",
    "event": {"type": "ANY_ENTITY_CHANGE", "blueprintIdentifier": "service"},
    "condition": {
      "type": "JQ",
      "expressions": [
        ".diff.before.relations.azureDevopsRepository != .diff.after.relations.azureDevopsRepository",
        ".diff.after.relations.azureDevopsRepository != null"
      ],
      "combinator": "and"
    }
  },
  "invocationMethod": {
    "type": "WEBHOOK",
    "url": "https://api.port.io/v1/migrations",
    "agent": false,
    "synchronized": true,
    "method": "POST",
    "headers": {"Content-Type": "application/json", "RUN_ID": "{{ .run.id }}"},
    "body": {
      "sourceBlueprint": "deployment",
      "mapping": {
        "blueprint": "deployment",
        "filter": ".relations.ado_pull_request != null and .properties.ado_repo_id == \"{{ .event.diff.after.relations.azureDevopsRepository }}\"",
        "entity": {
          "identifier": ".identifier",
          "relations": {"service": "\"{{ .event.context.entityIdentifier }}\""}
        }
      }
    }
  }
}
The mappings above filter for PRs merged to the main branch. If your repositories use a different default branch (e.g., master), update the filter accordingly.
- Click Save & Resync.
After resync, navigate to the Deployments catalog page in your portal. You should see deployment entities appearing for each merged PR, linked to the corresponding service and pull request.
Alternative deployment tracking strategies
If PR/MR merges don't fit your workflow, Port supports several other deployment tracking methods.
Other deployment tracking strategies (click to expand)
Workflow/Job runs
Track deployments by monitoring workflow runs in your pipeline. The deployment status is set dynamically based on whether the workflow concluded successfully or failed.
- GitHub
- GitLab
- kind: workflow-run
  selector:
    query: >
      (.head_branch == "main") and
      (.name | test("deploy|CD"; "i"))
  port:
    entity:
      mappings:
        identifier: .head_repository.name + "-deploy-" + (.run_number | tostring)
        title: .head_repository.name + " Deployment via workflow"
        blueprint: '"deployment"'
        properties:
          environment: '"Production"'
          createdAt: .created_at
          deploymentStatus: (.conclusion | ascii_upcase[0:1] + .[1:])
        relations:
          service: .head_repository.name
- kind: pipeline
  selector:
    query: '(.ref == "main") and (.name | test("deploy|CD"; "i"))'
  port:
    entity:
      mappings:
        identifier: '"deployment-" + (.id | tostring)'
        title: .project.name + " Deployment via pipeline"
        blueprint: '"deployment"'
        properties:
          environment: '"Production"'
          createdAt: .created_at
          deploymentStatus: (.status | ascii_upcase[0:1] + .[1:])
        relations:
          service: .__project.path_with_namespace | gsub(" "; "")
CI/CD pipelines (Jenkins, CircleCI, Azure Pipelines, etc.)
CI/CD pipelines can report deployments to Port using Port's API as part of the pipeline execution. See the relevant guide for your CI/CD tool:
These integrations use search relations to map the deployment to the correct service based on the service's $title. See mapping relations using search queries for more details.
Releases/Tags (GitHub only)
- kind: release
  selector:
    query: (.target_commitish == "main") and (.name | test("Production"; "i"))
  port:
    entity:
      mappings:
        identifier: .release.name + "-" + .release.tag_name
        title: .release.name + " Deployment on release"
        blueprint: '"deployment"'
        properties:
          environment: '"Production"'
          createdAt: .release.created_at
          deploymentStatus: '"Success"'
        relations:
          service: .repo.name
Find more details about setting up GitHub integrations for releases and tags in Repositories, repository releases and tags.
Custom API
If your tool or workflow is not natively supported, you can create deployment entities directly via Port's API:
curl -X POST https://api.port.io/v1/blueprints/deployment/entities?upsert=true&merge=true \
-H "Authorization: Bearer $YOUR_PORT_API_TOKEN" \
-H "Content-Type: application/json" \
-d '{
  "identifier": "custom-deployment-1234",
  "title": "Custom Deployment 1234",
  "properties": {
    "environment": "Production",
    "createdAt": "2024-09-01T12:00:00Z",
    "deploymentStatus": "Success"
  },
  "relations": {
    "service": "your-service-identifier"
  }
}'
Replace $YOUR_PORT_API_TOKEN with your actual API token. See mapping relations using search queries for details.
Tracking incidents
Incidents are essential for tracking change failure rate (CFR) and mean time to recovery (MTTR). Effective incident tracking reveals how frequently deployments fail and how quickly teams resolve issues.
The steps below use PagerDuty as the example incident integration. If you use a different tool (OpsGenie, FireHydrant, ServiceNow, etc.), adapt the blueprint identifier (e.g., replace pagerdutyIncident with your incident blueprint) and property names accordingly.
Set up data model
Ensure that your PagerDuty incident blueprint is properly configured to map incidents to the correct services. Use the PagerDuty incident blueprint in the integration examples, and the default mapping configuration on the main PagerDuty page, as references when aligning your data model.
Add incident resolution time and recovery time properties:
-
Navigate to your Port Builder page.
-
Select the PagerDuty Incident blueprint.
-
Click on the
{...}button in the top right corner, and choose Edit JSON. -
Add the following properties:
Additional PagerDuty incident properties (click to expand)
"resolvedAt": {"title": "Incident Resolution Time","type": "string","format": "date-time","description": "The timestamp when the incident was resolved"},"recoveryTime": {"title": "Time to Recovery","type": "number","description": "The time (in minutes) between the incident being triggered and resolved"} -
Click Save.
Add incident mapping config:
-
Navigate to your Port Data Sources page.
-
Select the PagerDuty data source.
-
Add the following property mappings to the incident mapping section:
Incident mapping for resolvedAt and recoveryTime (click to expand)
resolvedAt: .resolved_atrecoveryTime: >-(.created_at as $createdAt | .resolved_at as $resolvedAt |if $resolvedAt == null then null else( ($resolvedAt | strptime("%Y-%m-%dT%H:%M:%SZ") | mktime) -($createdAt | strptime("%Y-%m-%dT%H:%M:%SZ") | mktime) ) / 60 end) -
Click Save & Resync.
Syncing incidents
To sync incidents from PagerDuty, follow the PagerDuty guide. For other tools:
The relation between the PagerDuty incident blueprint and the service blueprint is automatically created when you install the PagerDuty integration.
After resync, navigate to the PagerDuty Incidents catalog page in your portal. You should see incident entities appearing with resolvedAt and recoveryTime properties populated for resolved incidents, and each incident linked to the corresponding service.
Set up metrics
Now we'll add aggregation and calculation properties to compute DORA metrics and classify services and teams into performance tiers.
For each metric below, you will add properties to both the Service and Team blueprints. To edit a blueprint's JSON:
Team-level aggregation properties scope data to each team's services. For Azure DevOps, azureDevopsPullRequest and azureDevopsBuild entities have inherited team ownership through their service relation, so no explicit pathFilter is needed. For GitHub PR aggregations, use pathFilter: [{fromBlueprint: "githubPullRequest", path: ["service", "_team"]}]. For GitLab MR aggregations, use pathFilter: [{fromBlueprint: "gitlabMergeRequest", path: ["service", "_team"]}]. Deployment aggregations work without a pathFilter for all providers.
-
Go to the Builder in your Port portal.
-
Click on the blueprint you want to edit (Service or Team).
-
Click on the
{...}button in the top right corner, and choose Edit JSON. -
Add the properties shown below to the
"aggregationProperties"and"calculationProperties"sections. -
Click Save.
Aggregation properties are calculated based on data ingested after the property is created. Historical data that was ingested before you add these properties will not be included. To backfill, trigger a resync on the relevant integration after saving the aggregation properties. See aggregation properties for more details.
Deployment frequency
Deployment frequency measures how often your services deploy to production. It is calculated as the average number of successful production deployments per week. The tier calculation classifies services as Elite (≥7/week), High (≥1/week), Medium (≥0.25/week), or Low.
Service level
Add the following to the Service blueprint:
Aggregation properties (click to expand)
Add to "aggregationProperties":
"total_deployments": {
  "title": "Total Deployments",
  "type": "number",
  "target": "deployment",
  "description": "Total successful deployments to Production",
  "query": {
    "combinator": "and",
    "rules": [
      { "property": "deploymentStatus", "operator": "=", "value": "Success" },
      { "property": "environment", "operator": "=", "value": "Production" }
    ]
  },
  "calculationSpec": { "func": "count", "calculationBy": "entities" },
  "pathFilter": [{ "fromBlueprint": "deployment", "path": ["service"] }]
},
"deployment_frequency": {
  "title": "Deployment Frequency (per week)",
  "type": "number",
  "target": "deployment",
  "description": "Average successful Production deployments per week",
  "query": {
    "combinator": "and",
    "rules": [
      { "property": "deploymentStatus", "operator": "=", "value": "Success" },
      { "property": "environment", "operator": "=", "value": "Production" }
    ]
  },
  "calculationSpec": {
    "func": "average",
    "averageOf": "week",
    "calculationBy": "entities",
    "measureTimeBy": "createdAt"
  },
  "pathFilter": [{ "fromBlueprint": "deployment", "path": ["service"] }]
}
Tier calculation property (click to expand)
Add to "calculationProperties":
"deploy_freq_tier": {
  "title": "Deployment Frequency",
  "description": "DORA deployment frequency tier",
  "type": "string",
  "colorized": true,
  "colors": {
    "Low": "red",
    "Medium": "orange",
    "High": "blue",
    "Elite": "lime"
  },
  "calculation": "if (.properties.total_deployments == null or .properties.total_deployments == 0) then \"Low\" else if (.properties.deployment_frequency // 0) >= 7 then \"Elite\" elif (.properties.deployment_frequency // 0) >= 1 then \"High\" elif (.properties.deployment_frequency // 0) >= 0.25 then \"Medium\" else \"Low\" end end"
}
Team level
Add the following to the Team blueprint. The team-level deployment frequency tier divides total deployment frequency by the number of services owned by the team, ensuring a fair cross-team comparison.
Select your Git provider. For deployment aggregations, all three providers use Port's native team ownership - no pathFilter is required:
- GitHub
- GitLab
- Azure DevOps
Aggregation properties (click to expand)
Add to "aggregationProperties":
"services_count": {
  "title": "Services Count",
  "type": "number",
  "target": "service",
  "calculationSpec": { "func": "count", "calculationBy": "entities" }
},
"total_deployments": {
  "title": "Total Deployments",
  "type": "number",
  "target": "deployment",
  "description": "Total successful deployments across team services",
  "query": {
    "combinator": "and",
    "rules": [
      { "property": "deploymentStatus", "operator": "=", "value": "Success" },
      { "property": "environment", "operator": "=", "value": "Production" }
    ]
  },
  "calculationSpec": { "func": "count", "calculationBy": "entities" }
},
"deployment_frequency": {
  "title": "Deployment Frequency (per week)",
  "type": "number",
  "target": "deployment",
  "description": "Average weekly deployments across team services",
  "query": {
    "combinator": "and",
    "rules": [
      { "property": "deploymentStatus", "operator": "=", "value": "Success" },
      { "property": "environment", "operator": "=", "value": "Production" }
    ]
  },
  "calculationSpec": {
    "func": "average",
    "averageOf": "week",
    "calculationBy": "entities",
    "measureTimeBy": "createdAt"
  }
}
For the _team blueprint, no pathFilter is required. Port's native team ownership automatically scopes aggregations to entities owned by each team, traversing through the service.$team ownership chain to reach deployments.
Aggregation properties (click to expand)
Add to "aggregationProperties":
"services_count": {
  "title": "Services Count",
  "type": "number",
  "target": "service",
  "calculationSpec": { "func": "count", "calculationBy": "entities" }
},
"total_deployments": {
  "title": "Total Deployments",
  "type": "number",
  "target": "deployment",
  "description": "Total successful deployments across team services",
  "query": {
    "combinator": "and",
    "rules": [
      { "property": "deploymentStatus", "operator": "=", "value": "Success" },
      { "property": "environment", "operator": "=", "value": "Production" }
    ]
  },
  "calculationSpec": { "func": "count", "calculationBy": "entities" }
},
"deployment_frequency": {
  "title": "Deployment Frequency (per week)",
  "type": "number",
  "target": "deployment",
  "description": "Average weekly deployments across team services",
  "query": {
    "combinator": "and",
    "rules": [
      { "property": "deploymentStatus", "operator": "=", "value": "Success" },
      { "property": "environment", "operator": "=", "value": "Production" }
    ]
  },
  "calculationSpec": {
    "func": "average",
    "averageOf": "week",
    "calculationBy": "entities",
    "measureTimeBy": "createdAt"
  }
}
Tier calculation properties (click to expand)
Add to "calculationProperties":
"deployment_frequency_per_service": {
  "title": "Deployment Frequency (per service)",
  "description": "Deployment frequency normalized by the number of services",
  "type": "number",
  "calculation": "if (.properties.services_count != null and .properties.services_count != 0) then ((.properties.deployment_frequency // 0) / .properties.services_count) else 0 end"
},
"deploy_freq_tier": {
  "title": "Deployment Frequency",
  "description": "DORA deployment frequency tier (per service)",
  "type": "string",
  "colorized": true,
  "colors": {
    "Low": "red",
    "Medium": "orange",
    "High": "blue",
    "Elite": "lime"
  },
  "calculation": "if (.properties.total_deployments == null or .properties.total_deployments == 0) then \"Low\" else (if (.properties.services_count != null and .properties.services_count != 0) then ((.properties.deployment_frequency // 0) / .properties.services_count) else 0 end) as $dpf | if $dpf >= 7 then \"Elite\" elif $dpf >= 1 then \"High\" elif $dpf >= 0.25 then \"Medium\" else \"Low\" end end"
}
What you should see: After saving both blueprints, open any service or team entity. You should see Total Deployments, Deployment Frequency (per week), and a Deployment Frequency tier badge (Elite/High/Medium/Low). Team entities also show Services Count and Deployment Frequency (per service).
Lead time for changes
Lead time for changes measures how quickly code moves from development into production. Port supports two approaches, you can choose the one that best fits your workflow:
- PR creation to merge
- First commit to merge
Lead time is measured from when a pull request is created to when it is merged, using the cycle_time_hours property that Port calculates automatically as part of your PR/MR mapping. No additional setup is required - the aggregation below reads this property directly.
Aggregation queries filter on blueprint properties in Port, not raw API field names. By default, the aggregation below includes merged PRs/MRs in the last 30 days. To scope by target branch, add a string property to your pull request blueprint (for example targetBranch) and map it from your Git provider (for example GitHub .base.ref, GitLab .target_branch, or Azure DevOps .targetRefName with refs/heads/ stripped). Then add a query rule such as "property": "targetBranch", "operator": "=", "value": "main".
Lead time is measured from the first commit on the PR branch to when the PR is merged into the default branch. This matches the strict DORA definition. Because the Git provider does not expose the first commit timestamp in the PR payload, Port uses an automation and a self-service action to enrich each merged PR:
- An automation fires every time a PR/MR transitions to a merged state and has no
firstCommitAtvalue yet. - The automation creates a run of the enrichment self-service action.
- The action's backend workflow calls the provider API to list the PR's commits, picks the earliest authored timestamp, computes hours between that timestamp and
mergedAt, and writes both values back to the PR entity in Port.
Once first_commit_to_merge_hours is populated on the PR entity, replace "property": "cycle_time_hours" with "property": "first_commit_to_merge_hours" in the aggregation configurations in the service and team level sections below.
Step 1: Add properties to your PR/MR blueprint
-
Navigate to the data model page.
-
Select your PR/MR blueprint.
-
Click the
...button and choose{...} Edit JSON. -
Add the following entries to
"properties":Properties (click to expand)
"firstCommitAt": {"title": "First Commit At","type": "string","format": "date-time","description": "Timestamp of the earliest commit on this PR's branch"},"first_commit_to_merge_hours": {"title": "First Commit to Merge (Hours)","type": "number","description": "Lead time in hours from the first commit to PR merge"},"prNumber": {"title": "PR Number","type": "number","description": "The pull request / merge request number, used to fetch commits via the provider API"} -
In your integration mapping, add a mapping for
prNumberso that each PR/MR entity gets this value:- GitHub -
prNumber: .number - GitLab -
prNumber: .iid - Azure DevOps -
prNumber: .pullRequestId
For Azure DevOps, also add a
mergedAtproperty to the blueprint and map it from.closedDate:"mergedAt": {"title": "Merged At","type": "string","format": "date-time","description": "Timestamp when the pull request was completed (merged)"}Then map it in your integration config:
mergedAt: if .status == "completed" then .closedDate else null end - GitHub -
-
Click Save.
Step 2: Create the enrichment workflow
In the repository where your self-service action will dispatch workflows, create the following file.
- github
- gitlab
- azure-devops
Create .github/workflows/enrich-pr-lead-time.yml:enrich-pr-lead-time.yml (click to expand)
Add PORT_CLIENT_ID, PORT_CLIENT_SECRET, and GH_PAT to Settings → Secrets and variables → Actions in the repository where this workflow lives.
GH_PAT must be a GitHub fine-grained personal access token (or a classic PAT with repo scope) that has read access to pull requests and contents for every repository whose PRs Port tracks. The built-in GITHUB_TOKEN is scoped to the workflow's own repository and will fail with a 403/404 when the PR belongs to a different repository.
Create a GitLab CI/CD file (for example .gitlab-ci.yml) in the project where the pipeline trigger token was created, and expose it via a GitLab pipeline trigger..gitlab-ci.yml (click to expand)
Add PORT_CLIENT_ID, PORT_CLIENT_SECRET, and GITLAB_TOKEN (a project access token with read_api scope) to GitLab → Settings → CI/CD → Variables. The entity data and run ID are sent in the request body by the self-service action and read from $TRIGGER_PAYLOAD inside the pipeline.
First, set up an incoming webhook service connection in your Azure DevOps project so Port can trigger the pipeline:
- In your Azure DevOps project, go to Project Settings → Service connections.
- Click Create service connection and choose Incoming WebHook.
- Fill in the fields:
- Webhook Name:
port_trigger - Service connection name:
port_trigger - Secret key: Your Port
clientSecret(found in Port → Settings → Credentials). - Headers:
x-port-signature
- Webhook Name:
- Check Grant access to all pipelines and click Save.
Then create an Azure Pipelines YAML file (for example pipelines/enrich-pr-lead-time.yml):enrich-pr-lead-time.yml (click to expand)
Add PORT_CLIENT_ID, PORT_CLIENT_SECRET, and ADO_TOKEN (a personal access token with Read scope on Code and Pull Request Threads) as pipeline variables in Azure DevOps → Pipelines → Edit → Variables. The webhook payload fields (entity_id, pr_number, merged_at, repository_id, run_id) are passed automatically by the self-service action via the incoming webhook and accessed using ${{ parameters.port_trigger.<key> }}.
Step 3: Create the self-service action
-
Go to the self-service page.
-
Click + New Action.
-
Click the
{...} Edit JSONbutton. -
Copy and paste the configuration for your Git provider:
- github
- gitlab
- azure-devops
- GitHub (Ocean)
- GitHub (Sunset)
Enrich PR lead time action - GitHub (Ocean) (click to expand)
Replace placeholdersReplace
<GITHUB-ORG>,<GITHUB-REPO-NAME>, and<YOUR_GITHUB_OCEAN_INTEGRATION_ID>with your values. The integration ID is shown on the data sources page.{"identifier": "enrich_pr_lead_time","title": "Enrich PR lead time","icon": "GitPullRequest","description": "Fetches the first commit timestamp for a merged PR and calculates lead time from first commit to merge.","trigger": {"type": "self-service","operation": "DAY-2","userInputs": {"properties": {},"required": [],"order": []},"blueprintIdentifier": "githubPullRequest"},"invocationMethod": {"type": "INTEGRATION_ACTION","installationId": "<YOUR_GITHUB_OCEAN_INTEGRATION_ID>","integrationActionType": "dispatch_workflow","integrationActionExecutionProperties": {"org": "<GITHUB-ORG>","repo": "<GITHUB-REPO-NAME>","workflow": "enrich-pr-lead-time.yml","workflowInputs": {"port_context": {"entity": "{{.entity}}","runId": "{{.run.id}}"}},"reportWorkflowStatus": true}},"requiredApproval": false}Enrich PR lead time action - GitHub (Sunset) (click to expand)
Replace placeholdersReplace
<GITHUB-ORG>and<GITHUB-REPO-NAME>with your values.{"identifier": "enrich_pr_lead_time","title": "Enrich PR lead time","icon": "GitPullRequest","description": "Fetches the first commit timestamp for a merged PR and calculates lead time from first commit to merge.","trigger": {"type": "self-service","operation": "DAY-2","userInputs": {"properties": {},"required": [],"order": []},"blueprintIdentifier": "githubPullRequest"},"invocationMethod": {"type": "GITHUB","org": "<GITHUB-ORG>","repo": "<GITHUB-REPO-NAME>","workflow": "enrich-pr-lead-time.yml","workflowInputs": {"port_context": {"entity": "{{.entity}}","runId": "{{.run.id}}"}},"reportWorkflowStatus": true},"requiredApproval": false}Enrich MR lead time action - GitLab (click to expand)
Replace placeholder and add secretReplace
<GITLAB-PROJECT-ID>with your GitLab project's numeric ID (found on the project page under ⋮ → Copy project ID). Then add a Port secret calledGITLAB_TRIGGER_TOKENwith the trigger token from GitLab → Settings → CI/CD → Pipeline trigger tokens.{"identifier": "enrich_mr_lead_time","title": "Enrich MR lead time","icon": "GitLab","description": "Fetches the first commit timestamp for a merged MR and calculates lead time from first commit to merge.","trigger": {"type": "self-service","operation": "DAY-2","userInputs": {"properties": {},"required": [],"order": []},"blueprintIdentifier": "gitlabMergeRequest"},"invocationMethod": {"type": "WEBHOOK","url": "https://gitlab.com/api/v4/projects/<GITLAB-PROJECT-ID>/ref/main/trigger/pipeline?token={{ .secrets.GITLAB_TRIGGER_TOKEN }}","agent": false,"synchronized": false,"method": "POST","headers": {"Content-Type": "application/json"},"body": {"port_context": {"entity": "{{ .entity }}","runId": "{{ .run.id }}"}}},"requiredApproval": false}Enrich PR lead time action - Azure DevOps (click to expand)
Replace placeholderReplace
<ADO-ORG>with your Azure DevOps organization name. The webhook nameport_triggermust match the service connection you created in Step 2.{"identifier": "enrich_pr_lead_time","title": "Enrich PR lead time","icon": "AzureDevops","description": "Fetches the first commit timestamp for a merged PR and calculates lead time from first commit to merge.","trigger": {"type": "self-service","operation": "DAY-2","userInputs": {"properties": {},"required": [],"order": []},"blueprintIdentifier": "azureDevopsPullRequest"},"invocationMethod": {"type": "WEBHOOK","url": "https://dev.azure.com/<ADO-ORG>/_apis/public/distributedtask/webhooks/port_trigger?api-version=6.0-preview","agent": false,"synchronized": false,"method": "POST","headers": {"Content-Type": "application/json"},"body": {"entity_id": "{{ .entity.identifier }}","pr_number": "{{ .entity.properties.prNumber }}","merged_at": "{{ .entity.properties.mergedAt }}","repository_id": "{{ .entity.relations.repository }}","run_id": "{{ .run.id }}"}},"requiredApproval": false} -
Click Save.
Step 4: Create the automation
This automation fires whenever a PR/MR transitions to merged in Port and does not yet have a firstCommitAt value, ensuring every new merge is enriched exactly once.
-
Go to the automations page.
-
Click + Automation.
-
Click the
{...} Edit JSONbutton. -
Copy and paste the configuration for your Git provider:
- github
- gitlab
- azure-devops
Enrich merged PR automation - GitHub (click to expand)
{"identifier": "enrich_merged_pr_lead_time","title": "Enrich merged PR with first-commit lead time","description": "Triggers the lead time enrichment action whenever a pull request is merged and has not yet been enriched.","icon": "GitPullRequest","trigger": {"type": "automation","event": {"type": "ENTITY_UPDATED","blueprintIdentifier": "githubPullRequest"},"condition": {"type": "JQ","expressions": [".diff.after.properties.mergedAt != null",".diff.before.properties.mergedAt == null",".diff.after.properties.firstCommitAt == null"],"combinator": "and"}},"invocationMethod": {"type": "WEBHOOK","url": "https://api.port.io/v1/actions/enrich_pr_lead_time/runs","agent": false,"synchronized": true,"method": "POST","headers": {"RUN_ID": "{{ .run.id }}","Content-Type": "application/json"},"body": {"entity": "{{ .event.diff.after.identifier }}","properties": {}}},"publish": true}Enrich merged MR automation - GitLab (click to expand)
{"identifier": "enrich_merged_mr_lead_time","title": "Enrich merged MR with first-commit lead time","description": "Triggers the lead time enrichment action whenever a merge request is merged and has not yet been enriched.","icon": "GitLab","trigger": {"type": "automation","event": {"type": "ENTITY_UPDATED","blueprintIdentifier": "gitlabMergeRequest"},"condition": {"type": "JQ","expressions": [".diff.after.properties.mergedAt != null",".diff.before.properties.mergedAt == null",".diff.after.properties.firstCommitAt == null"],"combinator": "and"}},"invocationMethod": {"type": "WEBHOOK","url": "https://api.port.io/v1/actions/enrich_mr_lead_time/runs","agent": false,"synchronized": true,"method": "POST","headers": {"RUN_ID": "{{ .run.id }}","Content-Type": "application/json"},"body": {"entity": "{{ .event.diff.after.identifier }}","properties": {}}},"publish": true}Enrich merged PR automation - Azure DevOps (click to expand)
{"identifier": "enrich_merged_pr_lead_time","title": "Enrich merged PR with first-commit lead time","description": "Triggers the lead time enrichment action whenever a pull request is completed and has not yet been enriched.","icon": "AzureDevops","trigger": {"type": "automation","event": {"type": "ENTITY_UPDATED","blueprintIdentifier": "azureDevopsPullRequest"},"condition": {"type": "JQ","expressions": [".diff.after.properties.status == \"completed\"",".diff.before.properties.status != \"completed\"",".diff.after.properties.firstCommitAt == null"],"combinator": "and"}},"invocationMethod": {"type": "WEBHOOK","url": "https://api.port.io/v1/actions/enrich_pr_lead_time/runs","agent": false,"synchronized": true,"method": "POST","headers": {"RUN_ID": "{{ .run.id }}","Content-Type": "application/json"},"body": {"entity": "{{ .event.diff.after.identifier }}","properties": {}}},"publish": true} -
Click Save.
The tier calculation classifies services as Elite (≤24h), High (≤168h / 1 week), Medium (≤720h / 30 days), or Low.
If you chose the first commit to merge method, replace "property": "cycle_time_hours" with "property": "first_commit_to_merge_hours" in each aggregation property below.
Service level
Add the following to the Service blueprint. Select your Git provider to get the correct target blueprint:
- GitHub
- GitLab
- Azure DevOps
Aggregation property (click to expand)
Add to "aggregationProperties":
"github_lead_time_for_change": {
  "title": "Lead Time for Changes (Hours)",
  "type": "number",
  "target": "githubPullRequest",
  "description": "Average time from PR creation to merge in the last 30 days",
  "query": {
    "combinator": "and",
    "rules": [
      { "property": "mergedAt", "operator": "between", "value": { "preset": "lastMonth" } }
    ]
  },
  "calculationSpec": {
    "func": "average",
    "averageOf": "total",
    "calculationBy": "property",
    "property": "cycle_time_hours",
    "measureTimeBy": "$createdAt"
  }
}
Aggregation property (click to expand)
Add to "aggregationProperties":
"gitlab_lead_time_for_change": {
  "title": "Lead Time for Changes (Hours)",
  "type": "number",
  "target": "gitlabMergeRequest",
  "description": "Average time from MR creation to merge in the last 30 days",
  "query": {
    "combinator": "and",
    "rules": [
      { "property": "mergedAt", "operator": "between", "value": { "preset": "lastMonth" } }
    ]
  },
  "calculationSpec": {
    "func": "average",
    "averageOf": "total",
    "calculationBy": "property",
    "property": "cycle_time_hours",
    "measureTimeBy": "$createdAt"
  }
}
Aggregation property (click to expand)
Add to "aggregationProperties":
"ado_lead_time_for_change": {
  "title": "Lead Time for Change (hours)",
  "type": "number",
  "target": "azureDevopsPullRequest",
  "description": "Average hours from PR creation to completion (last month)",
  "query": {
    "combinator": "and",
    "rules": [
      { "property": "status", "operator": "=", "value": "completed" },
      { "property": "$createdAt", "operator": "between", "value": { "preset": "lastMonth" } }
    ]
  },
  "calculationSpec": {
    "func": "average",
    "averageOf": "total",
    "calculationBy": "property",
    "property": "cycle_time_hours",
    "measureTimeBy": "$createdAt"
  },
  "pathFilter": [{ "fromBlueprint": "azureDevopsPullRequest", "path": ["service"] }]
}
- GitHub
- GitLab
- Azure DevOps
Tier calculation property (click to expand)
Add to "calculationProperties":
"github_lead_time_tier": {
  "title": "Lead Time for Changes",
  "description": "DORA lead time for changes tier",
  "type": "string",
  "colorized": true,
  "colors": {
    "Low": "red",
    "Medium": "orange",
    "High": "blue",
    "Elite": "lime"
  },
  "calculation": "if (.properties.github_lead_time_for_change == null) then \"Low\" elif .properties.github_lead_time_for_change <= 24 then \"Elite\" elif .properties.github_lead_time_for_change <= 168 then \"High\" elif .properties.github_lead_time_for_change <= 720 then \"Medium\" else \"Low\" end"
}
Tier calculation property (click to expand)
Add to "calculationProperties":
"gitlab_lead_time_tier": {
  "title": "Lead Time for Changes",
  "description": "DORA lead time for changes tier",
  "type": "string",
  "colorized": true,
  "colors": {
    "Low": "red",
    "Medium": "orange",
    "High": "blue",
    "Elite": "lime"
  },
  "calculation": "if (.properties.gitlab_lead_time_for_change == null) then \"Low\" elif .properties.gitlab_lead_time_for_change <= 24 then \"Elite\" elif .properties.gitlab_lead_time_for_change <= 168 then \"High\" elif .properties.gitlab_lead_time_for_change <= 720 then \"Medium\" else \"Low\" end"
}
Tier calculation property (click to expand)
Add to "calculationProperties":
"ado_lead_time_tier": {
  "title": "ADO Lead Time Tier",
  "description": "DORA lead time for changes tier",
  "type": "string",
  "colorized": true,
  "colors": {
    "Low": "red",
    "Medium": "orange",
    "High": "blue",
    "Elite": "lime"
  },
  "calculation": "if (.properties.ado_lead_time_for_change == null) then \"Low\" elif .properties.ado_lead_time_for_change <= 24 then \"Elite\" elif .properties.ado_lead_time_for_change <= 168 then \"High\" elif .properties.ado_lead_time_for_change <= 720 then \"Medium\" else \"Low\" end"
}
Team level
Add the following to the Team blueprint. Select your Git provider - both the target and fromBlueprint in pathFilter must match:
- GitHub
- GitLab
- Azure DevOps
Aggregation property (click to expand)
Add to "aggregationProperties":
"github_lead_time_for_change": {
  "title": "Lead Time for Changes (Hours)",
  "type": "number",
  "target": "githubPullRequest",
  "description": "Average lead time across team services in the last 30 days",
  "query": {
    "combinator": "and",
    "rules": [
      { "property": "mergedAt", "operator": "between", "value": { "preset": "lastMonth" } }
    ]
  },
  "calculationSpec": {
    "func": "average",
    "averageOf": "total",
    "calculationBy": "property",
    "property": "cycle_time_hours",
    "measureTimeBy": "$createdAt"
  },
  "pathFilter": [{ "fromBlueprint": "githubPullRequest", "path": ["service", "_team"] }]
}
Aggregation property (click to expand)
Add to "aggregationProperties":
"gitlab_lead_time_for_change": {
  "title": "Lead Time for Changes (Hours)",
  "type": "number",
  "target": "gitlabMergeRequest",
  "description": "Average lead time across team services in the last 30 days",
  "query": {
    "combinator": "and",
    "rules": [
      { "property": "mergedAt", "operator": "between", "value": { "preset": "lastMonth" } }
    ]
  },
  "calculationSpec": {
    "func": "average",
    "averageOf": "total",
    "calculationBy": "property",
    "property": "cycle_time_hours",
    "measureTimeBy": "$createdAt"
  },
  "pathFilter": [{ "fromBlueprint": "gitlabMergeRequest", "path": ["service", "_team"] }]
}
Aggregation property (click to expand)
Add to "aggregationProperties":
"ado_lead_time_for_change": {
  "title": "Lead Time for Changes (Hours)",
  "type": "number",
  "target": "azureDevopsPullRequest",
  "description": "Average hours from PR creation to completion in the last 30 days",
  "query": {
    "combinator": "and",
    "rules": [
      { "property": "status", "operator": "=", "value": "completed" },
      { "property": "$createdAt", "operator": "between", "value": { "preset": "lastMonth" } }
    ]
  },
  "calculationSpec": {
    "func": "average",
    "averageOf": "total",
    "calculationBy": "property",
    "property": "cycle_time_hours",
    "measureTimeBy": "$createdAt"
  }
}
- GitHub
- GitLab
- Azure DevOps
Tier calculation property (click to expand)
Add to "calculationProperties":
"github_lead_time_tier": {
  "title": "Lead Time for Changes",
  "description": "DORA lead time for changes tier",
  "type": "string",
  "colorized": true,
  "colors": {
    "Low": "red",
    "Medium": "orange",
    "High": "blue",
    "Elite": "lime"
  },
  "calculation": "if (.properties.github_lead_time_for_change == null) then \"Low\" elif .properties.github_lead_time_for_change <= 24 then \"Elite\" elif .properties.github_lead_time_for_change <= 168 then \"High\" elif .properties.github_lead_time_for_change <= 720 then \"Medium\" else \"Low\" end"
}
Tier calculation property (click to expand)
Add to "calculationProperties":
"gitlab_lead_time_tier": {
  "title": "Lead Time for Changes",
  "description": "DORA lead time for changes tier",
  "type": "string",
  "colorized": true,
  "colors": {
    "Low": "red",
    "Medium": "orange",
    "High": "blue",
    "Elite": "lime"
  },
  "calculation": "if (.properties.gitlab_lead_time_for_change == null) then \"Low\" elif .properties.gitlab_lead_time_for_change <= 24 then \"Elite\" elif .properties.gitlab_lead_time_for_change <= 168 then \"High\" elif .properties.gitlab_lead_time_for_change <= 720 then \"Medium\" else \"Low\" end"
}
Tier calculation property (click to expand)
Add to "calculationProperties":
"ado_lead_time_tier": {
  "title": "ADO Lead Time Tier",
  "description": "DORA lead time for changes tier",
  "type": "string",
  "colorized": true,
  "colors": {
    "Low": "red",
    "Medium": "orange",
    "High": "blue",
    "Elite": "lime"
  },
  "calculation": "if (.properties.ado_lead_time_for_change == null) then \"Low\" elif .properties.ado_lead_time_for_change <= 24 then \"Elite\" elif .properties.ado_lead_time_for_change <= 168 then \"High\" elif .properties.ado_lead_time_for_change <= 720 then \"Medium\" else \"Low\" end"
}
What you should see: After saving both blueprints, service and team entities should display Lead Time for Changes (Hours) and a Lead Time for Changes tier badge.
Change failure rate (CFR)
Change failure rate requires an incident management integration with incident entities linked to services. The examples below use PagerDuty (pagerdutyIncident), you can adjust the blueprint identifier and property names if you use a different tool. See the Tracking incidents section above.
Change failure rate measures the percentage of deployments that are associated with incidents. It is calculated as incidents / (deployments + incidents) × 100. The tier calculation classifies services as Elite (≤5%), High (≤20%), Medium (≤30%), or Low.
The standard DORA definition of CFR is failed deployments / total deployments. Since most incident tools don't directly link incidents to specific deployments, this guide uses incident count as a proxy for failed deployments. This is a common and practical adaptation and if your workflow allows you to mark deployments as failed directly (e.g., via a deploymentStatus of Failed), you can adjust the formula accordingly.
Service level
Add the following to the Service blueprint:
Aggregation property (click to expand)
Add to "aggregationProperties":
"total_incidents": {
  "title": "Total Incidents",
  "type": "number",
  "target": "pagerdutyIncident",
  "description": "Total incidents linked to this service",
  "calculationSpec": {
    "func": "count",
    "calculationBy": "entities"
  },
  "pathFilter": [
    {
      "fromBlueprint": "pagerdutyIncident",
      "path": ["service"]
    }
  ]
}
Tier calculation property (click to expand)
Add to "calculationProperties":
"change_failure_rate": {
  "title": "Change Failure Rate (%)",
  "description": "Percentage of deployments that caused incidents",
  "type": "number",
  "calculation": "if (.properties.total_deployments == null or .properties.total_deployments == 0) then null else ((.properties.total_incidents // 0) / (.properties.total_deployments + (.properties.total_incidents // 0)) * 100 | floor) end"
},
"cfr_tier": {
  "title": "CFR",
  "description": "DORA change failure rate tier",
  "type": "string",
  "colorized": true,
  "colors": {
    "Low": "red",
    "Medium": "orange",
    "High": "blue",
    "Elite": "lime"
  },
  "calculation": "if (.properties.change_failure_rate == null) then null else (if .properties.change_failure_rate <= 5 then \"Elite\" elif .properties.change_failure_rate <= 20 then \"High\" elif .properties.change_failure_rate <= 30 then \"Medium\" else \"Low\" end) end"
}
Team level
Add the following to the Team blueprint:
Aggregation property (click to expand)
Add to "aggregationProperties":
"total_incidents": {
  "title": "Total Incidents",
  "type": "number",
  "target": "pagerdutyIncident",
  "description": "Total incidents across team services",
  "calculationSpec": {
    "func": "count",
    "calculationBy": "entities"
  }
}
For GitLab, add a pathFilter to scope the aggregation to the explicit team relation: "pathFilter": [{"fromBlueprint": "pagerdutyIncident", "path": ["service", "team"]}]. GitHub and Azure DevOps use Port's native team ownership, so no pathFilter is needed.
Tier calculation properties (click to expand)
Add to "calculationProperties":
"change_failure_rate": {
  "title": "Change Failure Rate (%)",
  "description": "Percentage of deployments that caused incidents",
  "type": "number",
  "calculation": "if (.properties.total_deployments == null or .properties.total_deployments == 0) then null else ((.properties.total_incidents // 0) / (.properties.total_deployments + (.properties.total_incidents // 0)) * 100 | floor) end"
},
"cfr_tier": {
  "title": "CFR",
  "description": "DORA change failure rate tier",
  "type": "string",
  "colorized": true,
  "colors": {
    "Low": "red",
    "Medium": "orange",
    "High": "blue",
    "Elite": "lime"
  },
  "calculation": "if (.properties.change_failure_rate == null) then null else (if .properties.change_failure_rate <= 5 then \"Elite\" elif .properties.change_failure_rate <= 20 then \"High\" elif .properties.change_failure_rate <= 30 then \"Medium\" else \"Low\" end) end"
}
What you should see: After saving both blueprints, service entities show Total Incidents and a CFR tier badge. Team entities additionally show a Change Failure Rate (%) value.
Mean time to recovery (MTTR)
MTTR measures the average time from incident trigger to resolution, reflecting how quickly teams recover from failures. The tier calculation classifies services as Elite (≤60min), High (≤1,440min / 1 day), Medium (≤43,200min / 30 days), or Low.
MTTR requires an incident management integration with incident entities that include a recovery time property. The examples below use PagerDuty (pagerdutyIncident with recoveryTime), you can adjust the blueprint identifier and property names if you use a different tool. See the Tracking incidents section above.
Service level
Add the following to the Service blueprint:
Aggregation property (click to expand)
Add to "aggregationProperties":
"mean_time_to_recovery": {
  "title": "MTTR (Minutes)",
  "type": "number",
  "target": "pagerdutyIncident",
  "description": "Average time in minutes from incident trigger to resolution",
  "calculationSpec": {
    "func": "average",
    "averageOf": "total",
    "calculationBy": "property",
    "property": "recoveryTime",
    "measureTimeBy": "$createdAt"
  },
  "pathFilter": [
    {
      "fromBlueprint": "pagerdutyIncident",
      "path": ["service"]
    }
  ]
}
Tier calculation property (click to expand)
Add to "calculationProperties":
"mttr_tier": {
  "title": "MTTR",
  "description": "DORA MTTR tier",
  "type": "string",
  "colorized": true,
  "colors": {
    "Low": "red",
    "Medium": "orange",
    "High": "blue",
    "Elite": "lime"
  },
  "calculation": "if (.properties.total_incidents == null or .properties.total_incidents == 0) then null elif (.properties.mean_time_to_recovery == null) then \"Elite\" elif .properties.mean_time_to_recovery <= 60 then \"Elite\" elif .properties.mean_time_to_recovery <= 1440 then \"High\" elif .properties.mean_time_to_recovery <= 43200 then \"Medium\" else \"Low\" end"
}
Team level
Add the following to the Team blueprint:
Aggregation property (click to expand)
Add to "aggregationProperties":
"mean_time_to_recovery": {
  "title": "MTTR (Minutes)",
  "type": "number",
  "target": "pagerdutyIncident",
  "description": "Average recovery time across team services",
  "calculationSpec": {
    "func": "average",
    "averageOf": "total",
    "calculationBy": "property",
    "property": "recoveryTime",
    "measureTimeBy": "$createdAt"
  }
}
For GitLab, add a pathFilter to scope the aggregation to the explicit team relation: "pathFilter": [{"fromBlueprint": "pagerdutyIncident", "path": ["service", "team"]}]. GitHub and Azure DevOps use Port's native team ownership, so no pathFilter is needed.
Tier calculation property (click to expand)
Add to "calculationProperties":
"mttr_tier": {
  "title": "MTTR",
  "description": "DORA MTTR tier",
  "type": "string",
  "colorized": true,
  "colors": {
    "Low": "red",
    "Medium": "orange",
    "High": "blue",
    "Elite": "lime"
  },
  "calculation": "if (.properties.total_incidents == null or .properties.total_incidents == 0) then null elif (.properties.mean_time_to_recovery == null) then \"Elite\" elif .properties.mean_time_to_recovery <= 60 then \"Elite\" elif .properties.mean_time_to_recovery <= 1440 then \"High\" elif .properties.mean_time_to_recovery <= 43200 then \"Medium\" else \"Low\" end"
}
What you should see: After saving both blueprints, service and team entities show MTTR (Minutes) and an MTTR tier badge.
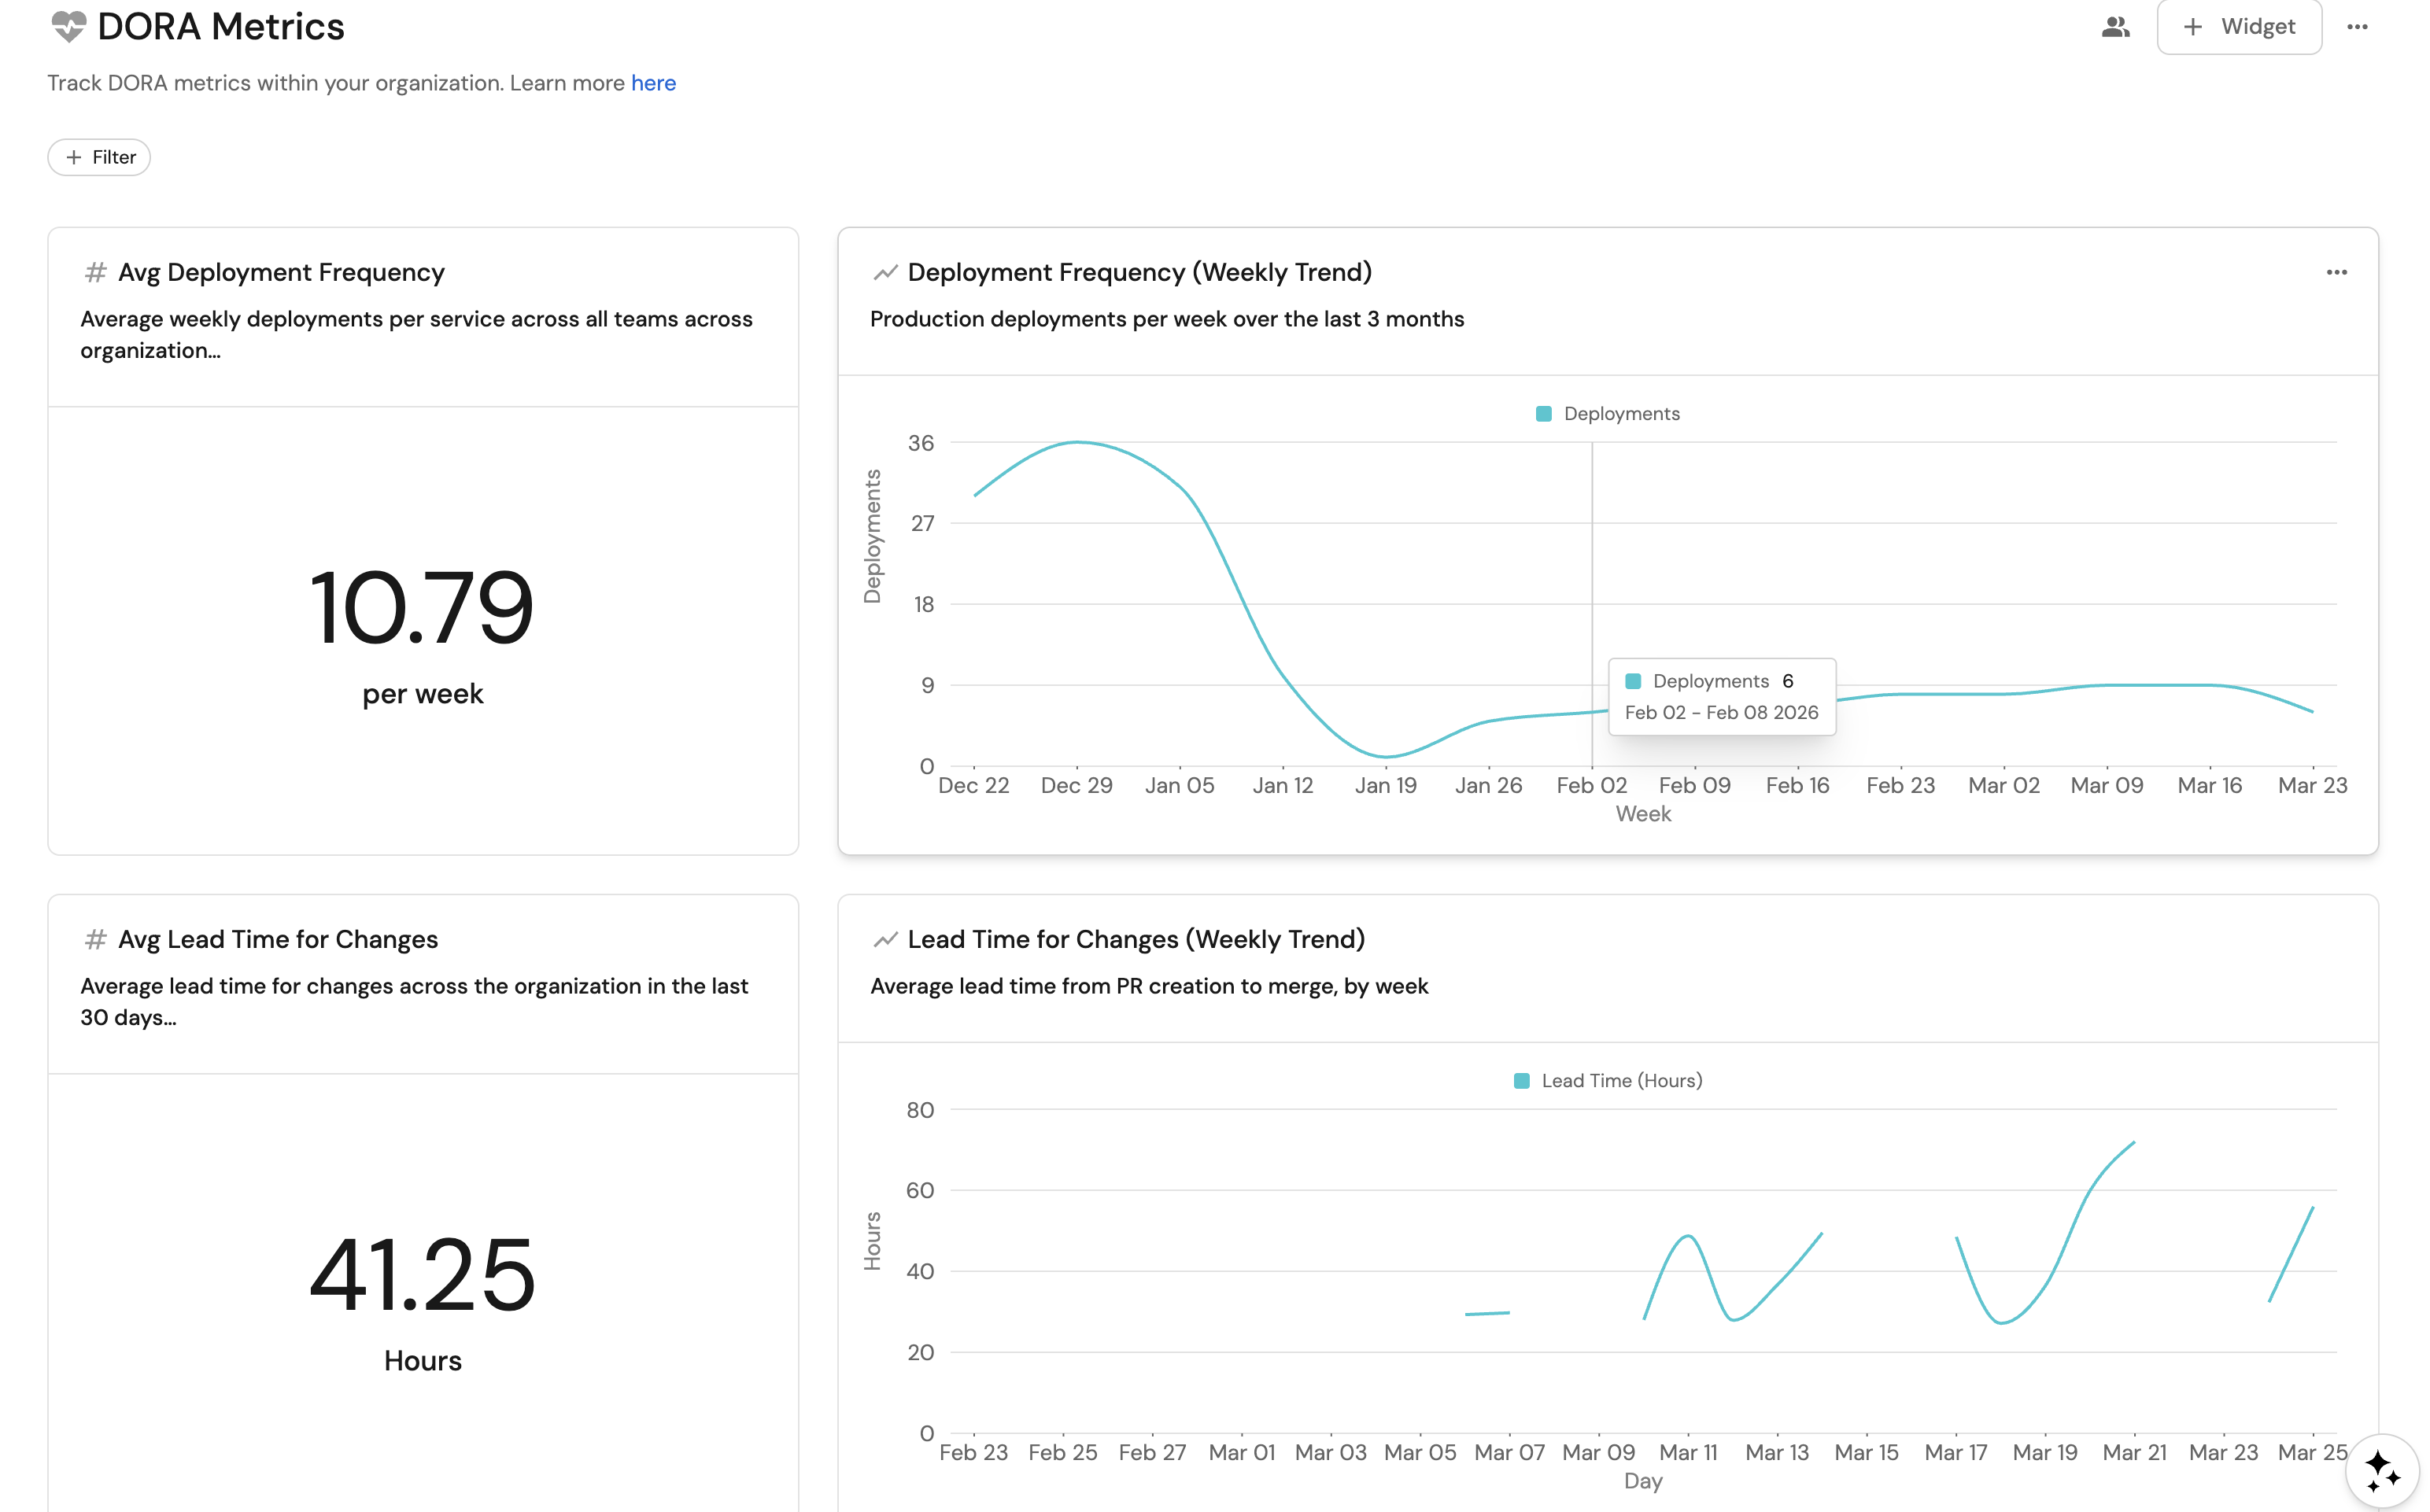
Visualize metrics
We will create a dedicated dashboard to monitor DORA metrics using Port's customizable widgets. The dashboard covers deployment frequency, lead time, and optionally change failure rate and MTTR.
Create the dashboard
- Navigate to your software catalog.
- Click on the
+button in the left sidebar. - Select New folder (if you don't already have one).
- Name the folder Engineering Intelligence and click Create. The folder identifier will be automatically set to
engineering_intelligence- this is required for the API script method to work. - Inside the Engineering Intelligence folder, click
+ Newagain. - Select New dashboard.
- Name the dashboard DORA Metrics and click Create.
Add widgets
You can populate the dashboard using either an API script or by manually creating each widget through the UI.
- API script
- Manual setup
The fastest way to set up the dashboard is by using Port's API to create all widgets at once.
Get your Port API token
-
In your Port portal, click on your profile picture in the top right corner.
-
Select Credentials.
-
Click Generate API token.
-
Copy the generated token and store it as an environment variable:
export PORT_ACCESS_TOKEN="YOUR_GENERATED_TOKEN"
If your portal is hosted in the EU region, replace api.port.io with api.port-eu.io in the dashboard creation command below.
Create the dashboard with widgets
The dashboard JSON below includes columns for both GitHub and GitLab in the service and team tables. The KPI and trend widgets use GitHub-specific property names - if you are using GitLab, replace github_lead_time_hours with gitlab_lead_time_for_change in those widgets. If you are using Azure DevOps, replace github_lead_time_hours with ado_lead_time_hours, github_lead_time_tier with ado_lead_time_tier, and github_lead_time_for_change with ado_lead_time_for_change in the KPI/trend widgets and table columns.
Save the following JSON to a file named dora_dashboard.json:Dashboard JSON payload (click to expand)
Then run the following command to create the dashboard with all widgets:
curl -s -X POST "https://api.port.io/v1/pages" \
  -H "Authorization: Bearer $PORT_ACCESS_TOKEN" \
  -H "Content-Type: application/json" \
  -d @dora_dashboard.json | python3 -m json.tool
The script assumes an engineering_intelligence folder already exists in your catalog. If you haven't created it yet, follow steps 1-4 in the create the dashboard section first.
Deployment frequency
Avg deployment frequency KPI (click to expand)
- Click
+ Widgetand select Number Chart. - Title:
Avg Deployment Frequency. - Description:
Average weekly deployments per service across all teams. - Select
Aggregate Property (All Entities)Chart type and choose Team as the Blueprint. - Select
Deployment Frequency (per service)as the Property. - Select
averagefor the Function. - Select
totalfor Average of. - Select
customas the Unit and inputper weekas the Custom unit. - Click Save.
Deployment frequency trend (click to expand)
-
Click
+ Widgetand select Line Chart. -
Title:
Number of Deployments per Day. Description:Number of deployments per day across the organization. -
Set X axis:
- Title:
Day. - Time interval:
Day. - Time range:
In the past 30 days.
- Title:
-
Set Y axis title:
Deployments. -
Click + Line and configure:
-
Title:
Successful deployments. -
Chart type:
Count entities. -
Blueprint:
Deployment. -
Function:
count. -
Measure time by:
createdAt. -
Add this JSON to the Additional filters editor:
{"combinator": "and","rules": [{"property": "deploymentStatus","operator": "=","value": "Success"},{"property": "environment","operator": "=","value": "Production"}]}
-
-
Click Save.
Lead time for changes
Avg lead time KPI (click to expand)
-
Click
+ Widgetand select Number Chart. -
Title:
Avg Lead Time for Changes (GitHub). -
Description:
Average lead time for changes across the organization in the last 30 days. -
Select
Aggregate Property (All Entities)Chart type and choose Deployment as the Blueprint. -
Select
GitHub Lead Time for Changes (Hours)(github_lead_time_hours) as the Property (this is the mirror property from the linked PR). -
Select
averagefor the Function. -
Select
totalfor Average of. -
Set Measure time by to
createdAt. -
Select
customas the Unit and inputHoursas the Custom unit. -
Add this JSON to the Additional filters editor:
{"combinator": "and","rules": [{"property": "deploymentStatus","operator": "=","value": "Success"},{"property": "environment","operator": "=","value": "Production"},{"property": "createdAt","operator": "between","value": {"preset": "lastMonth"}}]} -
Click Save.
Lead time trend (click to expand)
-
Click
+ Widgetand select Line Chart. -
Title:
Daily Mean Lead Time for Changes (GitHub). Description:Average lead time per day from linked GitHub pull requests for production deployments. -
Set X axis:
- Title:
Day. - Time interval:
Day. - Time range:
In the past 30 days.
- Title:
-
Set Y axis title:
Hours. -
Click + Line and configure:
-
Title:
Lead time. -
Chart type:
Aggregate property values. -
Blueprint:
Deployment. -
Function:
average. -
Property:
GitHub Lead Time for Changes (Hours)(github_lead_time_hours). -
Measure time by:
createdAt. -
Add this JSON to the Additional filters editor:
{"combinator": "and","rules": [{"property": "deploymentStatus","operator": "=","value": "Success"},{"property": "environment","operator": "=","value": "Production"}]}
-
-
Click Save.
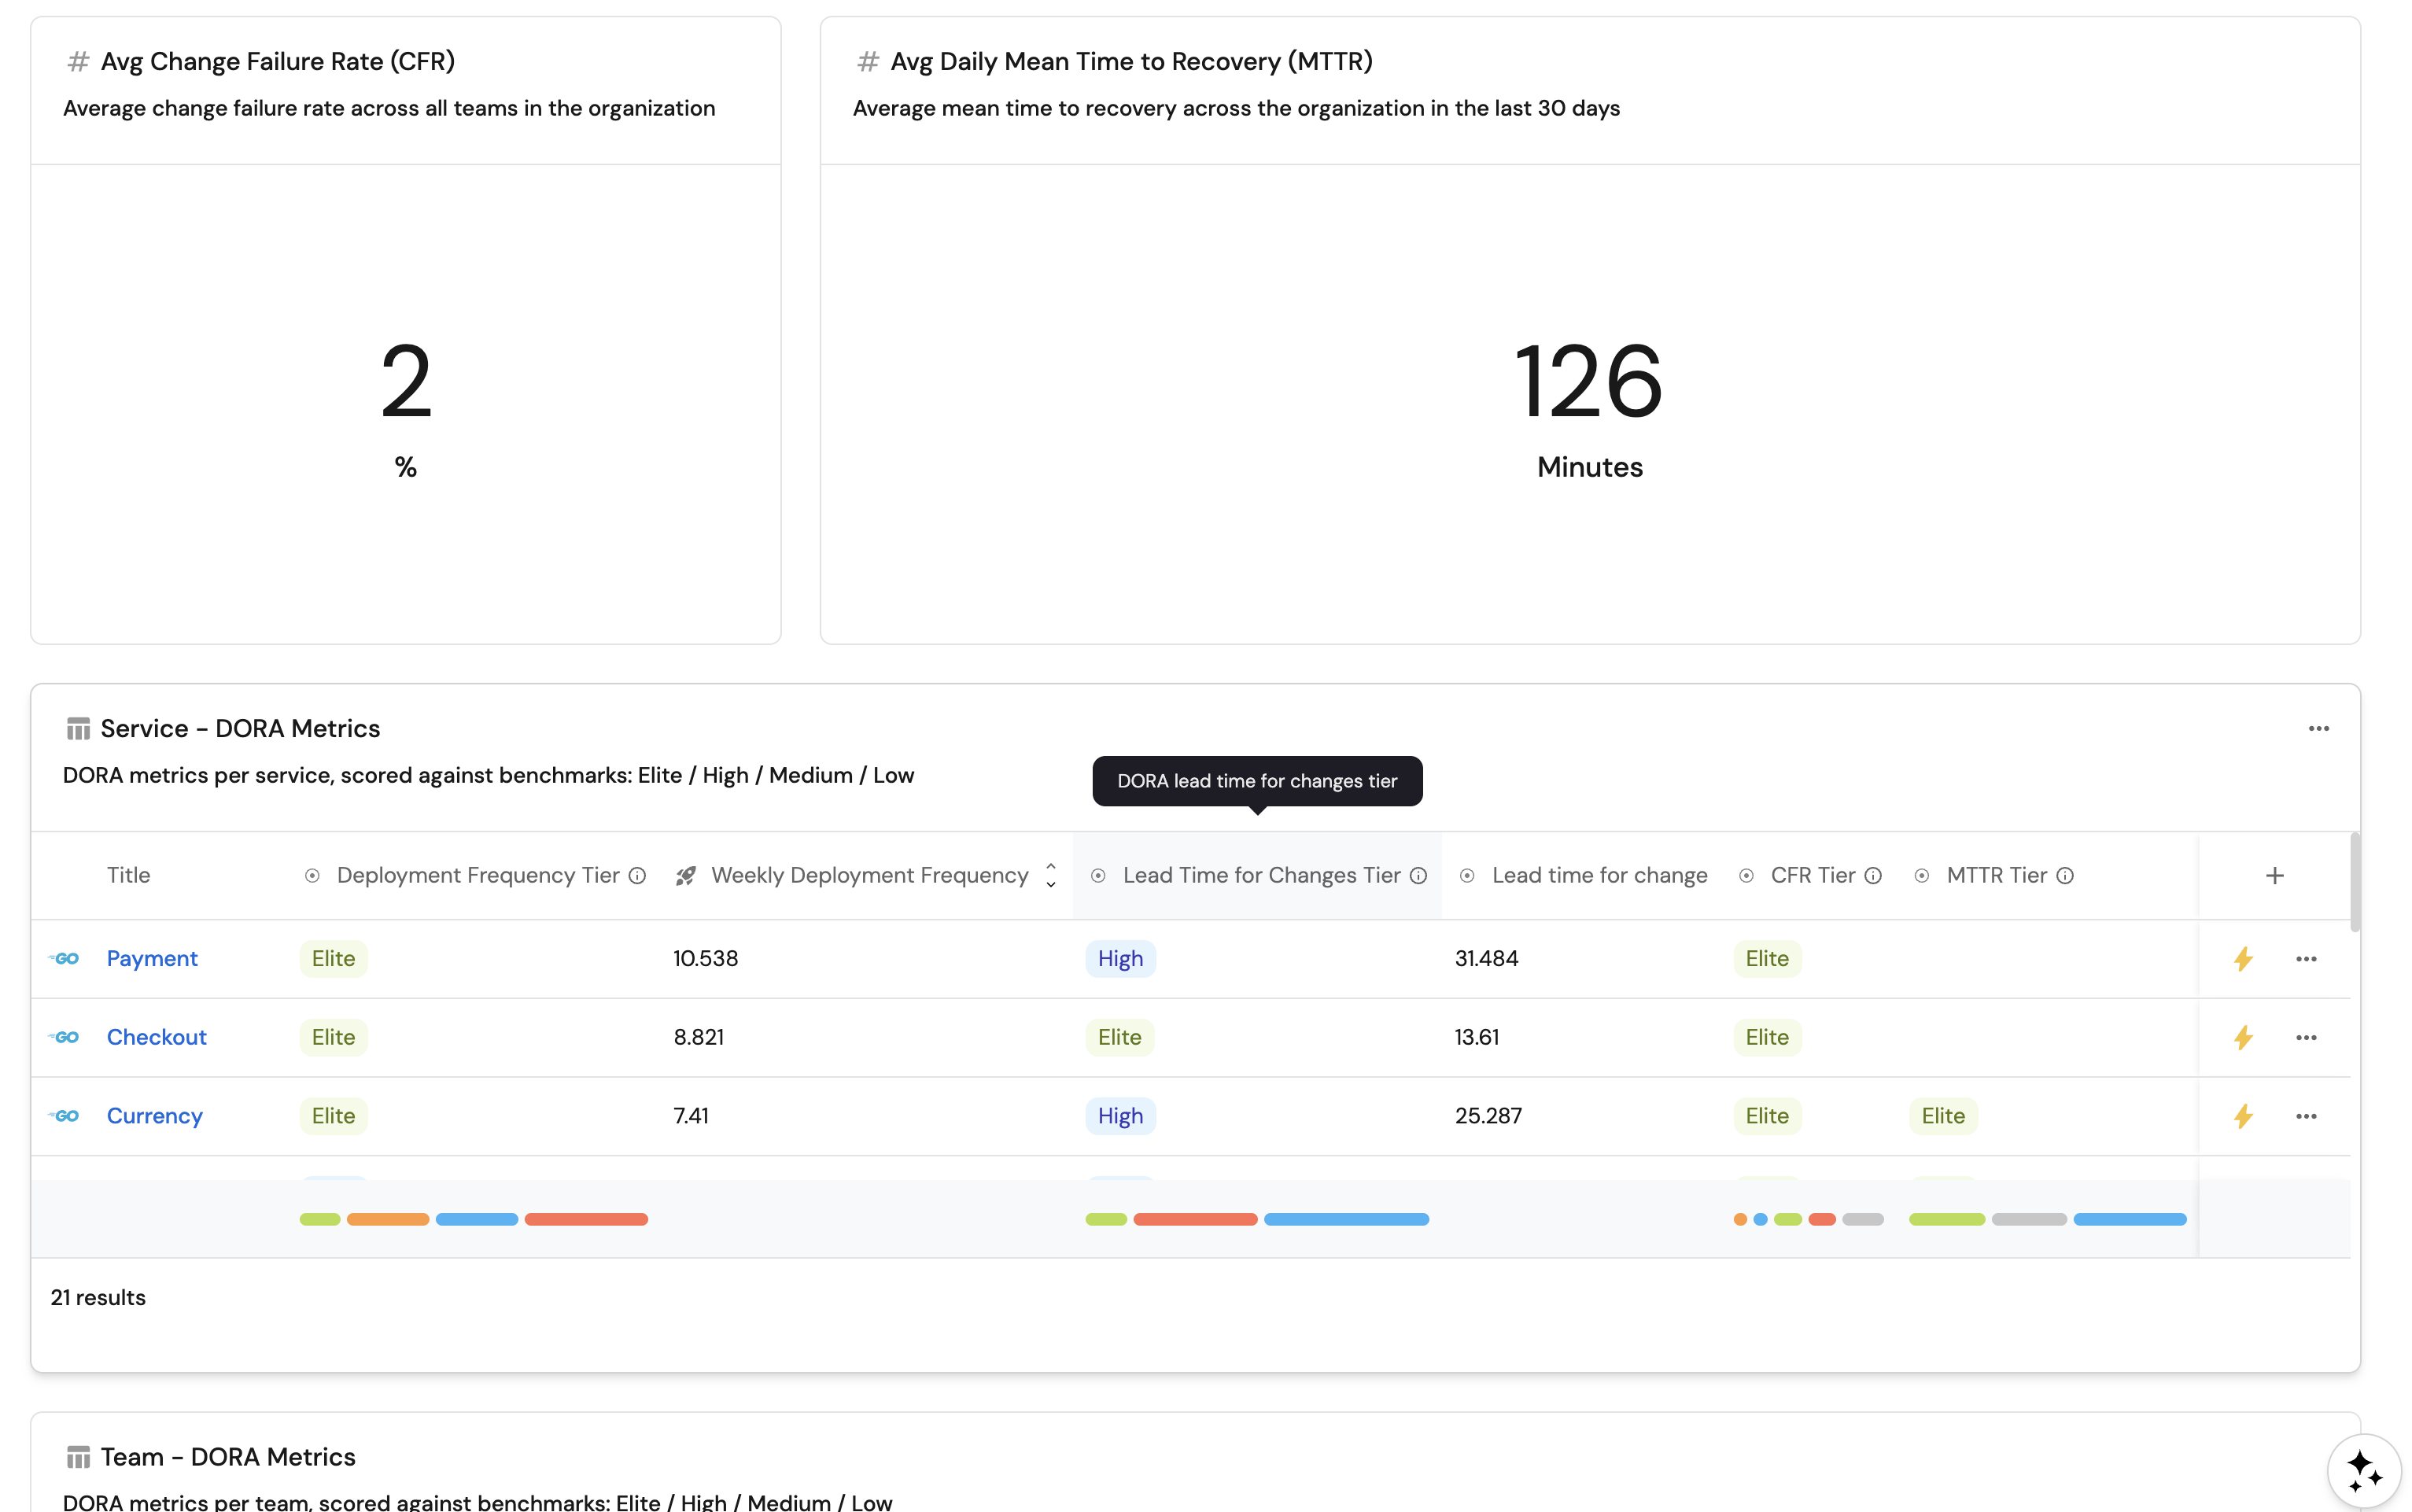
Change failure rate (requires incident integration)
Change failure rate KPI (click to expand)
- Click
+ Widgetand select Number Chart. - Title:
Avg Change Failure Rate (CFR). - Description:
Average change failure rate across all teams in the organization. - Select
Aggregate Property (All Entities)Chart type and choose Team as the Blueprint. - Select
Change Failure Rateas the Property. - Select
averagefor the Function. - Select
totalfor Average of. - Add a dataset filter: type
=team. - Select
customas the Unit and input%as the Custom unit. - Click Save.
Daily incidents count (click to expand)
- Click
+ Widgetand select Line Chart. - Title:
Daily Incidents Count. Description:Number of incidents per day across the organization. - Set X axis:
- Title:
Day. - Time interval:
Day. - Time range:
In the past 30 days.
- Title:
- Set Y axis title:
Incidents. - Click + Line and configure:
- Title:
Incidents. - Chart type:
Count entities. - Blueprint:
PagerDuty Incident. - Function:
count. - Measure time by:
created_at.
- Title:
- Click Save.
Mean time to recovery (requires incident integration)
MTTR KPI (click to expand)
- Click
+ Widgetand select Number Chart. - Title:
Avg Daily Mean Time to Recovery (MTTR). - Description:
Average mean time to recovery across the organization in the last 30 days. - Select
Aggregate Property (All Entities)Chart type and choose PagerDuty Incident as the Blueprint. - Select
Recovery Timeas the Property. - Select
averagefor the Function. - Select
totalfor Average of. - Add a dataset filter: resolvedAt
betweenlast month. - Select
customas the Unit and inputMinutesas the Custom unit. - Click Save.
Daily MTTR trend (click to expand)
- Click
+ Widgetand select Line Chart. - Title:
Daily Mean Time to Recovery (MTTR). Description:Average incident resolution time per day across the organization. - Set X axis:
- Title:
Day. - Time interval:
Day. - Time range:
In the past 30 days.
- Title:
- Set Y axis title:
Minutes. - Click + Line and configure:
- Title:
MTTR. - Chart type:
Aggregate property values. - Blueprint:
PagerDuty Incident. - Function:
average. - Property:
Recovery Time(recoveryTime). - Measure time by:
resolvedAt.
- Title:
- Click Save.
Service and team tables
Service DORA metrics table (click to expand)
- Click
+ Widgetand select Table. - Title:
Service - DORA Metrics. - Description:
DORA metrics per service, scored against benchmarks: Elite / High / Medium / Low. - Choose the Service blueprint.
- Click Save.
- Click on the
...button in the top right corner of the table and select Customize table. - In the top right corner of the table, click on Manage Properties and add the following columns:
- Team: The team that owns the service.
- Title: The service name.
- Deployment Frequency (
deploy_freq_tier): The DORA tier for deployment frequency. - Deployment Frequency (per week) (
deployment_frequency): Raw deployments per week value. - Lead Time for Changes (
github_lead_time_tierfor GitHub,gitlab_lead_time_tierfor GitLab,ado_lead_time_tierfor Azure DevOps): The DORA tier for lead time. - Lead Time for Changes (Hours) (
github_lead_time_for_changefor GitHub,gitlab_lead_time_for_changefor GitLab,ado_lead_time_for_changefor Azure DevOps): Raw lead time value. - Total Incidents (
total_incidents): Total number of incidents linked to the service. - (If incident integration is configured) CFR (
cfr_tier): The DORA tier for change failure rate. - (If incident integration is configured) MTTR (
mttr_tier): The DORA tier for mean time to recovery.
- Select
teamas the Group by column. - Click on the save icon in the top right corner of the widget to save the customized table.
Team DORA metrics table (click to expand)
-
Click
+ Widgetand select Table. -
Title:
Team - DORA Metrics. -
Description:
DORA metrics per team, scored against benchmarks: Elite / High / Medium / Low. -
Choose the Team blueprint.
-
Add this JSON to the Initial filters editor to show only teams (not groups):
{"combinator": "and","rules": [{"property": "type","operator": "=","value": "team"}]} -
Click Save.
-
Click on the
...button in the top right corner of the table and select Customize table. -
In the top right corner of the table, click on Manage Properties and add the following columns:
- Title: The team name.
- Deployment Frequency (
deploy_freq_tier): The DORA tier for deployment frequency. - Deployment Frequency (per service) (
deployment_frequency_per_service): Normalized deployments per week. - Lead Time for Changes (
github_lead_time_tierfor GitHub,gitlab_lead_time_tierfor GitLab,ado_lead_time_tierfor Azure DevOps): The DORA tier for lead time. - Lead Time for Changes (Hours) (
github_lead_time_for_changefor GitHub,gitlab_lead_time_for_changefor GitLab,ado_lead_time_for_changefor Azure DevOps): Raw lead time value. - (If incident integration is configured) CFR (
cfr_tier): The DORA tier for change failure rate. - (If incident integration is configured) MTTR (
mttr_tier): The DORA tier for mean time to recovery. - Change Failure Rate (
change_failure_rate): Raw change failure rate value. - Mean Time to Recovery (
mean_time_to_recovery): Raw MTTR value in minutes. - Total Incidents (
total_incidents): Total number of incidents linked to the team.
-
Sort by
Deployment Frequency (per service)in descending order. -
Click on the save icon in the top right corner of the widget to save the customized table.
Group DORA metrics table (click to expand)
-
Click
+ Widgetand select Table. -
Title:
Group - DORA Metrics. -
Description:
Scored against DORA benchmarks: Elite / High / Medium / Low. -
Choose the Team blueprint.
-
Add this JSON to the Initial filters editor to show only groups:
{"combinator": "and","rules": [{"property": "type","operator": "=","value": "group"}]} -
Click Save.
-
Click on the
...button in the top right corner of the table and select Customize table. -
In the top right corner of the table, click on Manage Properties and add the same columns as Team DORA metrics table above.
-
Sort by
Deployment Frequency (per service)in descending order. -
Click on the save icon in the top right corner of the widget to save the customized table.
Next steps
Once your DORA metrics dashboard is in place, consider these additional improvements:
- Set up DORA scorecards to automatically evaluate services and teams against DORA performance targets and track improvement over time.
- Add incident integration (PagerDuty) to unlock change failure rate and MTTR metrics for the full four-metric DORA picture.
- Create automations to send Slack notifications when a service's DORA tier drops below a threshold or when deployment frequency declines significantly.
- Add an AI agent to provide natural language insights into your DORA data directly on the dashboard.