Query DORA metrics using Port MCP
This guide demonstrates how to use Port's Model Context Protocol (MCP) server to query DORA metrics using natural language commands directly from your IDE or AI-powered tools. By leveraging the MCP server, you can access deployment frequency, lead time, change failure rate, and mean time to recovery data without leaving your development environment.
Common use cases
- Team performance analysis: Compare DORA metrics across different teams to identify top performers and areas for improvement.
- Sprint retrospectives: Get quick insights into deployment frequency and lead times during team retrospectives.
- Engineering leadership reporting: Generate on-demand reports for stakeholders about team velocity and reliability.
- Incident response: Quickly assess team MTTR during post-incident reviews and identify patterns.
- Continuous improvement: Monitor trends in change failure rates and deployment frequencies over time.
Prerequisites
This guide assumes you have:
- A Port account with deployment and incident data available.
- Cursor IDE installed (we'll focus on Cursor, but you can also use VSCode, Claude, or other MCP-compatible tools).
- Basic understanding of DORA metrics concepts.
Port's MCP server enables DORA insights in two complementary ways:
-
With DORA Metrics Experience: If you have DORA metrics set up, the MCP provides deterministic results over time, customized dashboards, and team-specific views. This gives you consistent, aggregated metrics that align with your organization's definitions.
-
Dynamic DORA Calculations: Even without the formal DORA metrics setup, the MCP server can analyze your deployment and incident data on-the-fly to calculate DORA metrics. This approach provides quick insights for data you might not have aggregated yet in a proper way, letting you explore different definitions and time periods flexibly.
Both approaches work together - you can start with dynamic calculations to explore your data, then implement the DORA experience for consistent tracking and dashboards.
Set up Port MCP server
The Port MCP server enables you to interact with your Port data using natural language queries directly from your IDE or AI tools.
Use Port's remote MCP server for new connections. The Docker image and uvx mcp-server-port package from the deprecated local MCP server repository are no longer maintained. If you used that server, remove its entry from your client's MCP configuration and follow the setup below.
Select your client and Port region, then follow one setup path. Use the EU endpoint (https://mcp.port.io/v1) for app.port.io, or the US endpoint (https://mcp.us.port.io/v1) for app.us.port.io.
Cursor, VS Code, and Claude Code can connect directly over HTTP. The mcp-remote package is a local compatibility proxy for clients that need it; it connects to the same remote Port server and is separate from the deprecated Docker/uvx server.
- Cursor
- VS Code
- Claude AI
- Claude Code (CLI)
- Codex CLI
To connect Cursor to Port's remote MCP, follow these steps:
For the EU region, you can use the Cursor install link and continue with authentication in step 3. For the US region, or to configure the connection manually, follow all steps below.
-
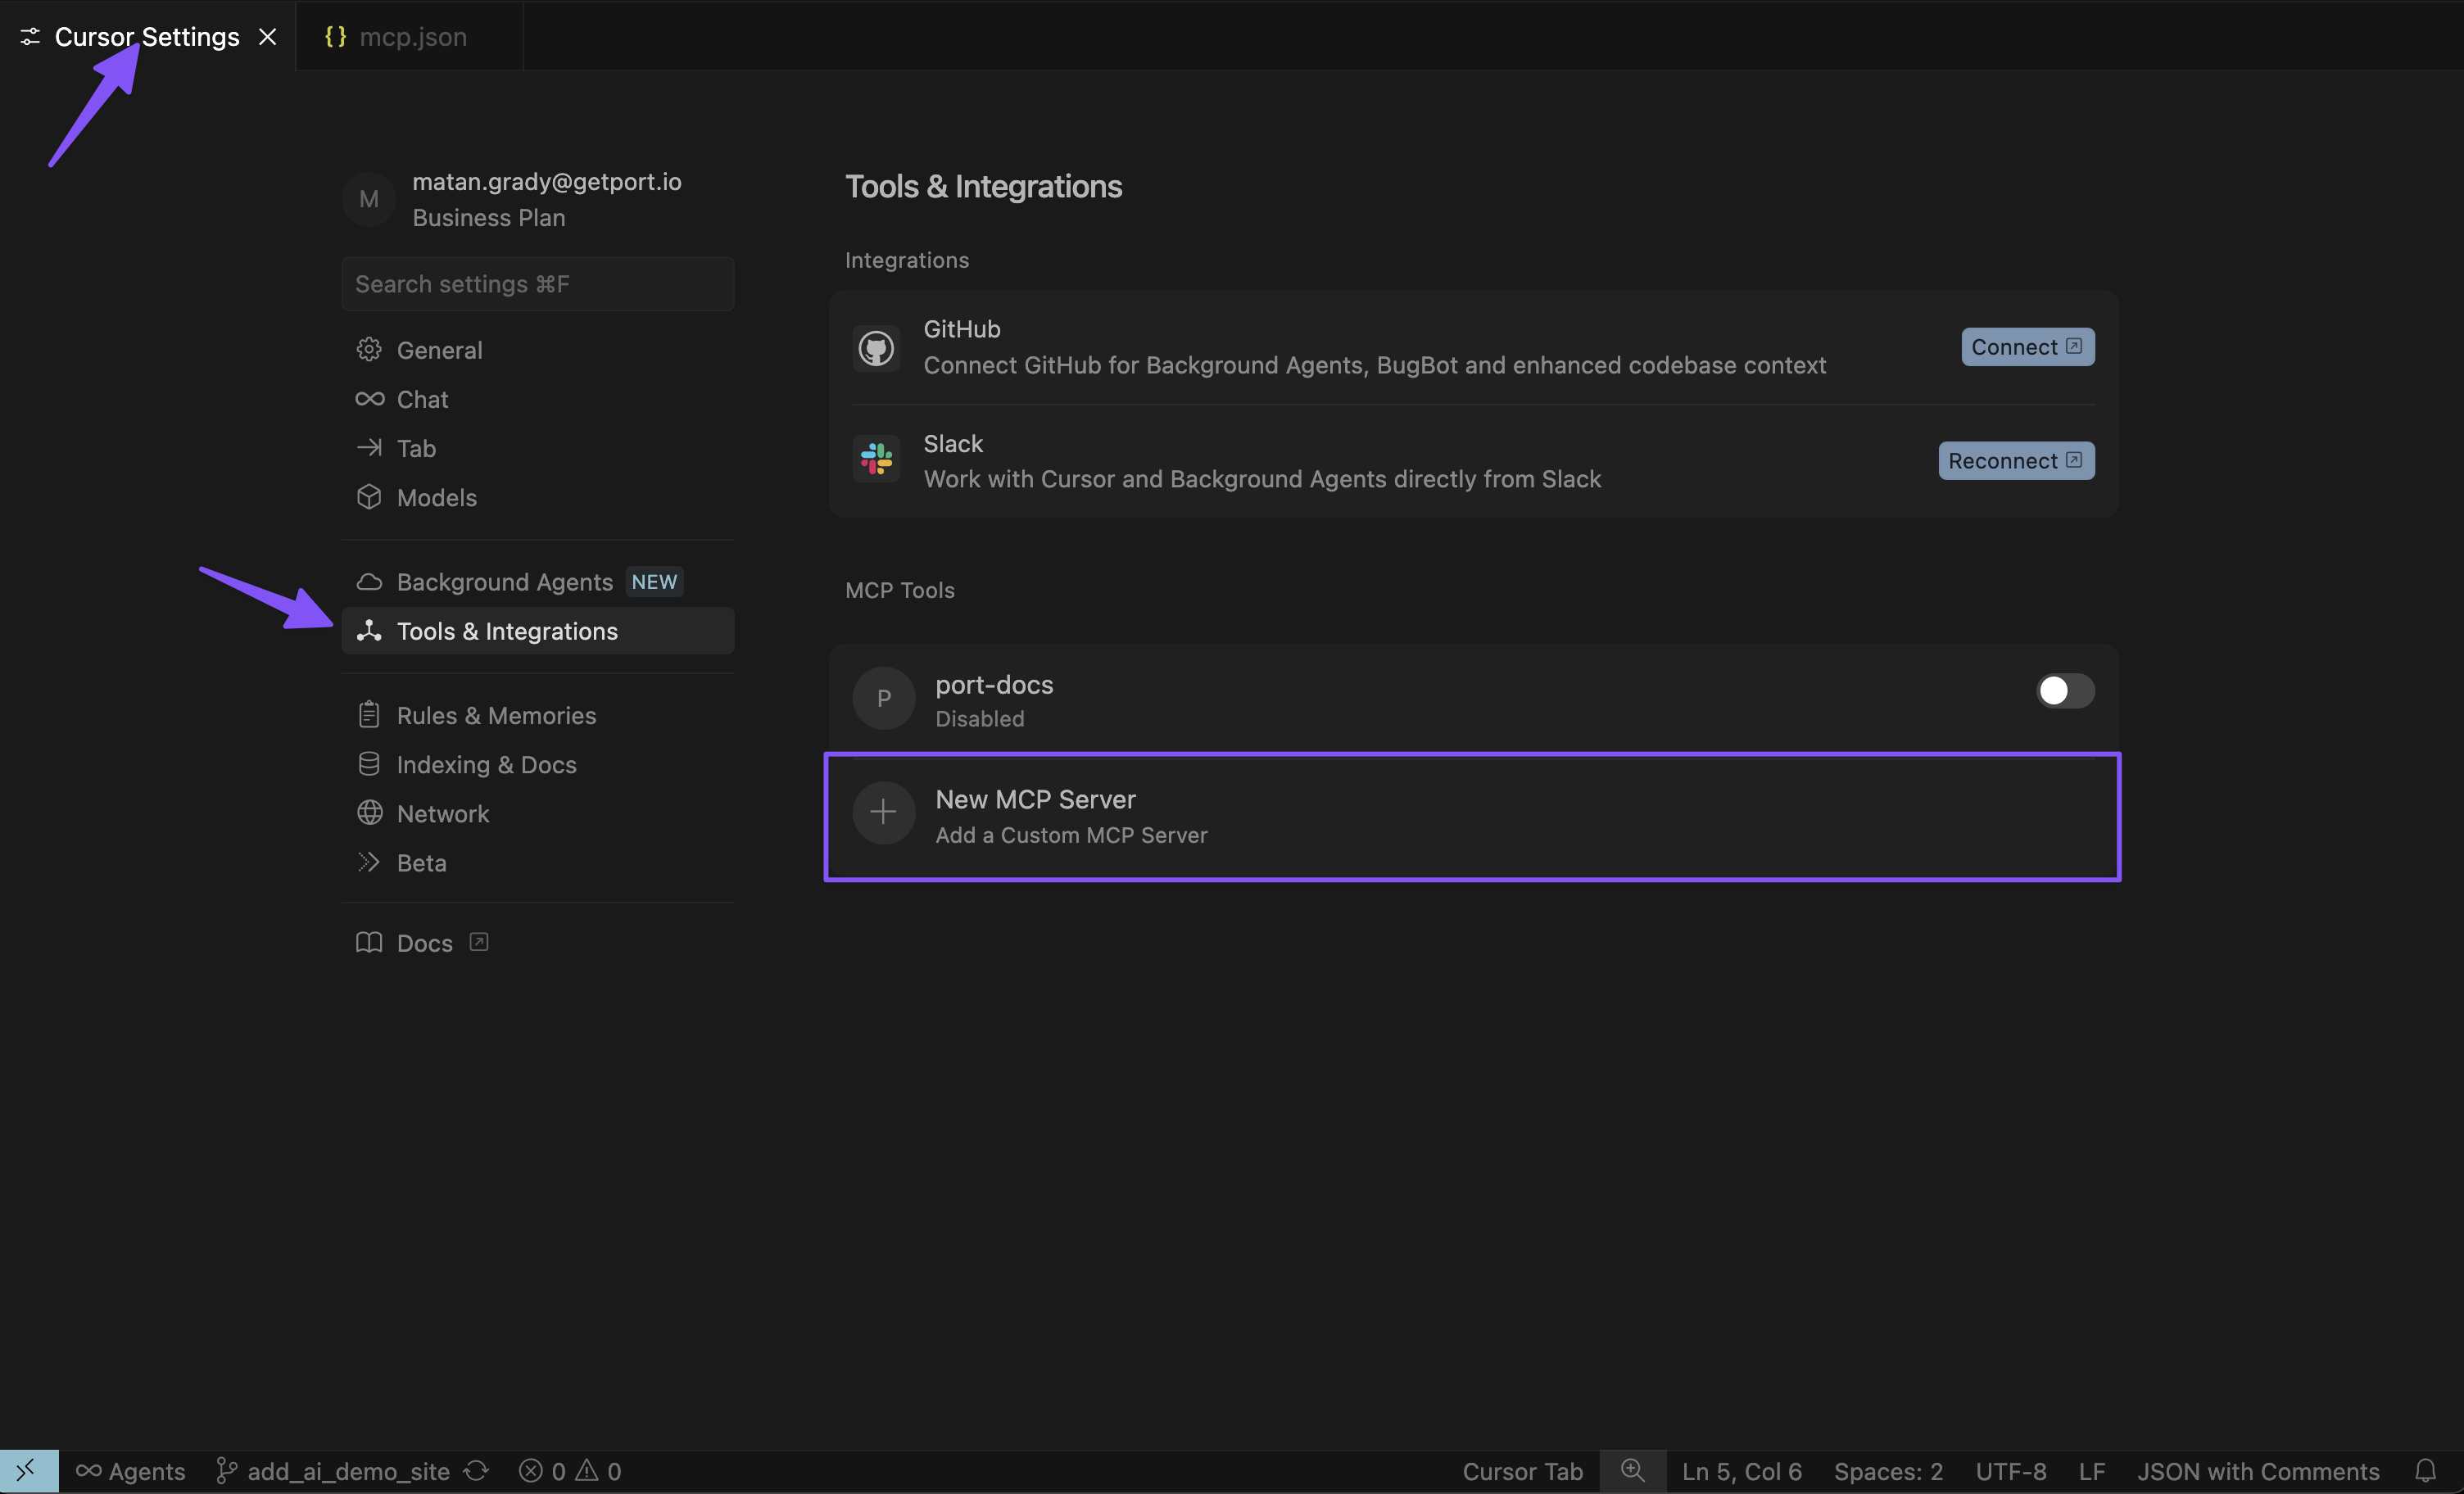
Open Cursor settings
In the settings, click Customize, select MCPs, and then click New MCP Server.
-
Configure the MCP server
Add the following configuration:
{"mcpServers": {"port-eu": {"url": "https://mcp.port.io/v1","headers": {"x-read-only-mode": "0"}}}}US regionIf your Port organization is in the US region, replace
https://mcp.port.io/v1withhttps://mcp.us.port.io/v1.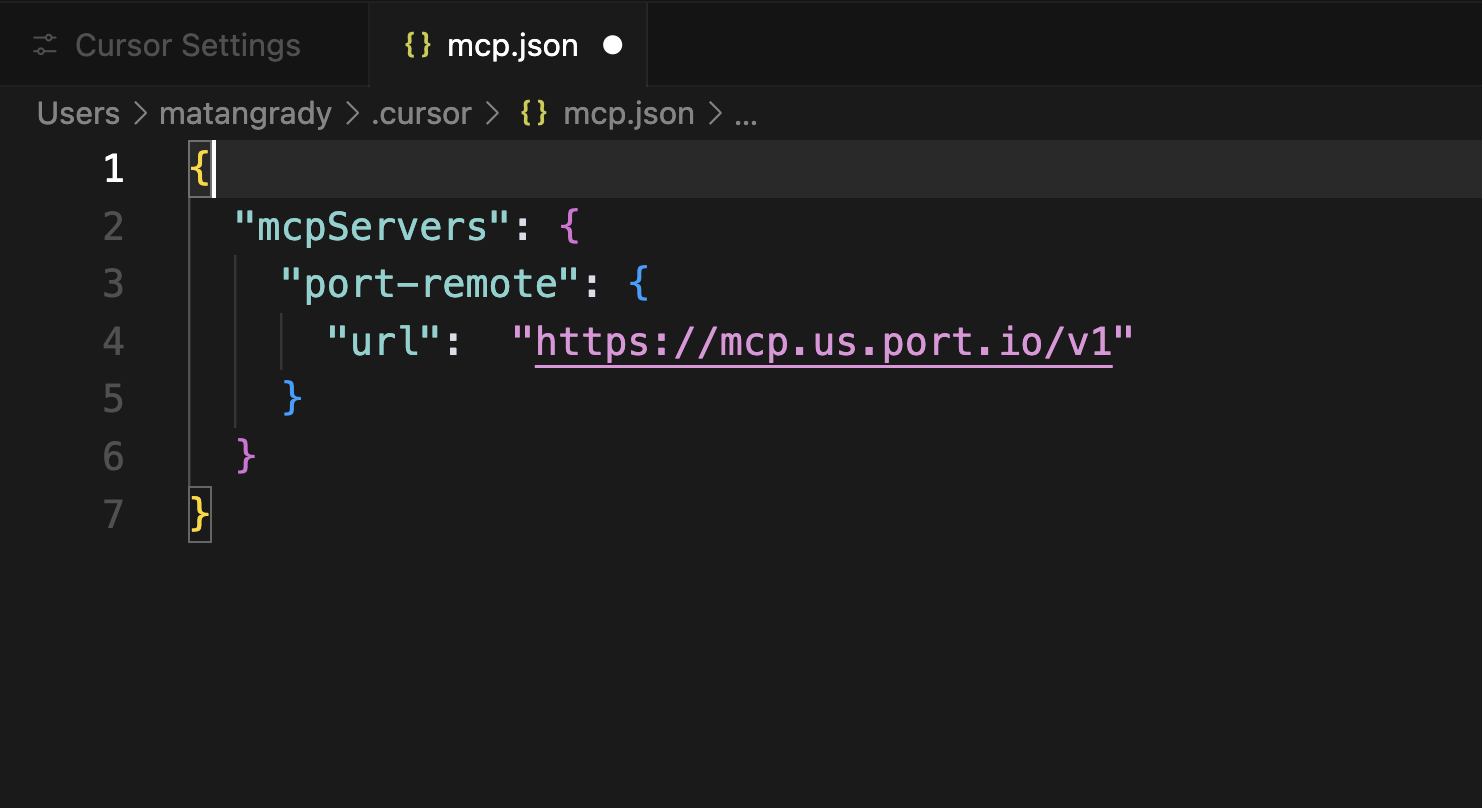 Read-only mode
The
x-read-only-modeheader defaults to0, which allows all tools based on your permissions. You can change it to1to restrict the MCP server to only expose read-only tools. When set to1, write tools are completely hidden from the available tools list, ensuring you can only query data without making modifications. -
Authenticate with Port
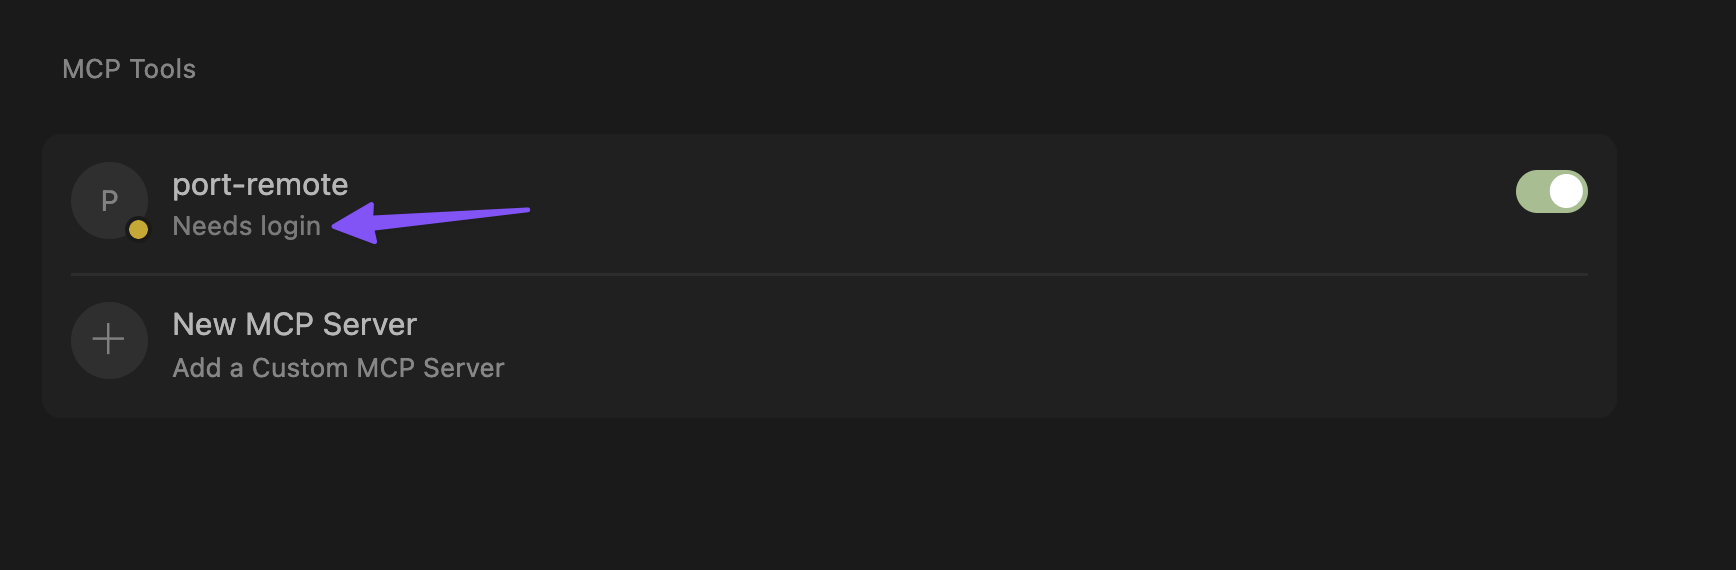
Click on "Needs login" and complete the authentication flow in the window that opens.
 Cursor OAuth session persistence
Port MCP authentication works on the initial connection. If Cursor prompts you to re-authenticate every day or two, this is typically caused by a known Cursor OAuth issue rather than a Port-side session or configuration problem.
When Cursor refreshes your OAuth session, it may fail to persist or update tokens correctly. This is especially common when you have multiple Cursor windows open. Port's logs may show
invalid_granterrors when Cursor attempts to refresh with a stale token.For more details and workarounds, see these Cursor community discussions:
-
Cursor does not refresh OAuth access tokens for MCP servers.
-
OAuth MCPs still require daily re-auth on 3.3.30, multi-window token store not synced.
Cursor has reported fixes for some MCP OAuth issues in stable releases after May 12, 2026. If you experience frequent re-authentication, update Cursor to the latest stable version and check whether the issue persists.
-
-
Verify connection
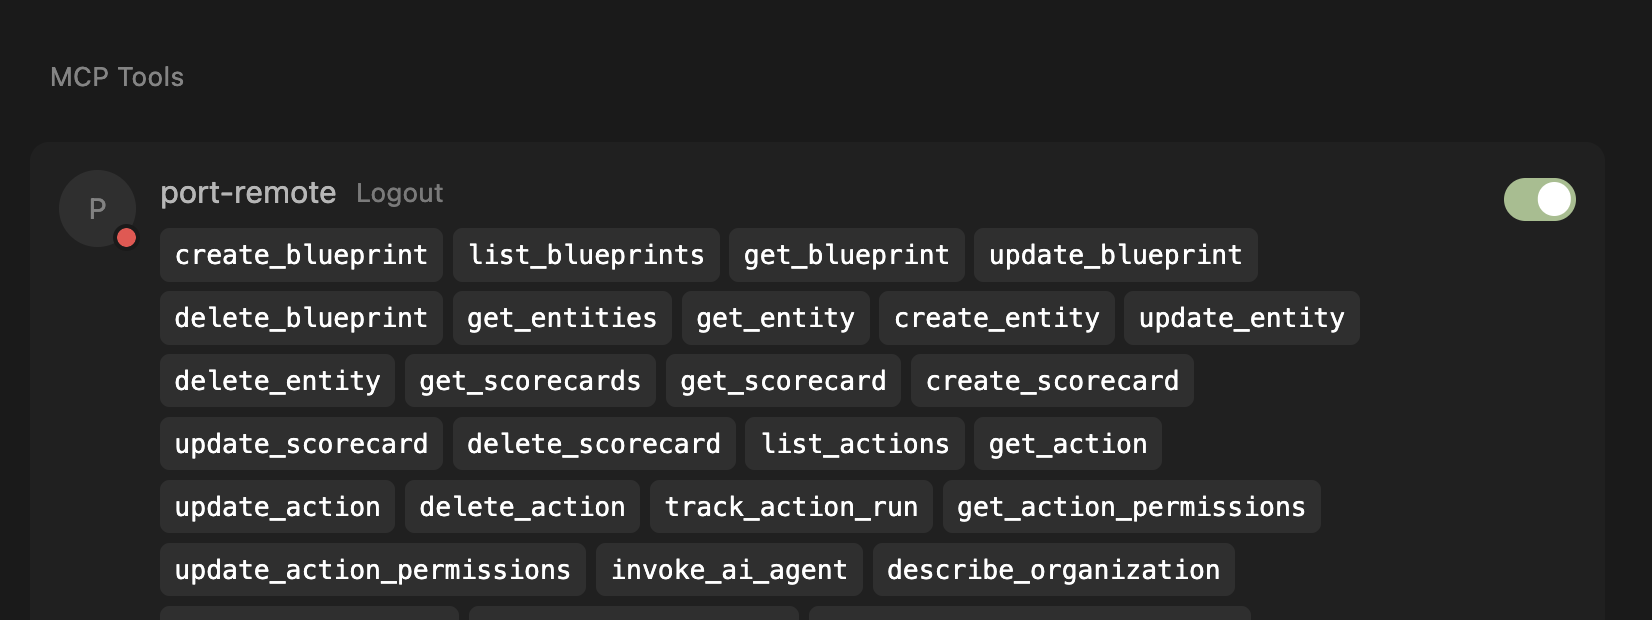
After successful authentication, you'll see the list of available tools from the MCP server.
Connect VS Code directly to Port's remote MCP server over HTTP. Use a current VS Code version with MCP access enabled by your organization. This setup does not require Node.js or mcp-remote. See the VS Code MCP documentation for client requirements.
-
Open the Command Palette and run MCP: Open User Configuration.
-
Add the following configuration to
mcp.json. If you already have aserversobject, add the Port entry to it:{"servers": {"port-vscode-eu": {"type": "http","url": "https://mcp.port.io/v1","headers": {"x-read-only-mode": "0"}}}}US regionIf your Port organization is in the US region, replace
https://mcp.port.io/v1withhttps://mcp.us.port.io/v1.Set
x-read-only-modeto1if you want to expose only read-only tools. The default,0, allows tools based on your Port permissions. -
Save the file, click Start above the Port server entry, and complete the browser authentication flow.
-
Verify that VS Code displays the available tools. Open a chat and select Port tools from the tool picker. Try asking, "List my Port blueprints."
If the connection fails, run MCP: List Servers, select your Port server, and choose Show Output to inspect the error. Check that your configuration uses the correct regional endpoint and that you completed browser authentication.
To connect Claude AI (Desktop & Web) to Port's remote MCP, install the Port official connector from the Claude connectors library. For detailed instructions, refer to the official Anthropic documentation on custom connectors.
- Direct install link: Install Port connector in Claude.
-
Open Port Connector page by visiting this link or searching for "Port" connector, and click Connect.
-
Enter your MCP server URL when prompted:
https://mcp.port.io/v1US regionIf your Port organization is in the US region, use
https://mcp.us.port.io/v1instead.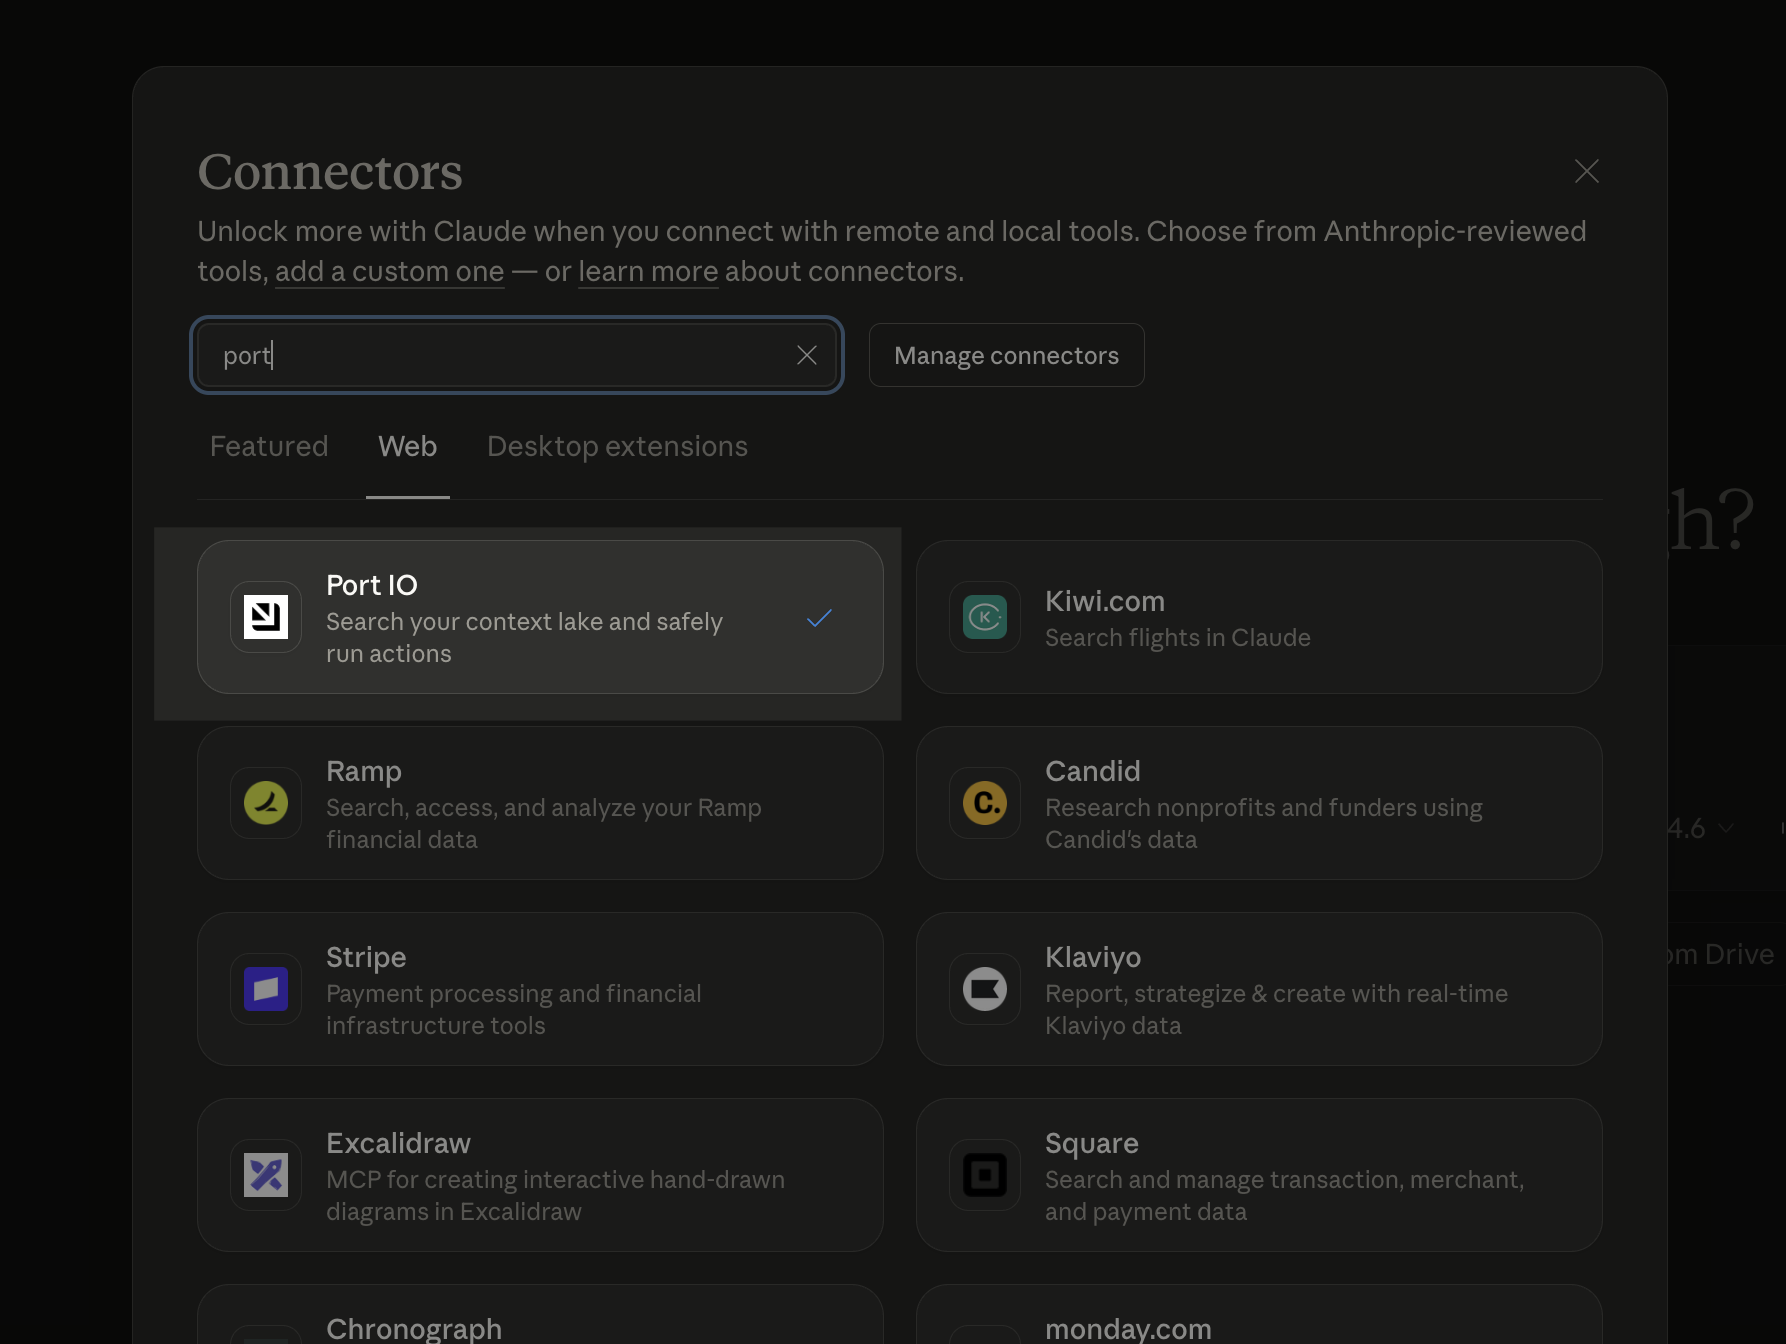
Connect Claude Code directly to Port's remote MCP server using HTTP. This is the recommended setup and does not require Node.js, npx, or a local MCP server.
Prerequisites
- Claude Code CLI installed on your machine. For installation instructions, refer to the official Claude Code documentation.
- Access to your Port account in the browser for OAuth authentication.
Add Port MCP
Run the following command from the directory where you use Claude Code:
claude mcp add --transport http port-eu https://mcp.port.io/v1 --header "x-read-only-mode: 0"
If your Port organization is in the US region, replace port-eu and https://mcp.port.io/v1 with port-us and https://mcp.us.port.io/v1.
The x-read-only-mode header defaults to 0, which allows all tools based on your permissions. Change it to 1 to restrict the MCP server to only expose read-only tools. When set to 1, write tools are completely hidden from the available tools list, ensuring you can only query data without making modifications.
Verify the connection
Start Claude Code:
claude
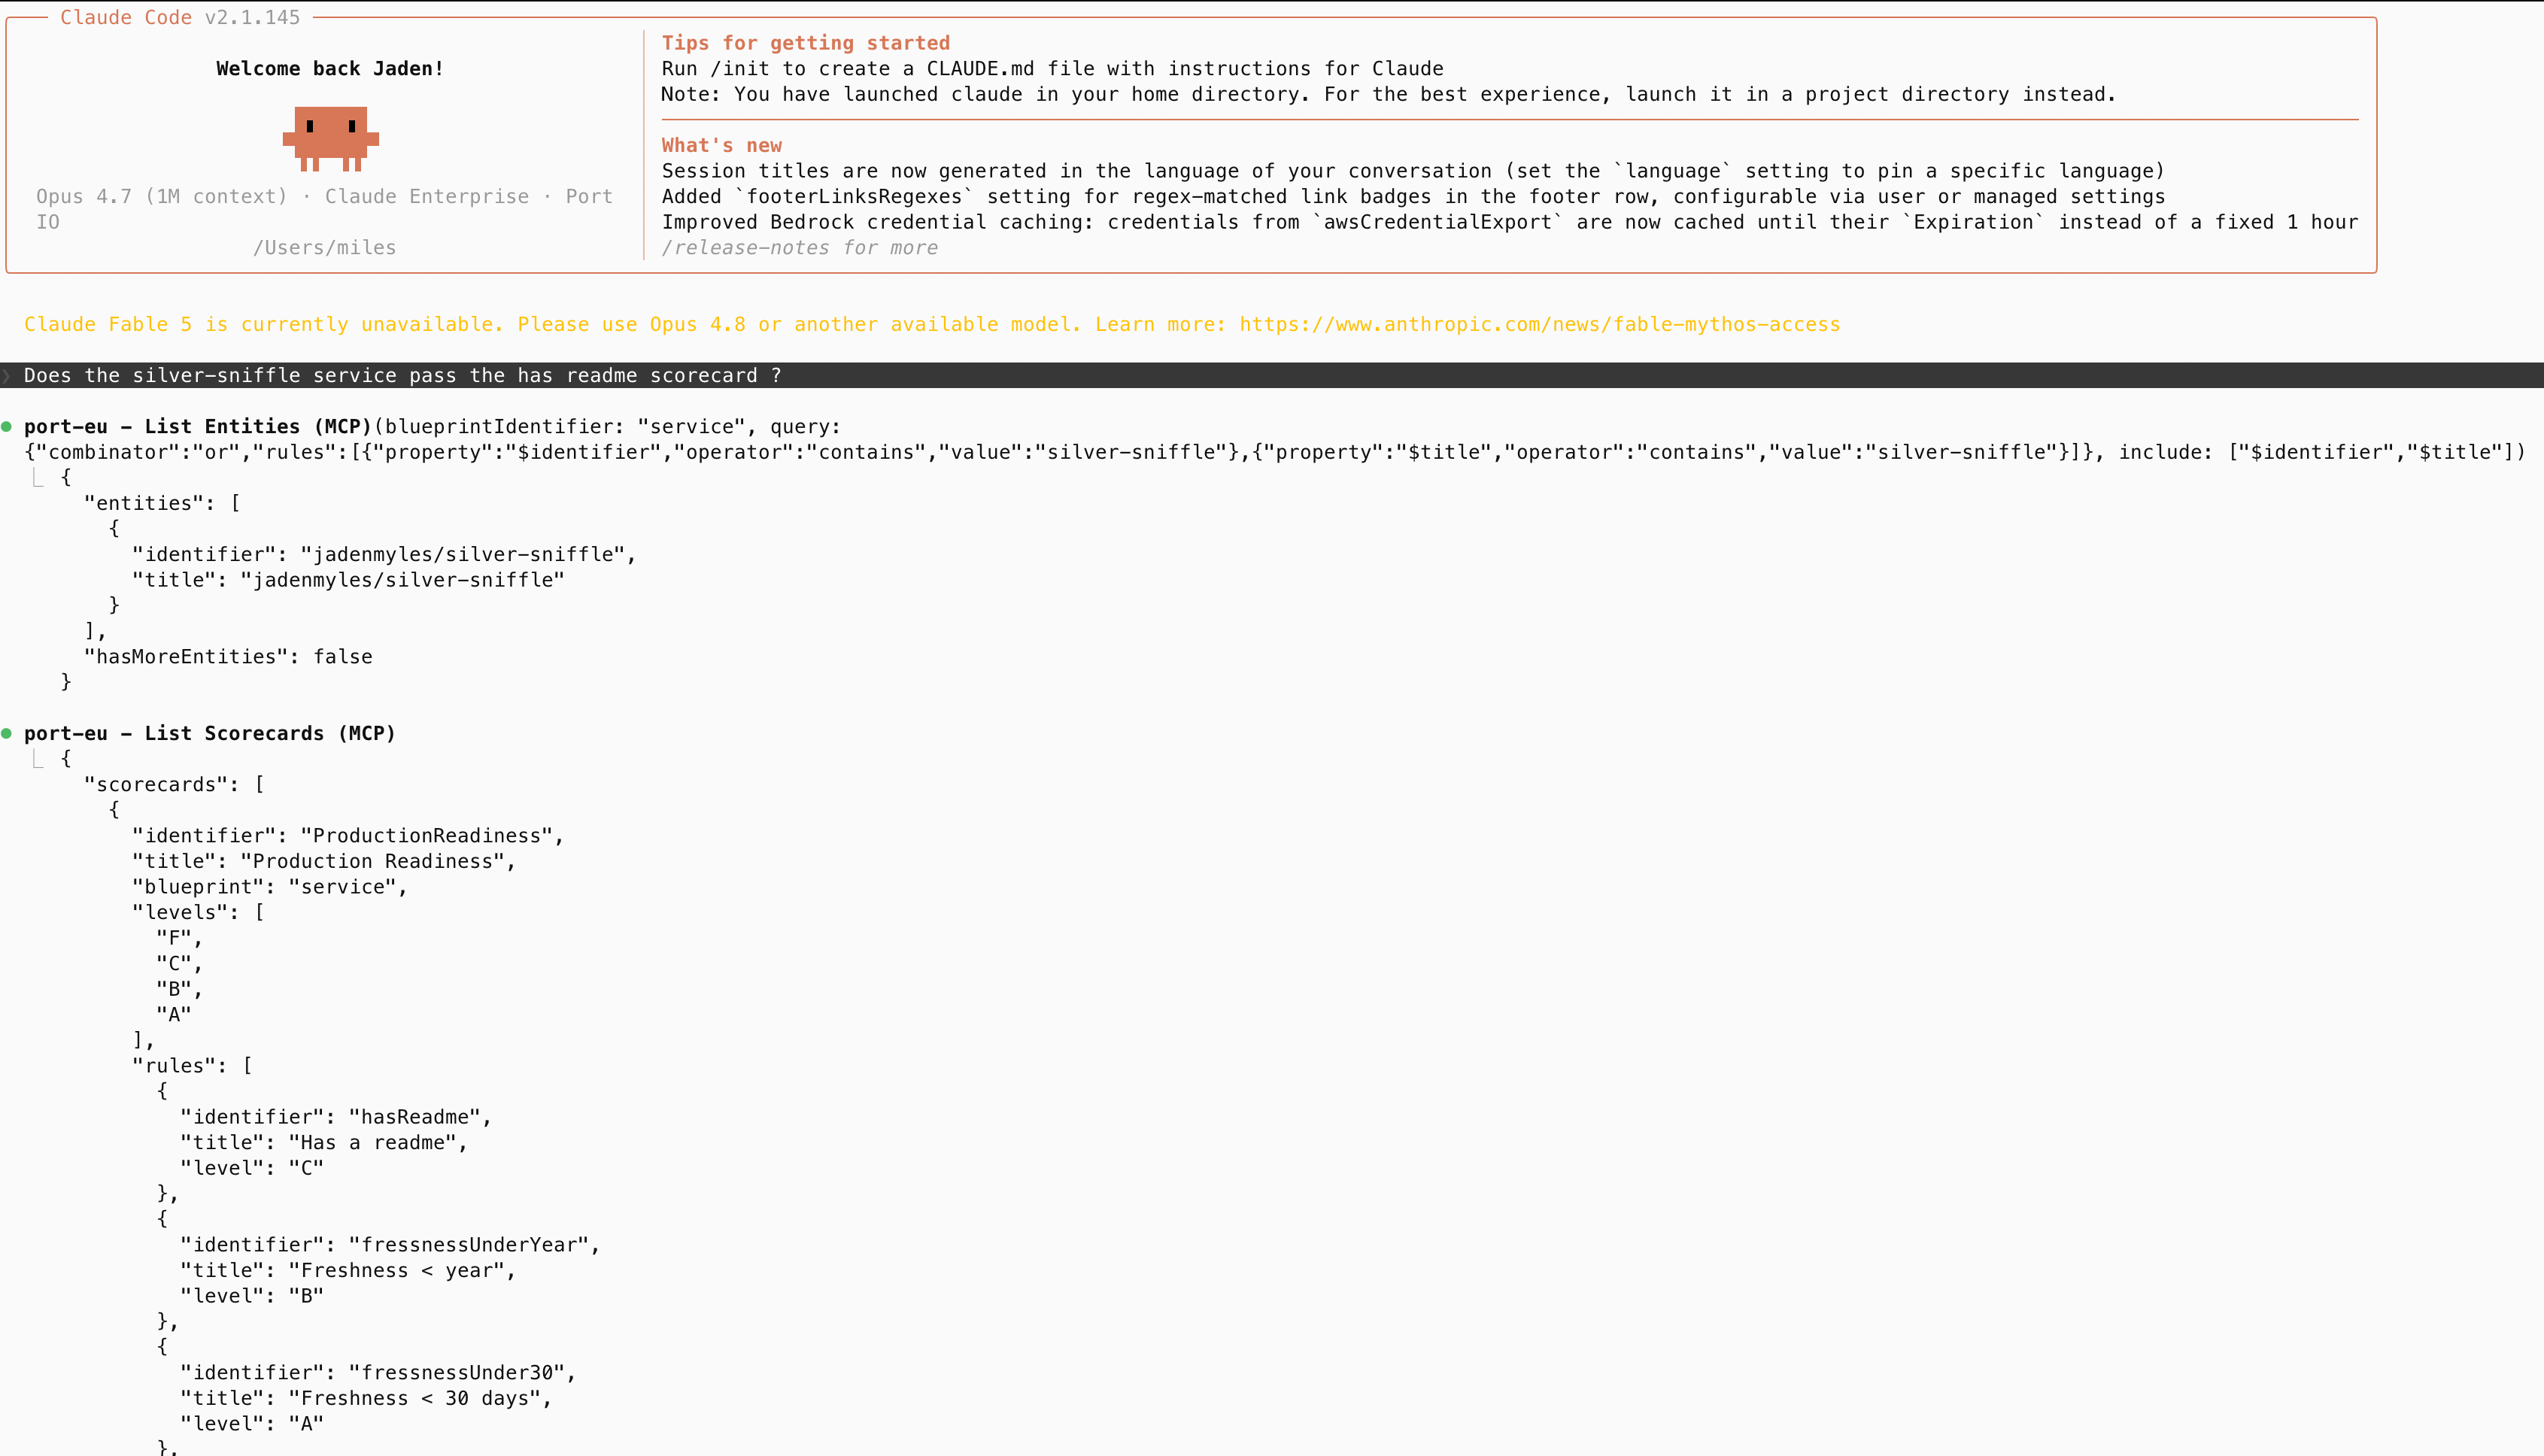
Run /mcp, select port-eu or port-us, and follow the browser authentication flow. After authentication, verify that the server shows its available tools. Try asking, "List my Port blueprints."
Resolve connection timeouts
If you previously used claude mcp add-json with npx mcp-remote, that configuration starts a local proxy. On first use, npx may need to download the package and its dependencies, adding startup time. The proxy also waits for browser authentication. Package registry access, proxy settings, or an incomplete login can cause this path to time out even when direct HTTP works.
Remove the old Port server entry from your MCP configuration before adding the direct HTTP connection above. If the direct connection also times out, check your region, access to the MCP endpoint from your terminal, and completion of the browser login. Use /mcp to inspect the connection status. See the Claude Code MCP documentation for connection diagnostics and startup timeout settings.
To connect OpenAI Codex CLI to Port's remote MCP server, install Codex CLI locally and add Port as a remote MCP server. For complete instructions, refer to the official Codex CLI documentation.
Prerequisites
- An OpenAI account with access to Codex CLI.
- The Codex CLI installed on your machine.
- Access to your Port account in the browser for OAuth authentication.
- Your Port region. If your Port app URL contains
us, use the US MCP URL. Otherwise, use the EU MCP URL. - Node.js installed on your machine.
Step 1: Install Codex CLI
Run the following command to install Codex CLI:
npm install -g @openai/codex
After installation, verify that Codex CLI is available:
codex --version
Step 2: Sign in to Codex
Start Codex and complete the sign-in flow:
codex
Step 3: Add Port MCP
Run the following command:
codex mcp add port-eu --url https://mcp.port.io/v1
If your Port organization is in the US region, replace port-eu and https://mcp.port.io/v1 with port-us and https://mcp.us.port.io/v1.
Step 4: Authenticate with Port
After adding the server, authenticate using OAuth. Run the matching login command for the region you used in step 3:
codex mcp login port-eu
If you used port-us in step 3, run codex mcp login port-us instead.
Complete the Port authentication flow in the browser window that opens.
Step 5: Verify the connection
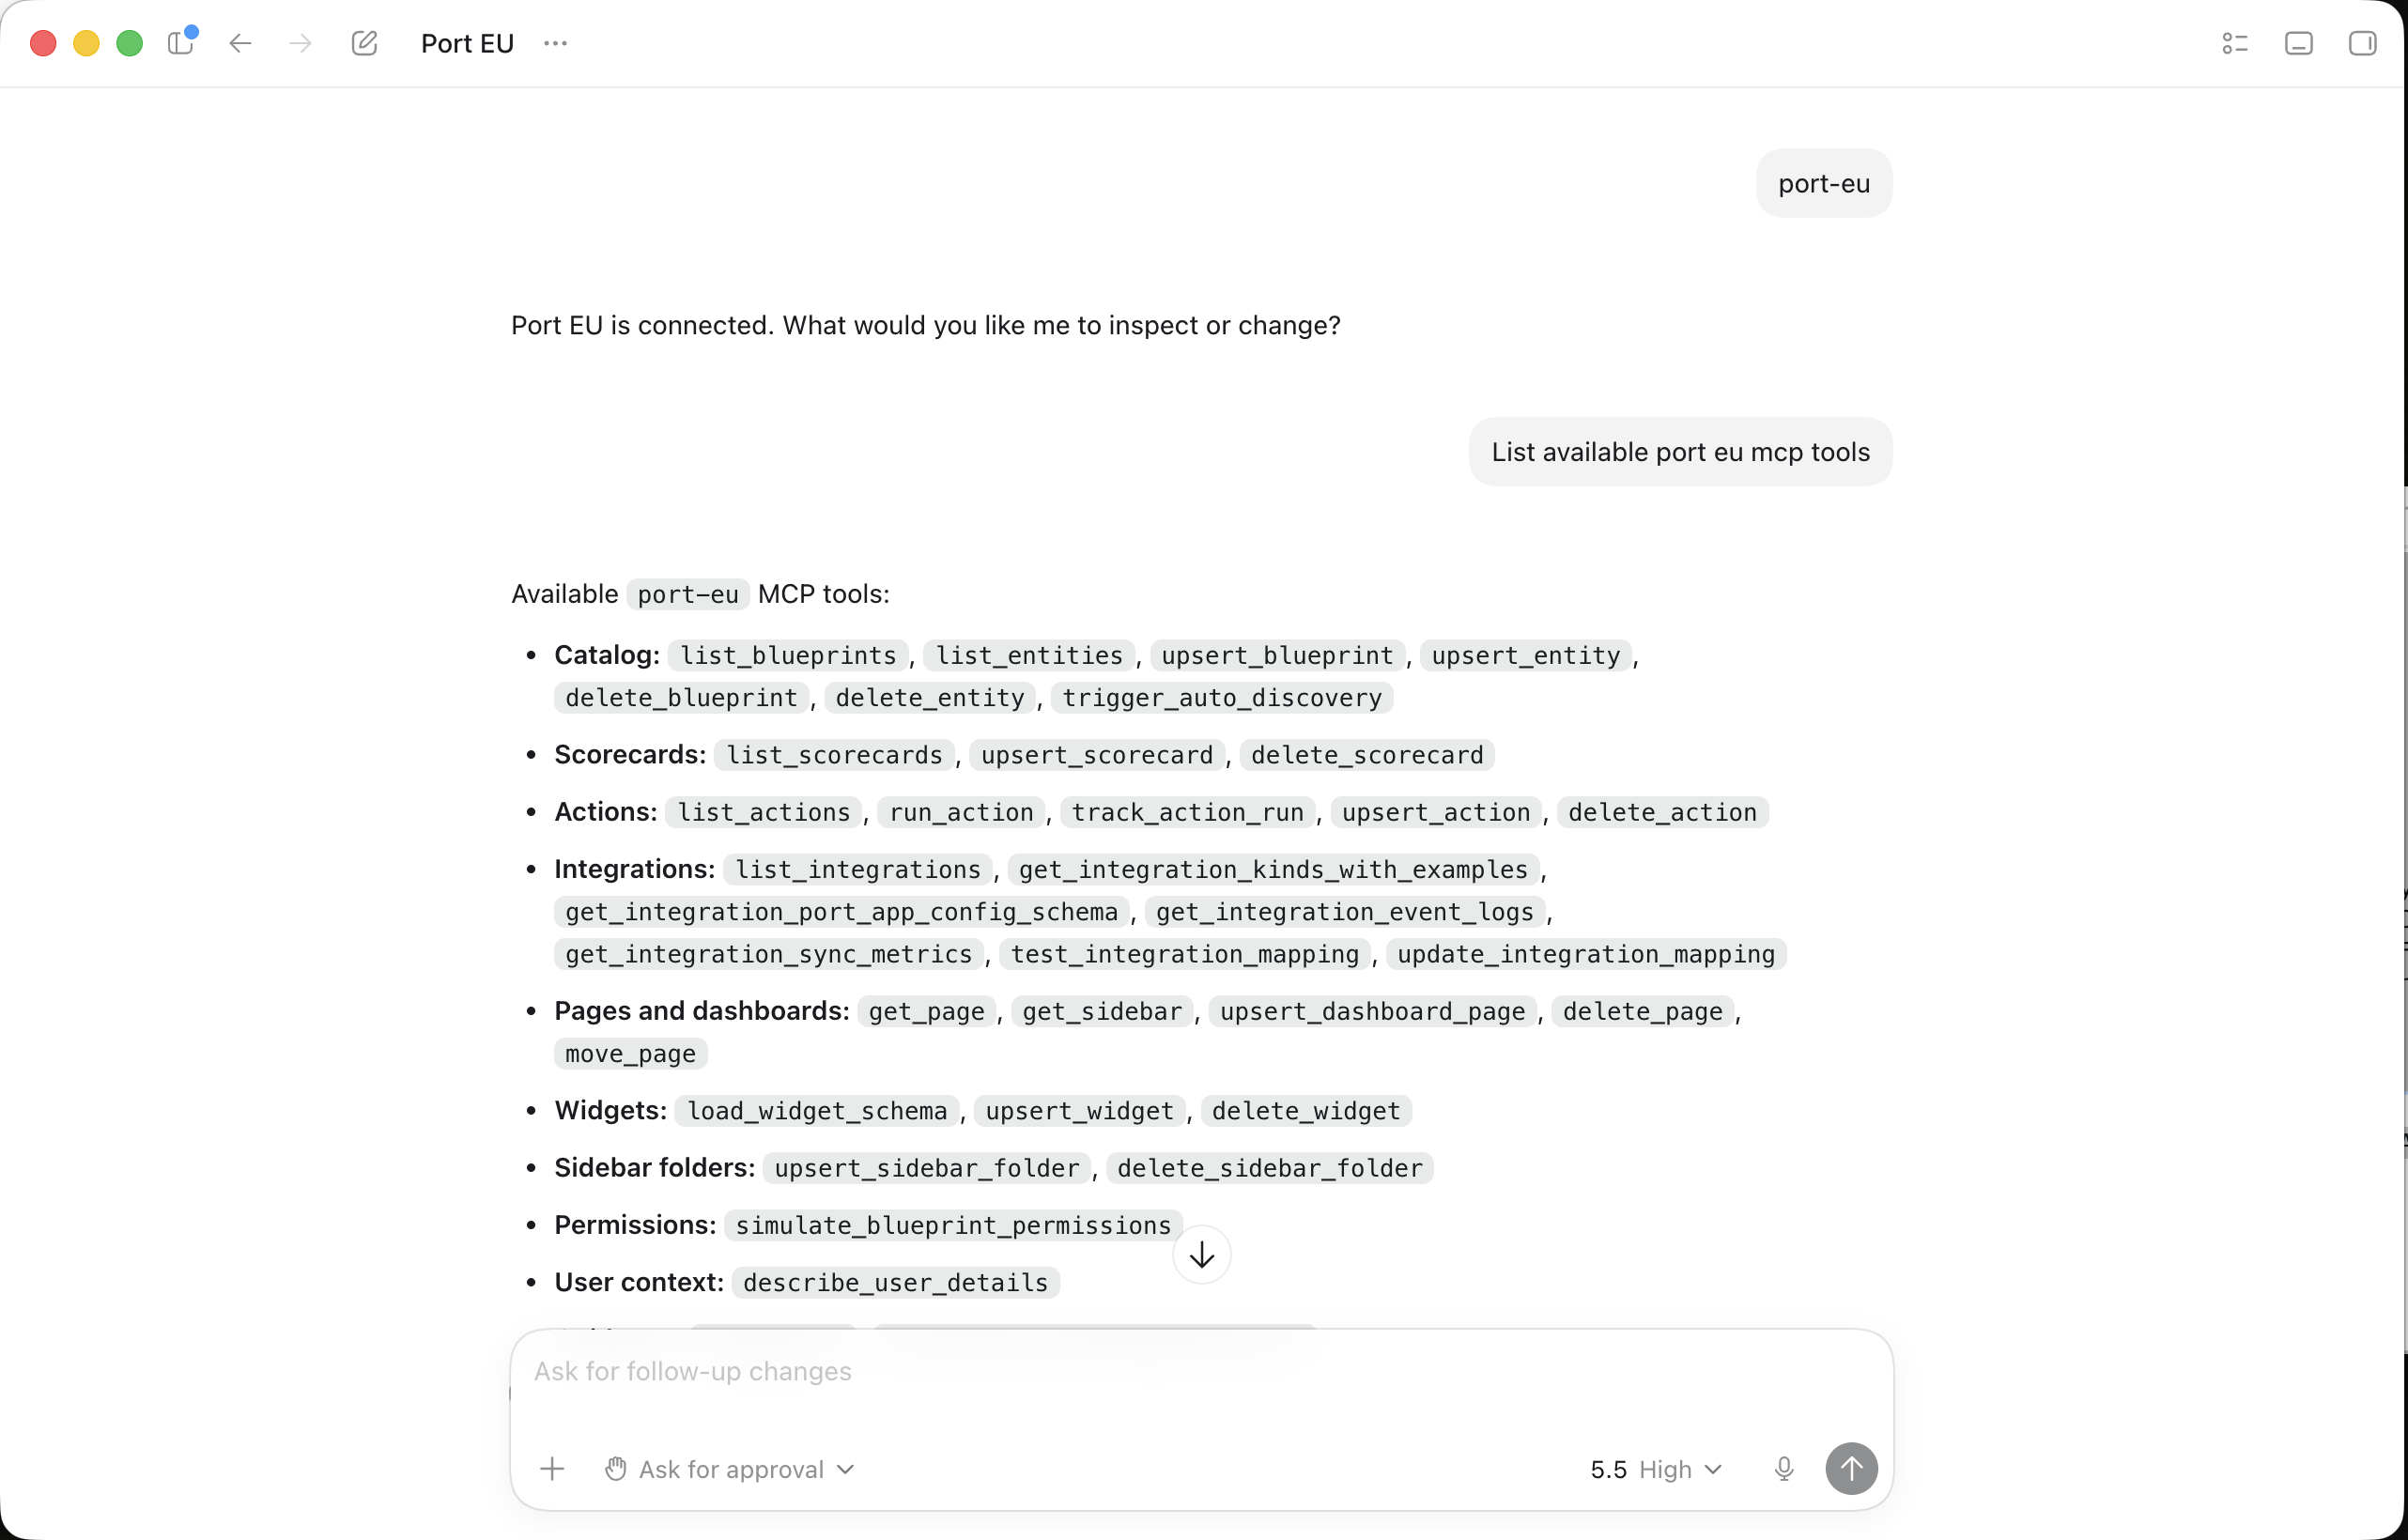
Start a Codex session and run /mcp and type port-eu or port-us to verify that the Port MCP server is connected and showing its tools.
Step 6: Query Port through Codex
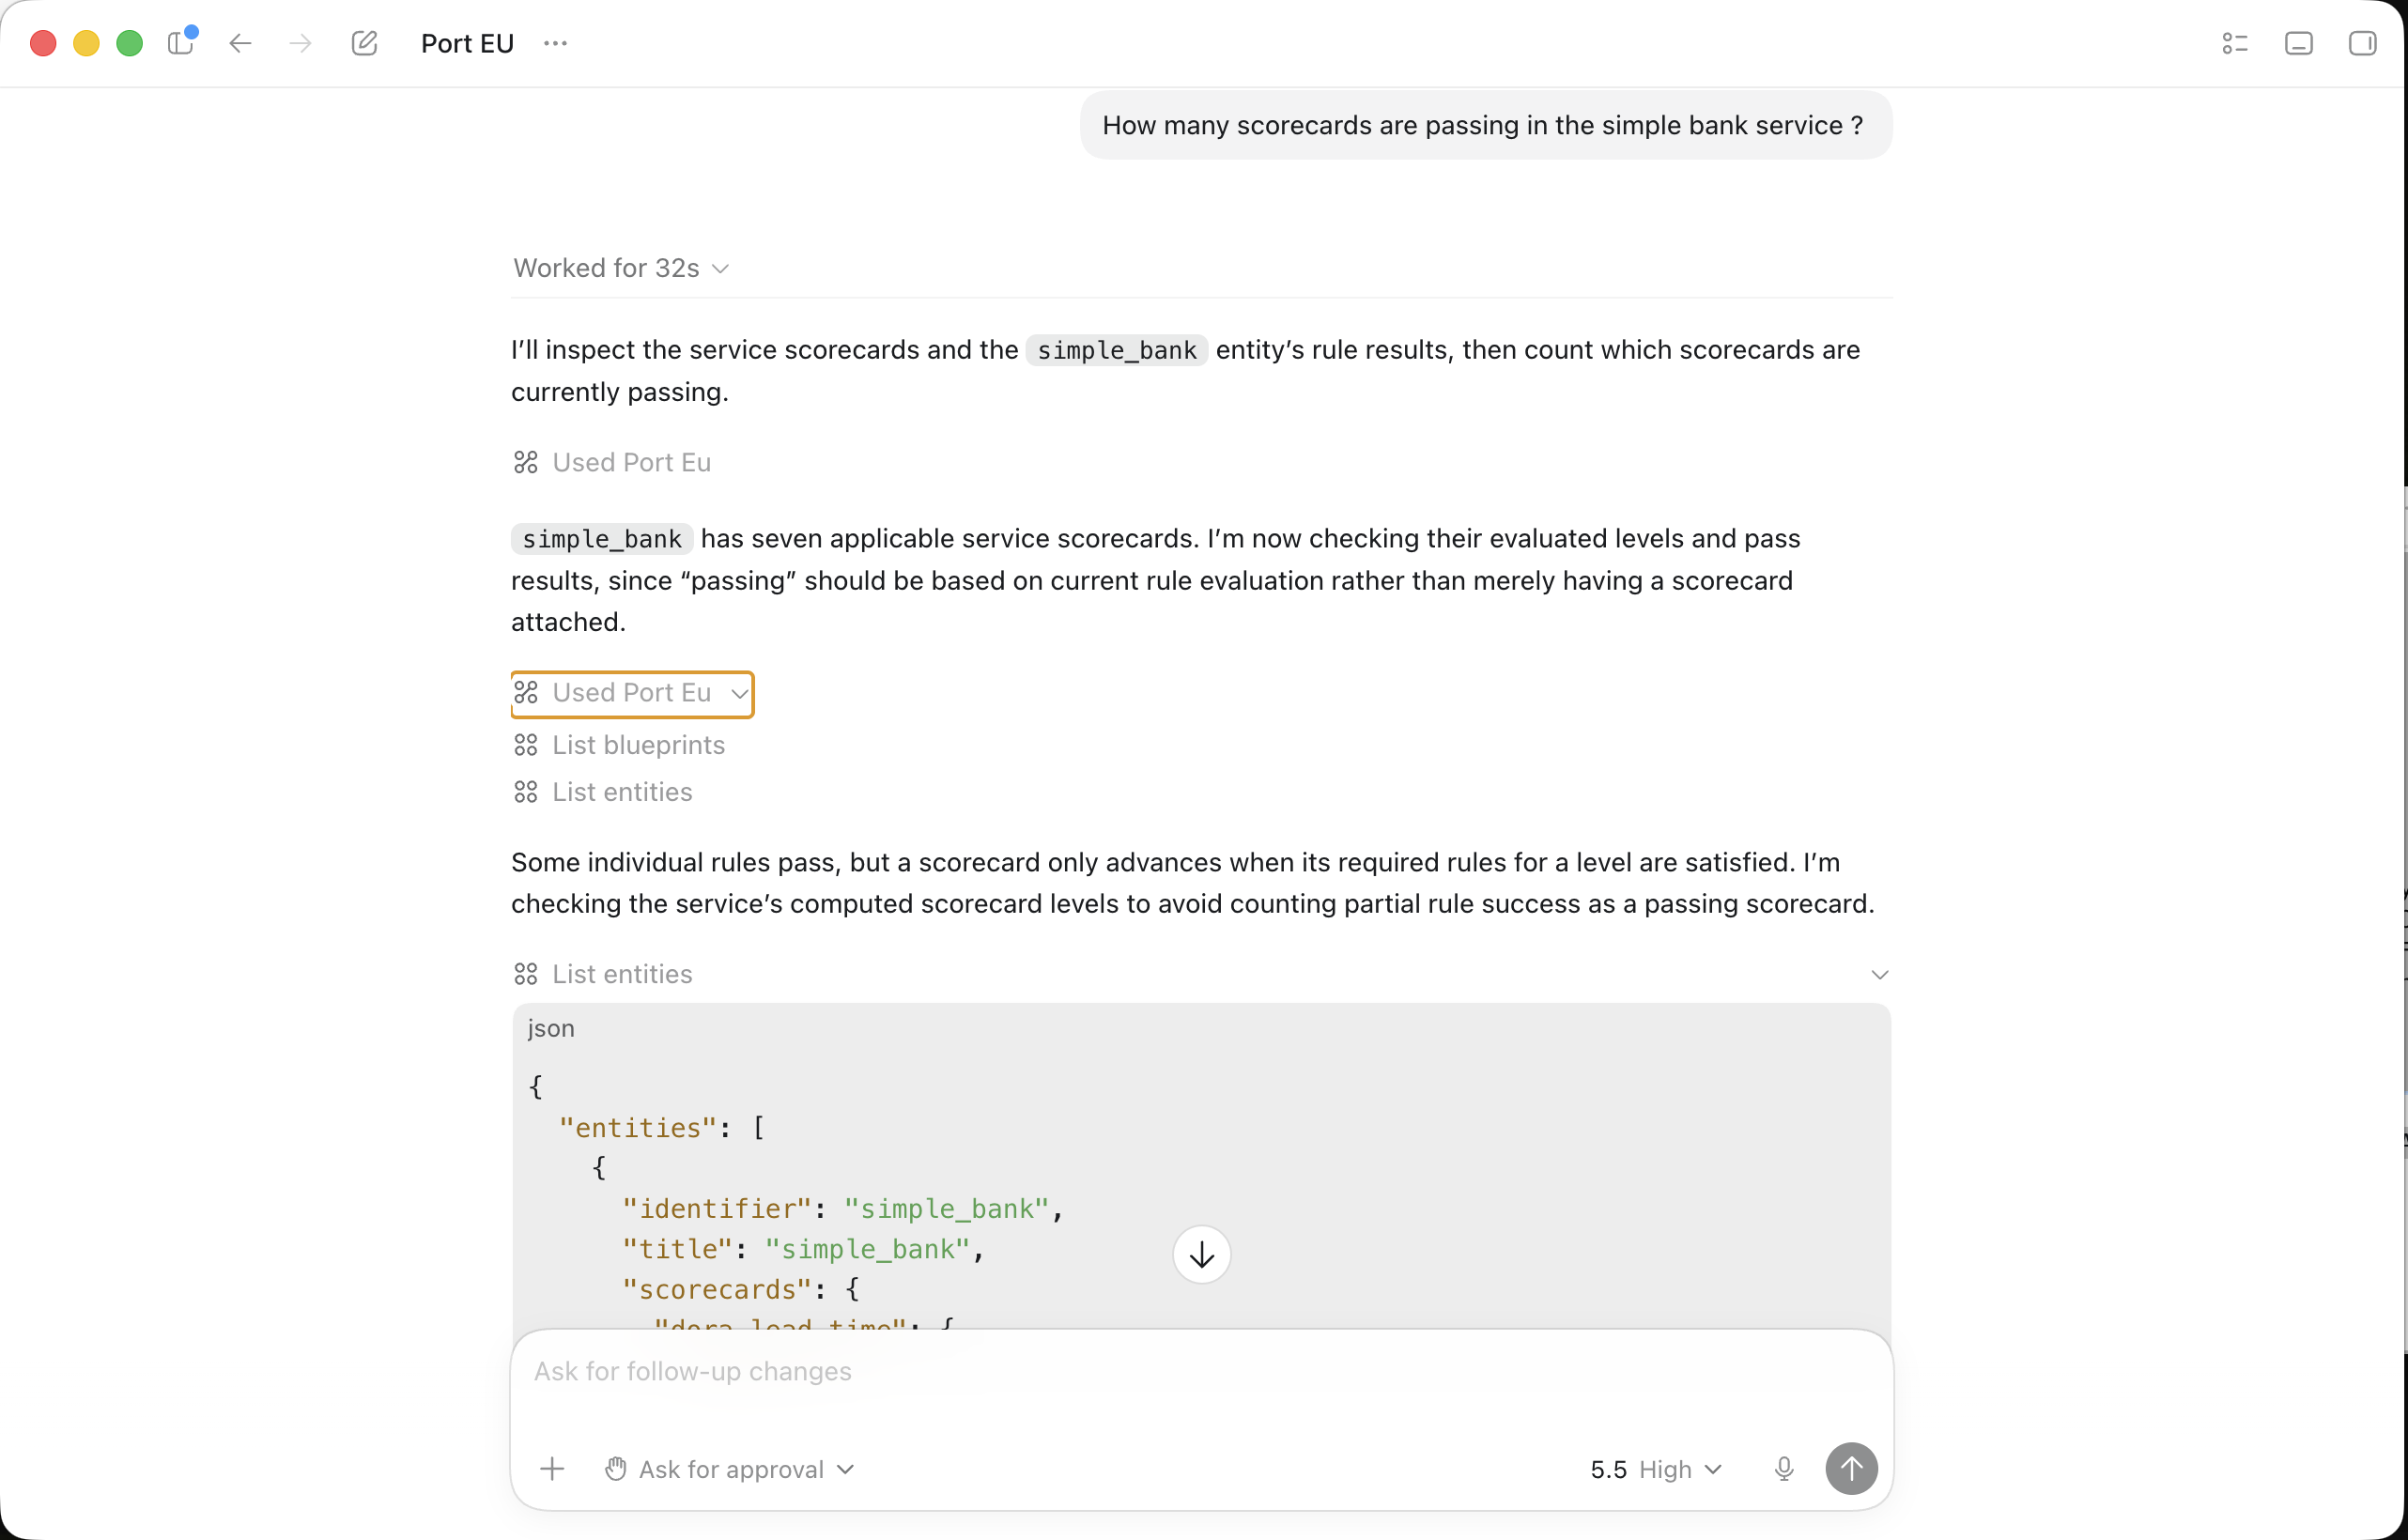
Once connected, you can interact with your Port catalog using natural language. Codex will automatically use the Port MCP tools to fulfill your requests. Try these example prompts:
- "Show me all services owned by the backend team"
- "What scorecards are failing for my production services?"
- "Who is the owner of the payments service?"
Optional: Configure Codex manually
You can also add the MCP server directly to your ~/.codex/config.toml file:
[mcp_servers.port-eu]
url = "https://mcp.port.io/v1"
enabled = true
If your Port organization is in the US region, replace port-eu and https://mcp.port.io/v1 with port-us and https://mcp.us.port.io/v1.
After editing the file, run the matching codex mcp login command from step 4.
You can restrict Codex to read-only Port tools by adding the x-read-only-mode header to your Codex MCP configuration. See the MCP server headers section for the full configuration.
Let's test the queries
Once you have the MCP server configured, you can start using natural language to query your DORA metrics.
Start a new chat session
- Open a new chat session in Cursor (Cmd/Ctrl + L).
- You should see the Port tools available in the tools panel.
- Start your conversation with DORA metrics queries.
Example DORA metrics queries
Here are practical examples of questions you can ask to get insights from your DORA metrics:
Team performance analysis
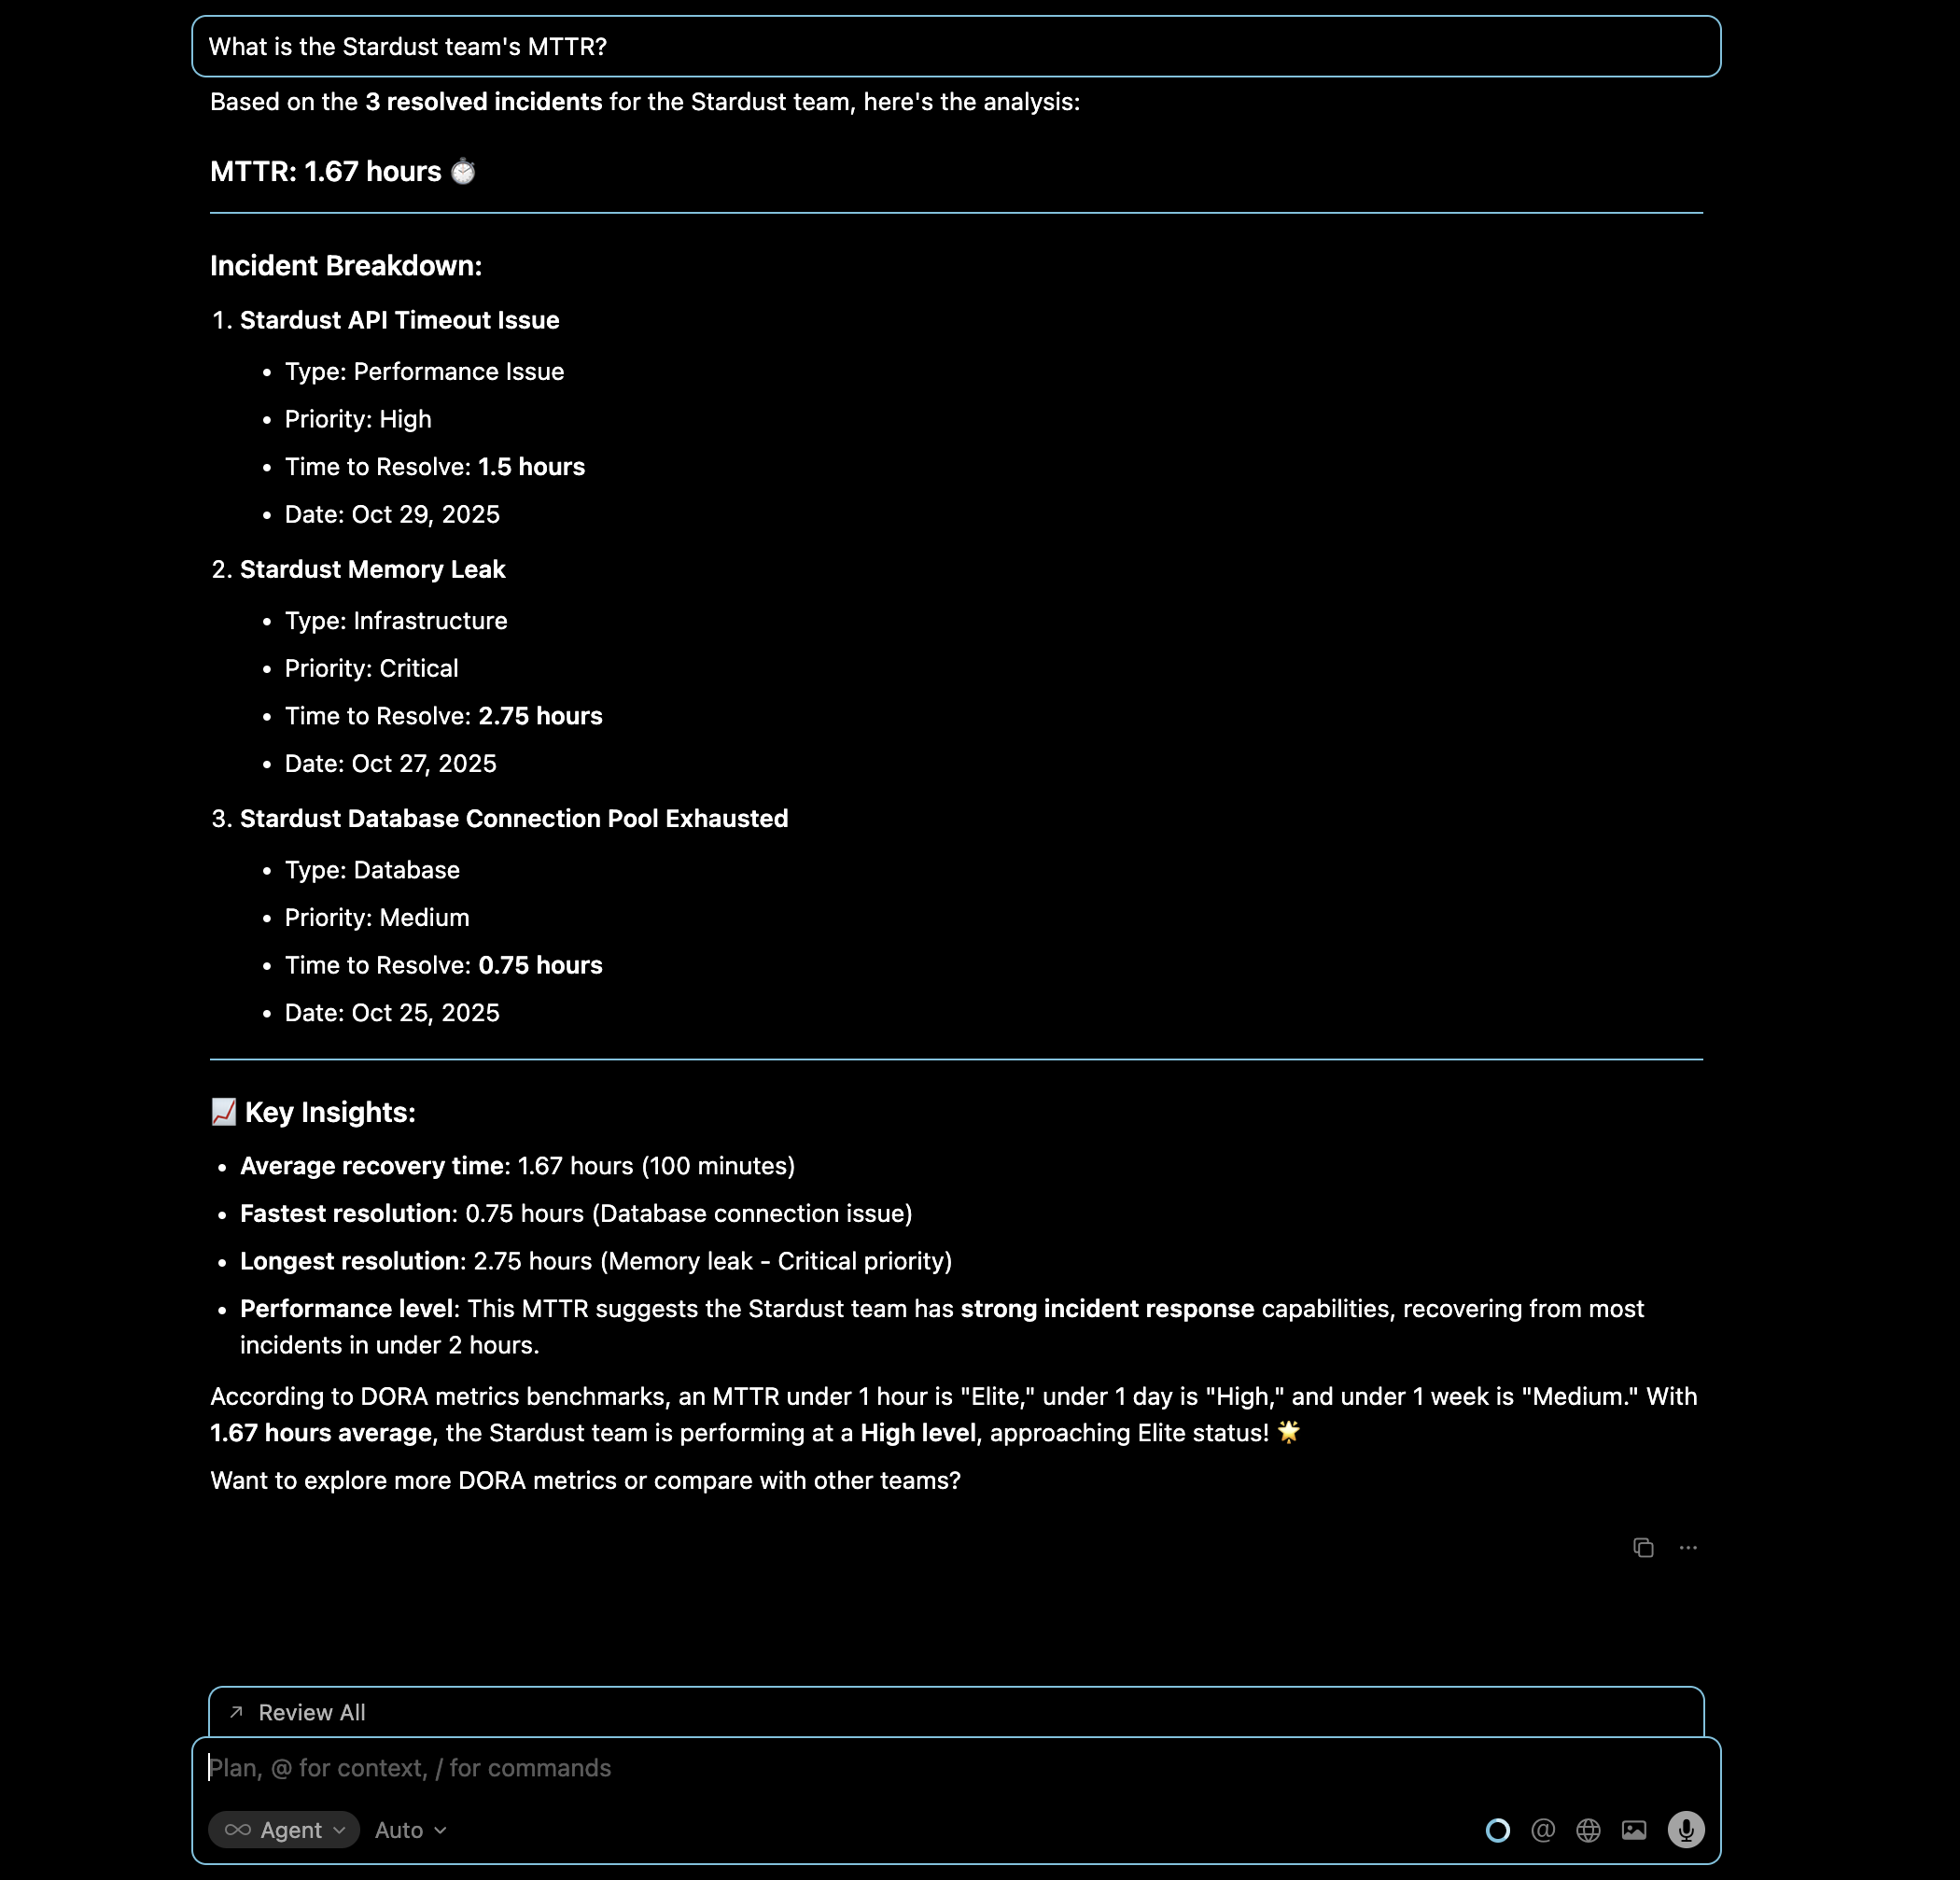
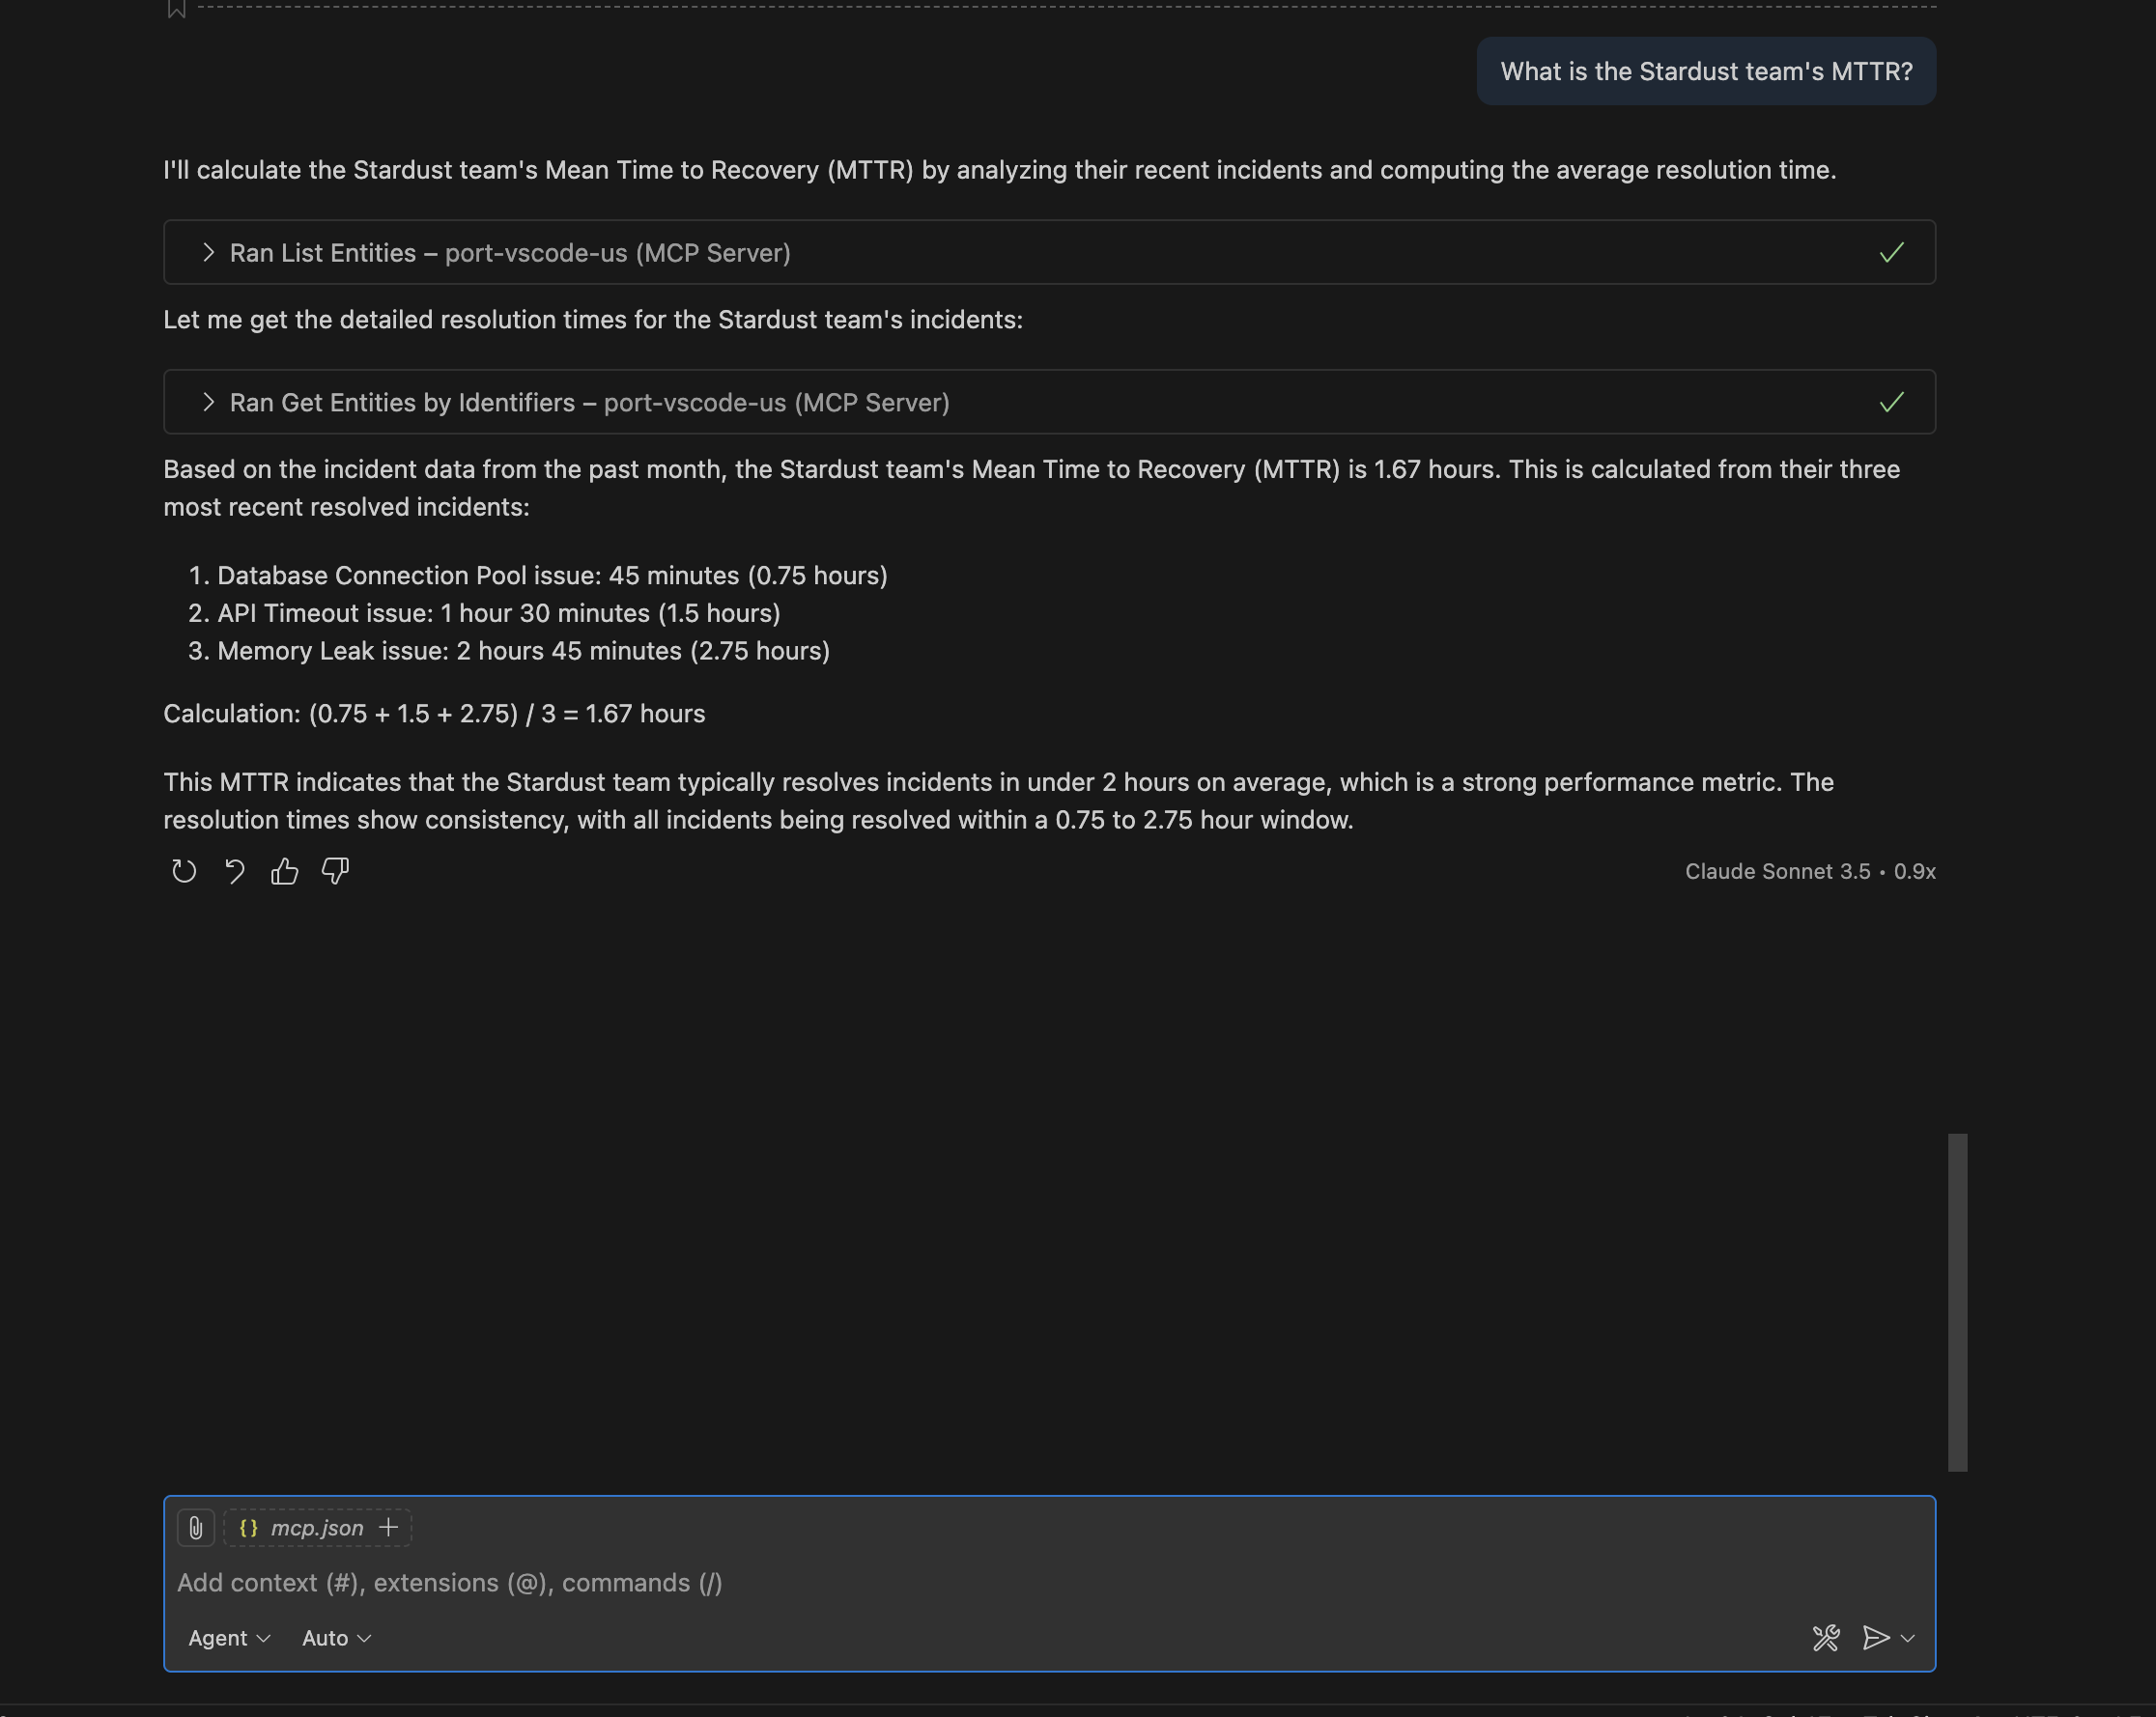
Query: "What is the Stardust team's MTTR?"
This query helps you understand how quickly the Stardust team recovers from incidents, which is crucial for assessing team reliability and incident response capabilities.
- Cursor IDE
- VS Code
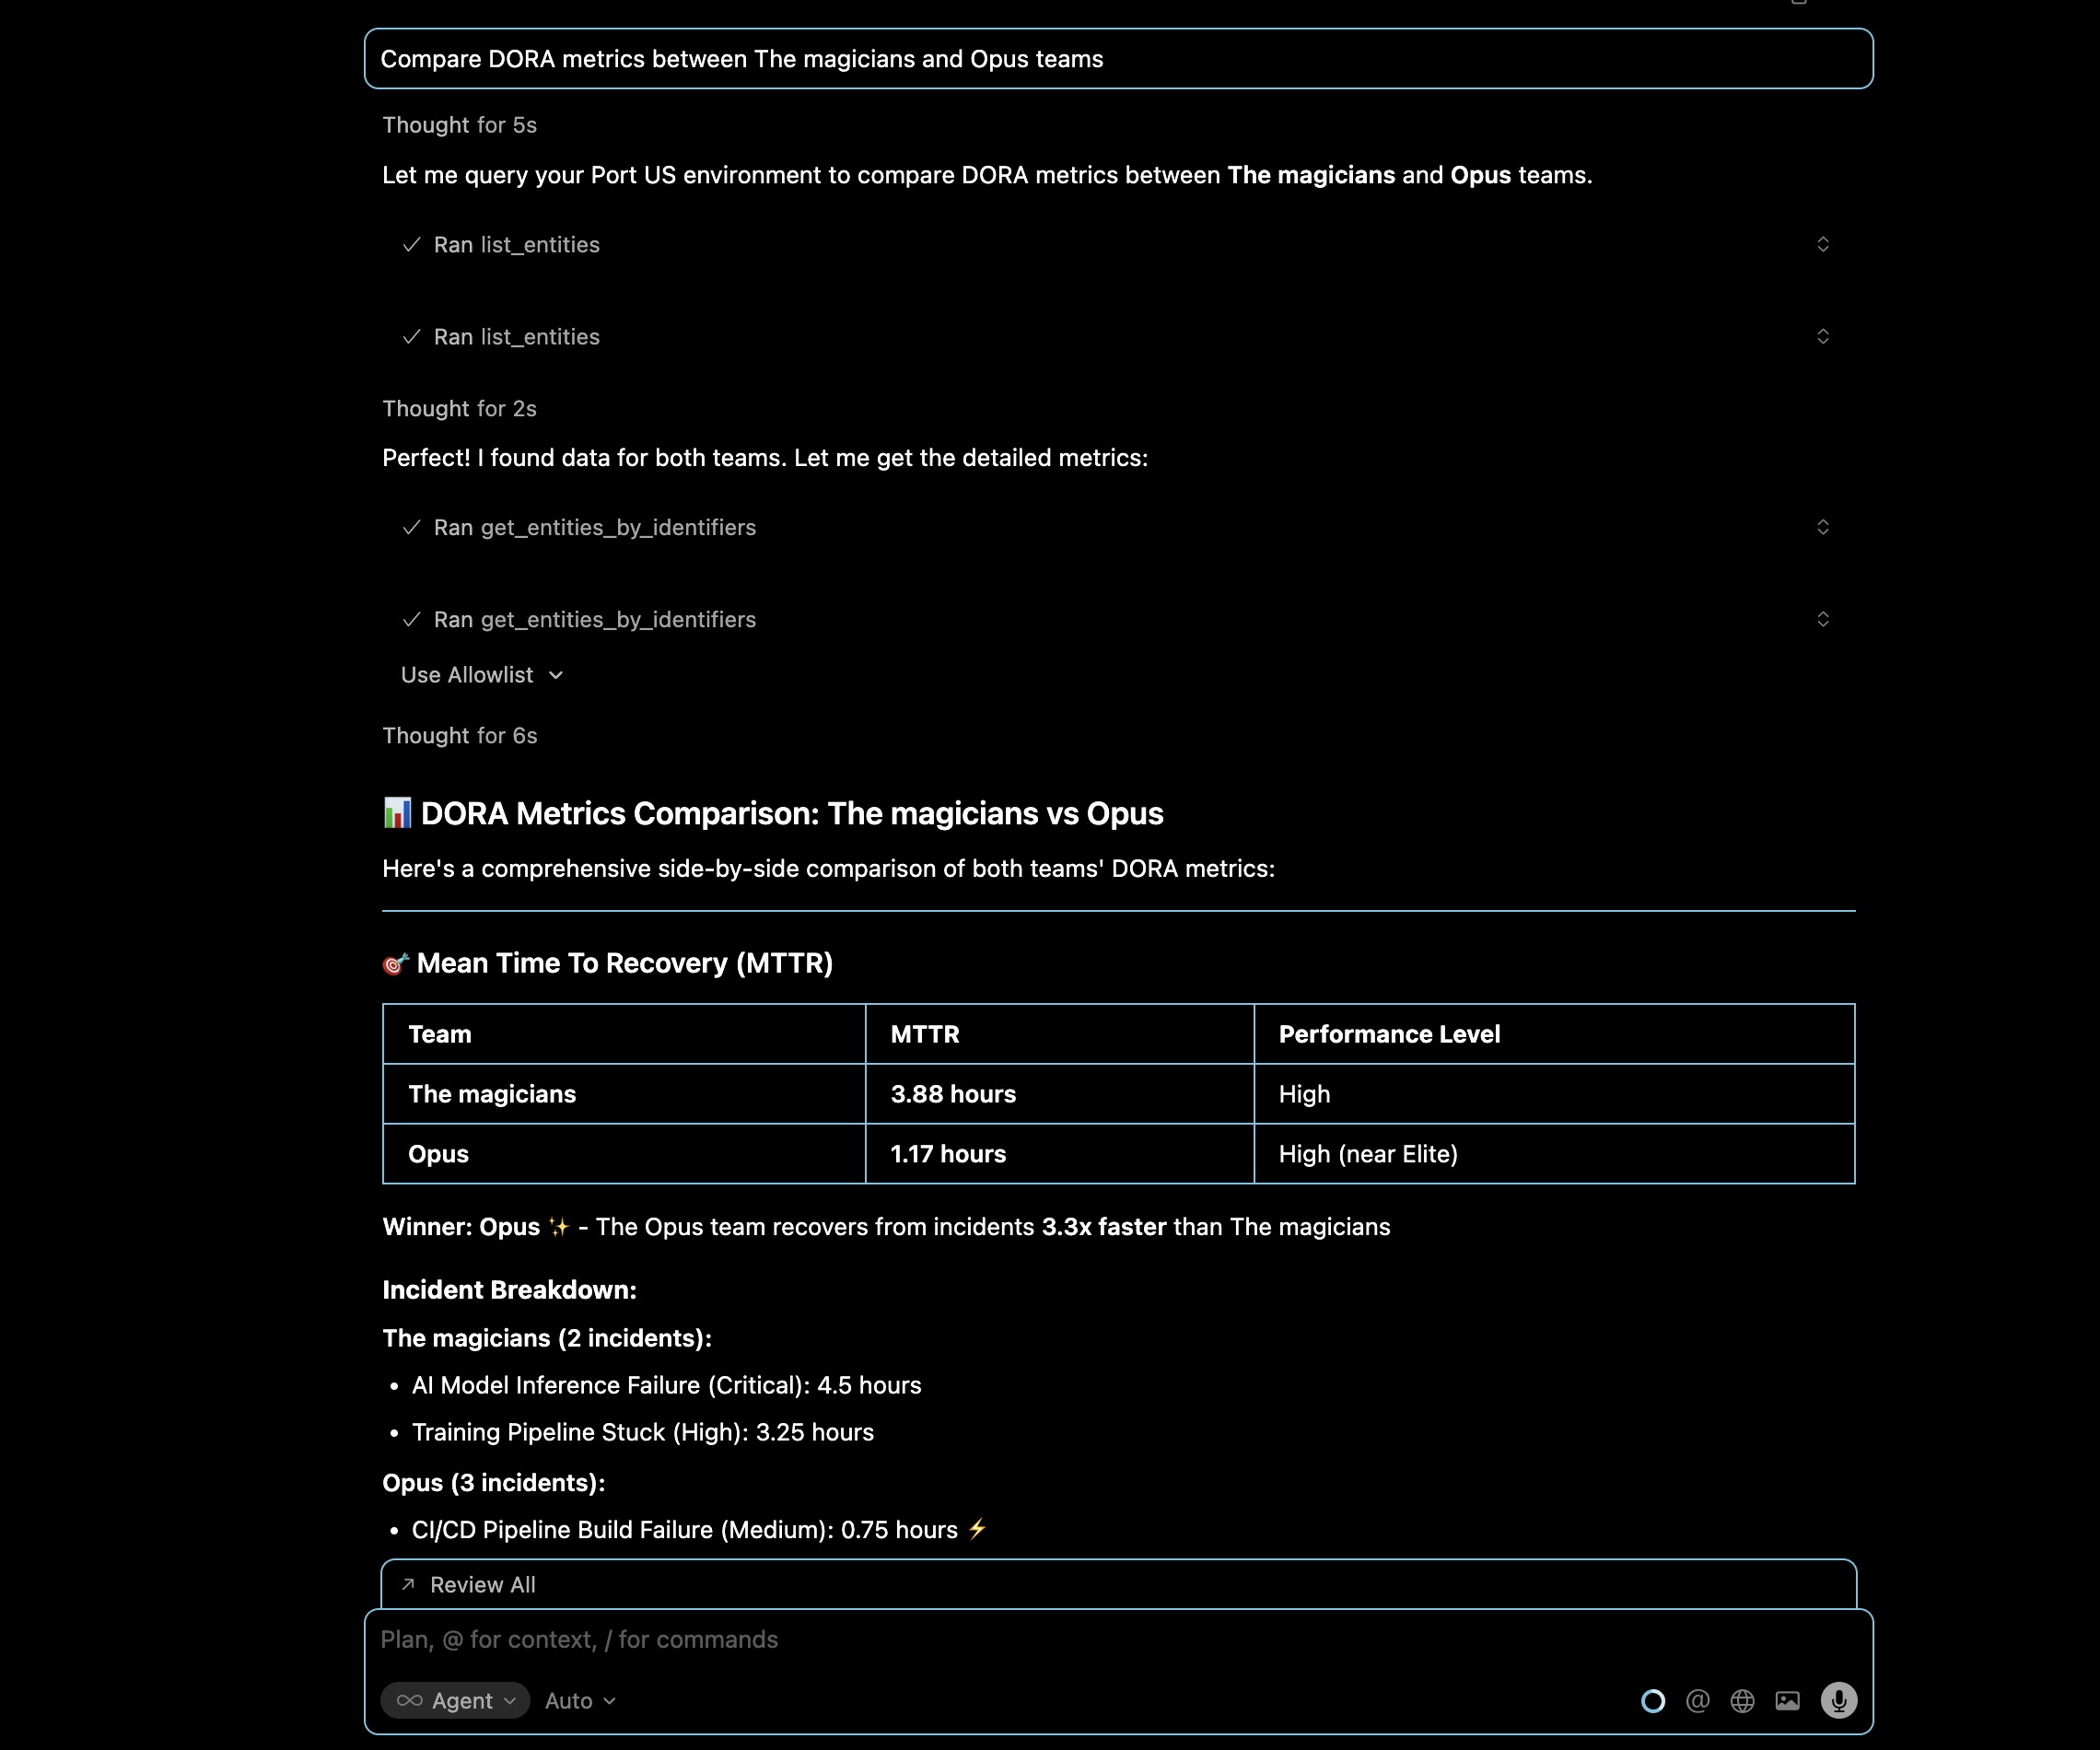
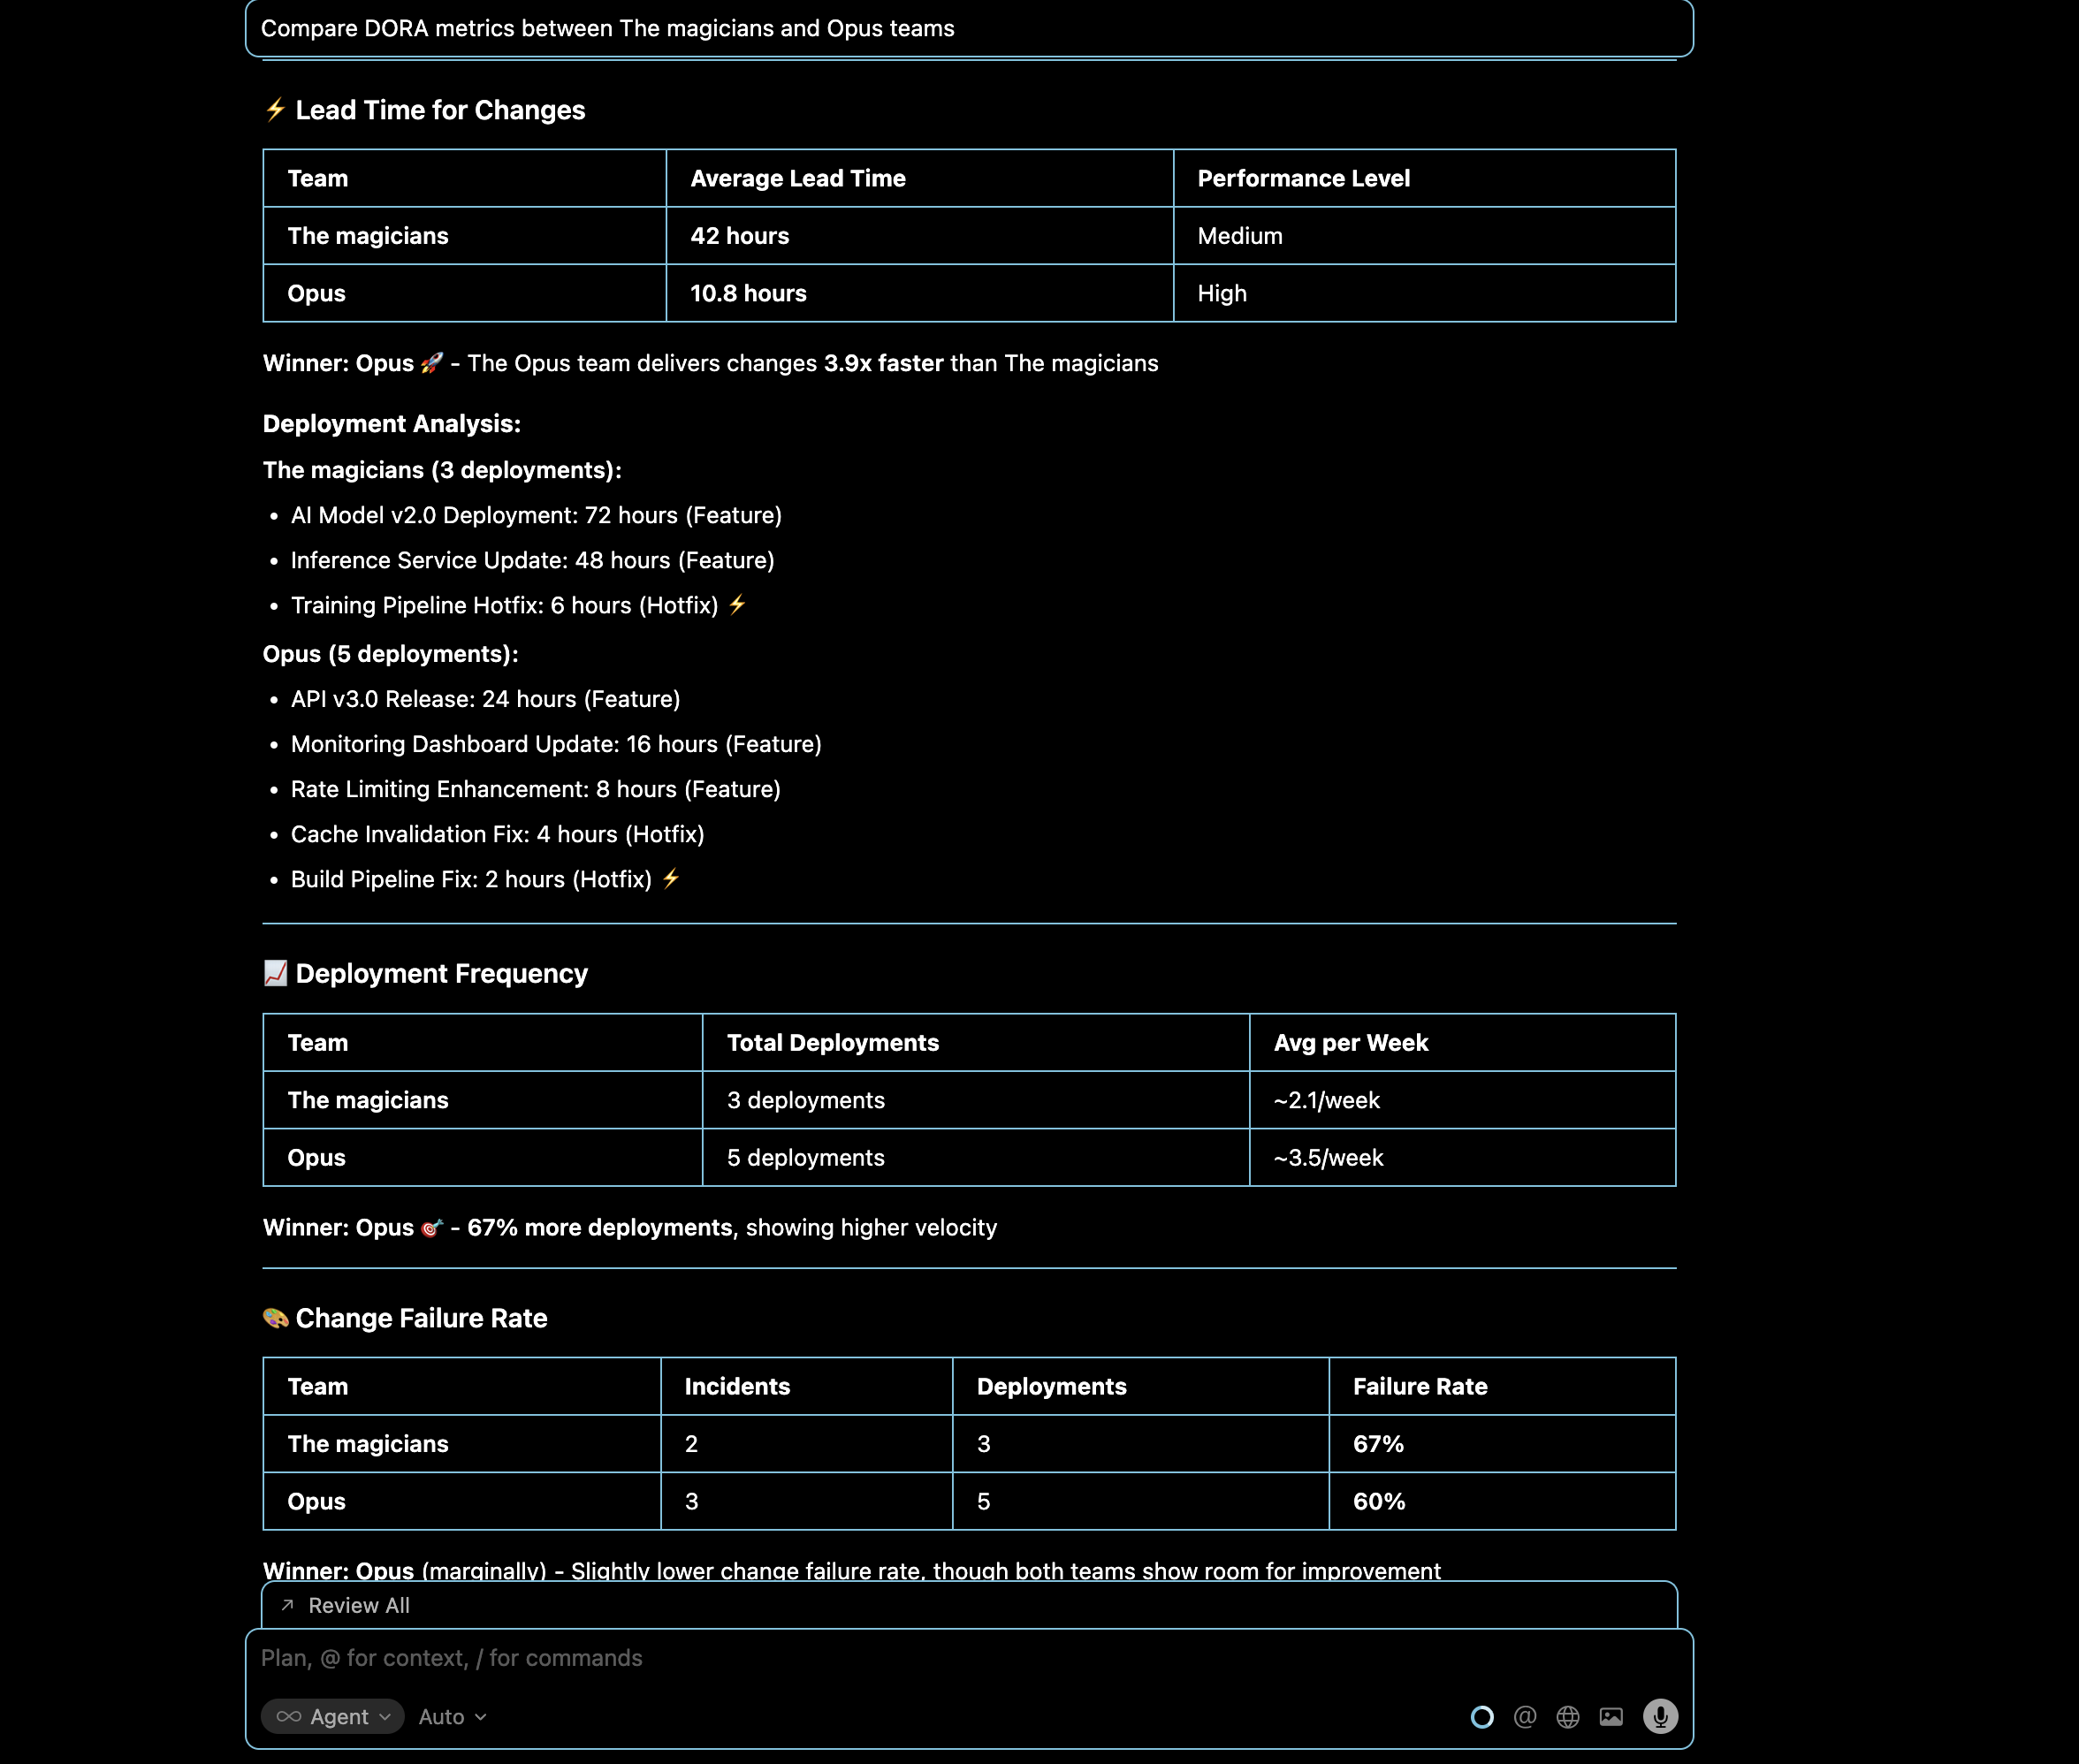
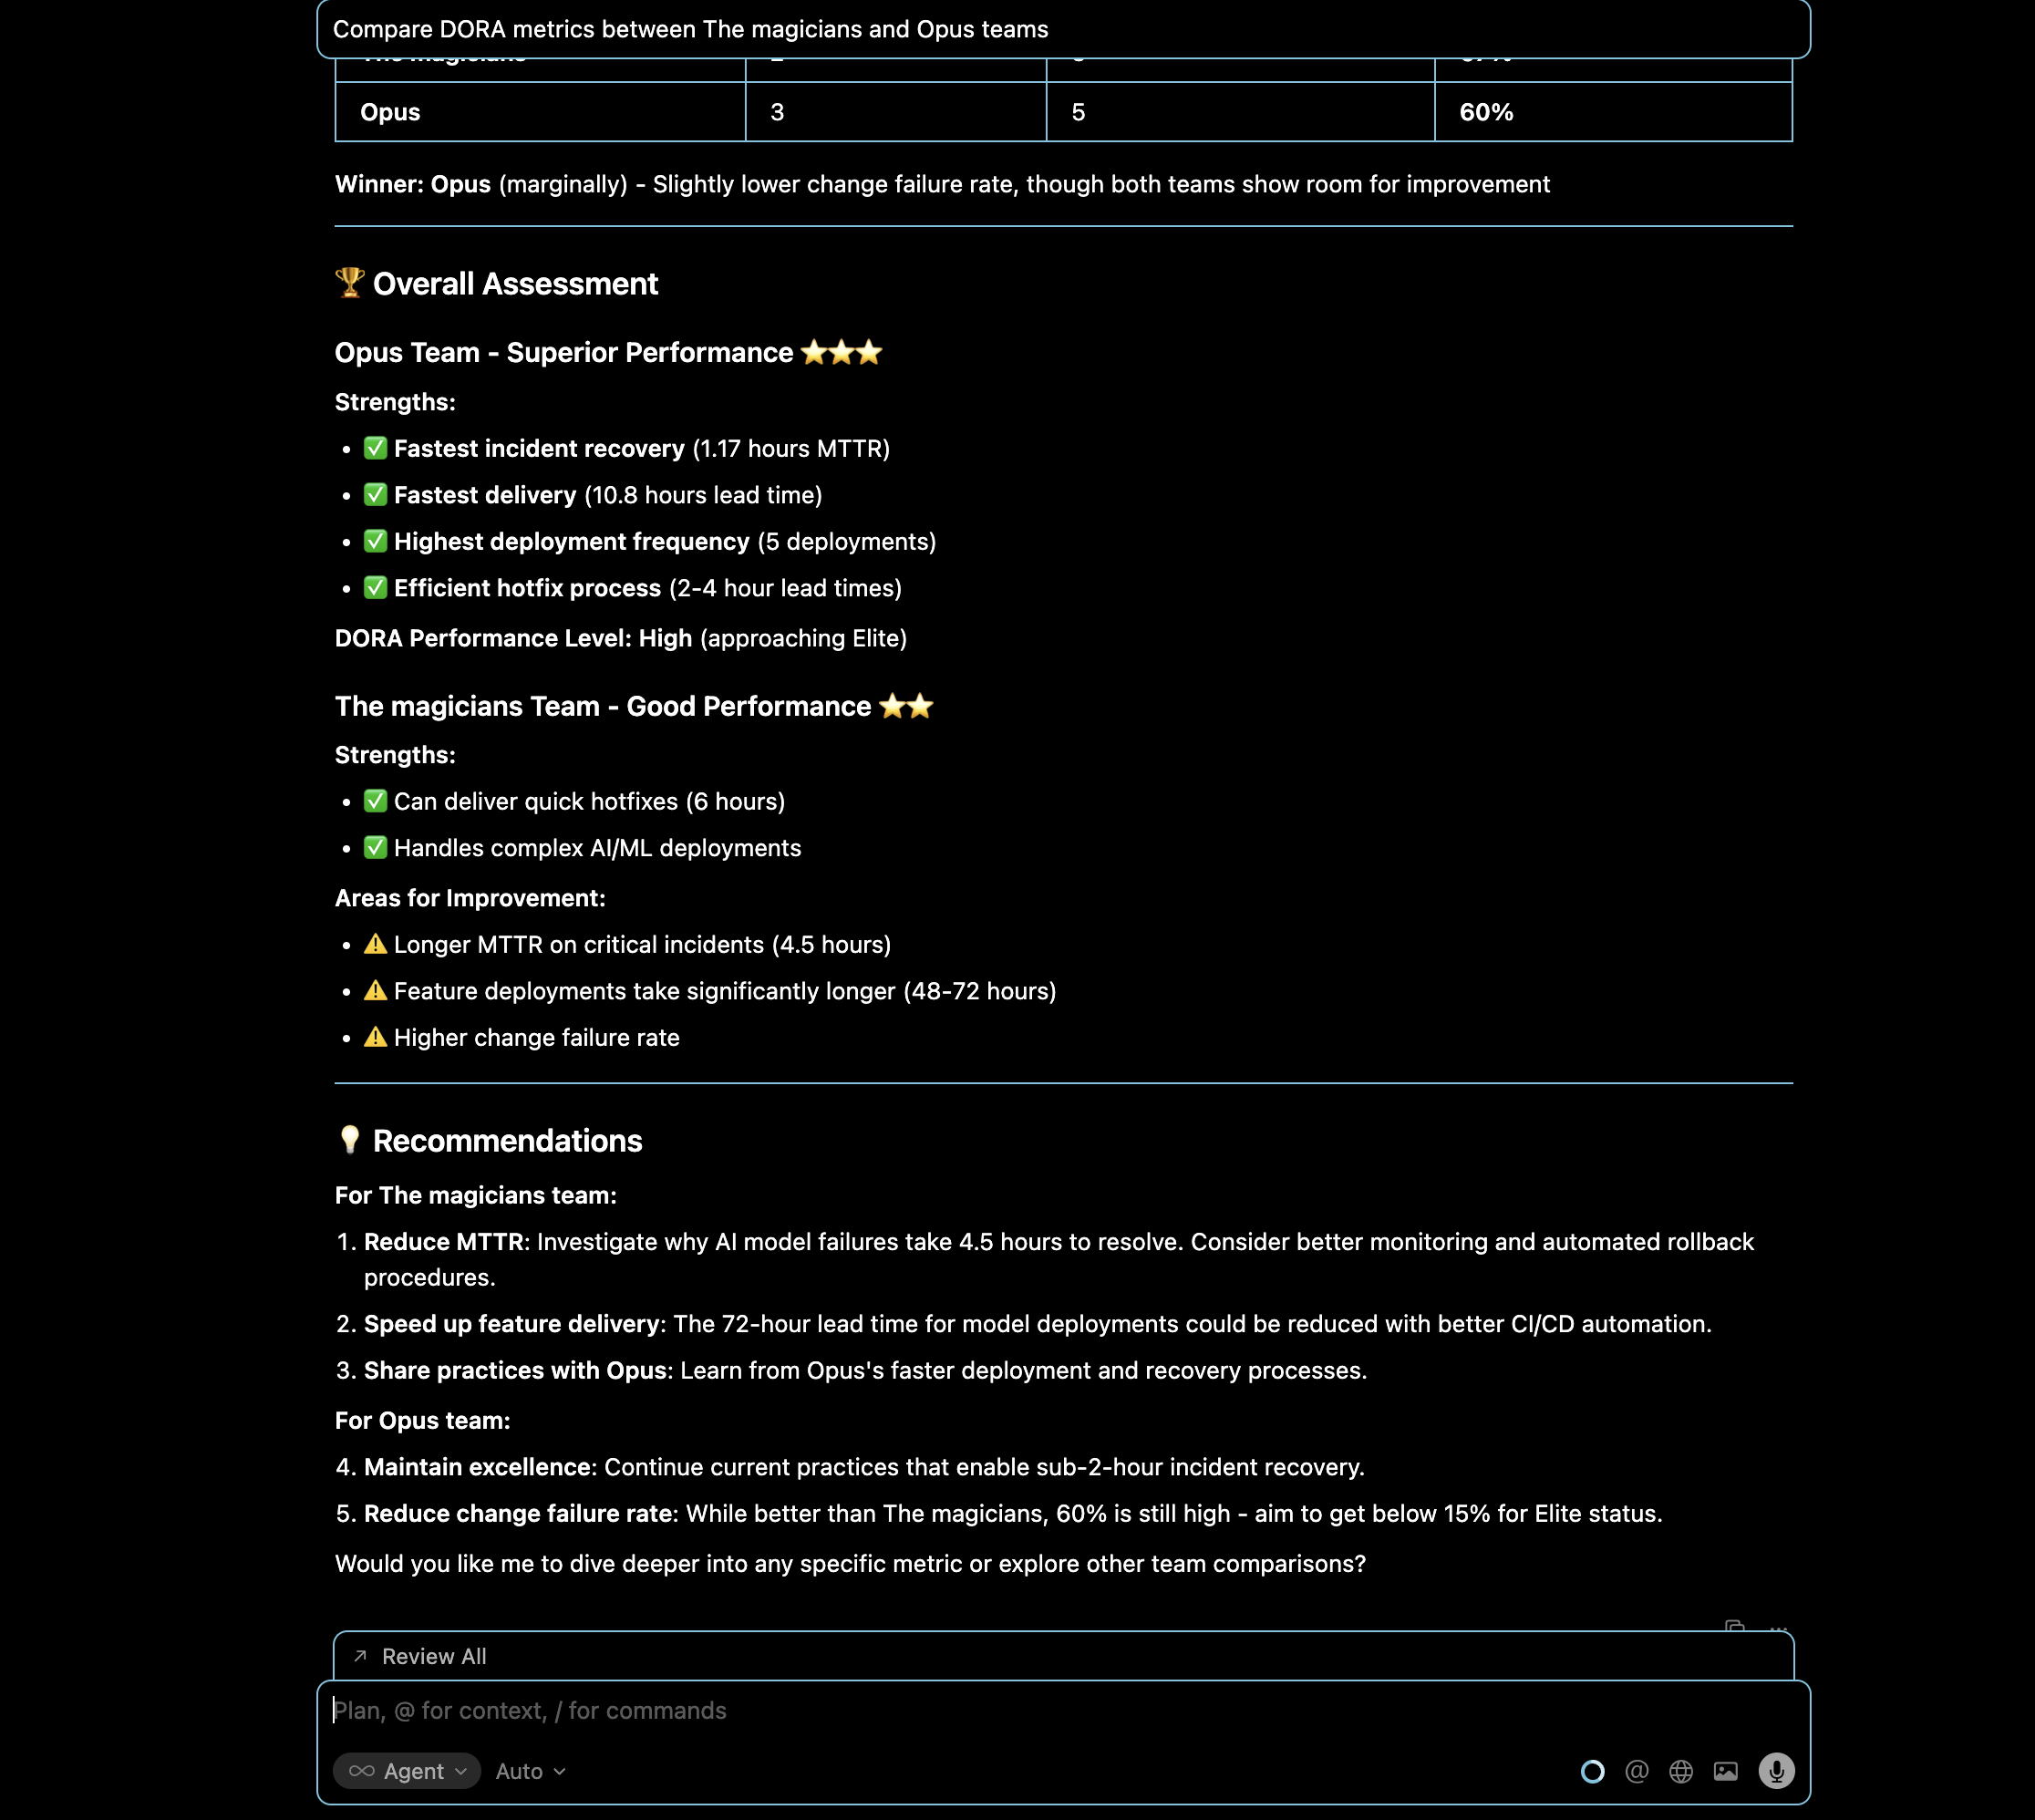
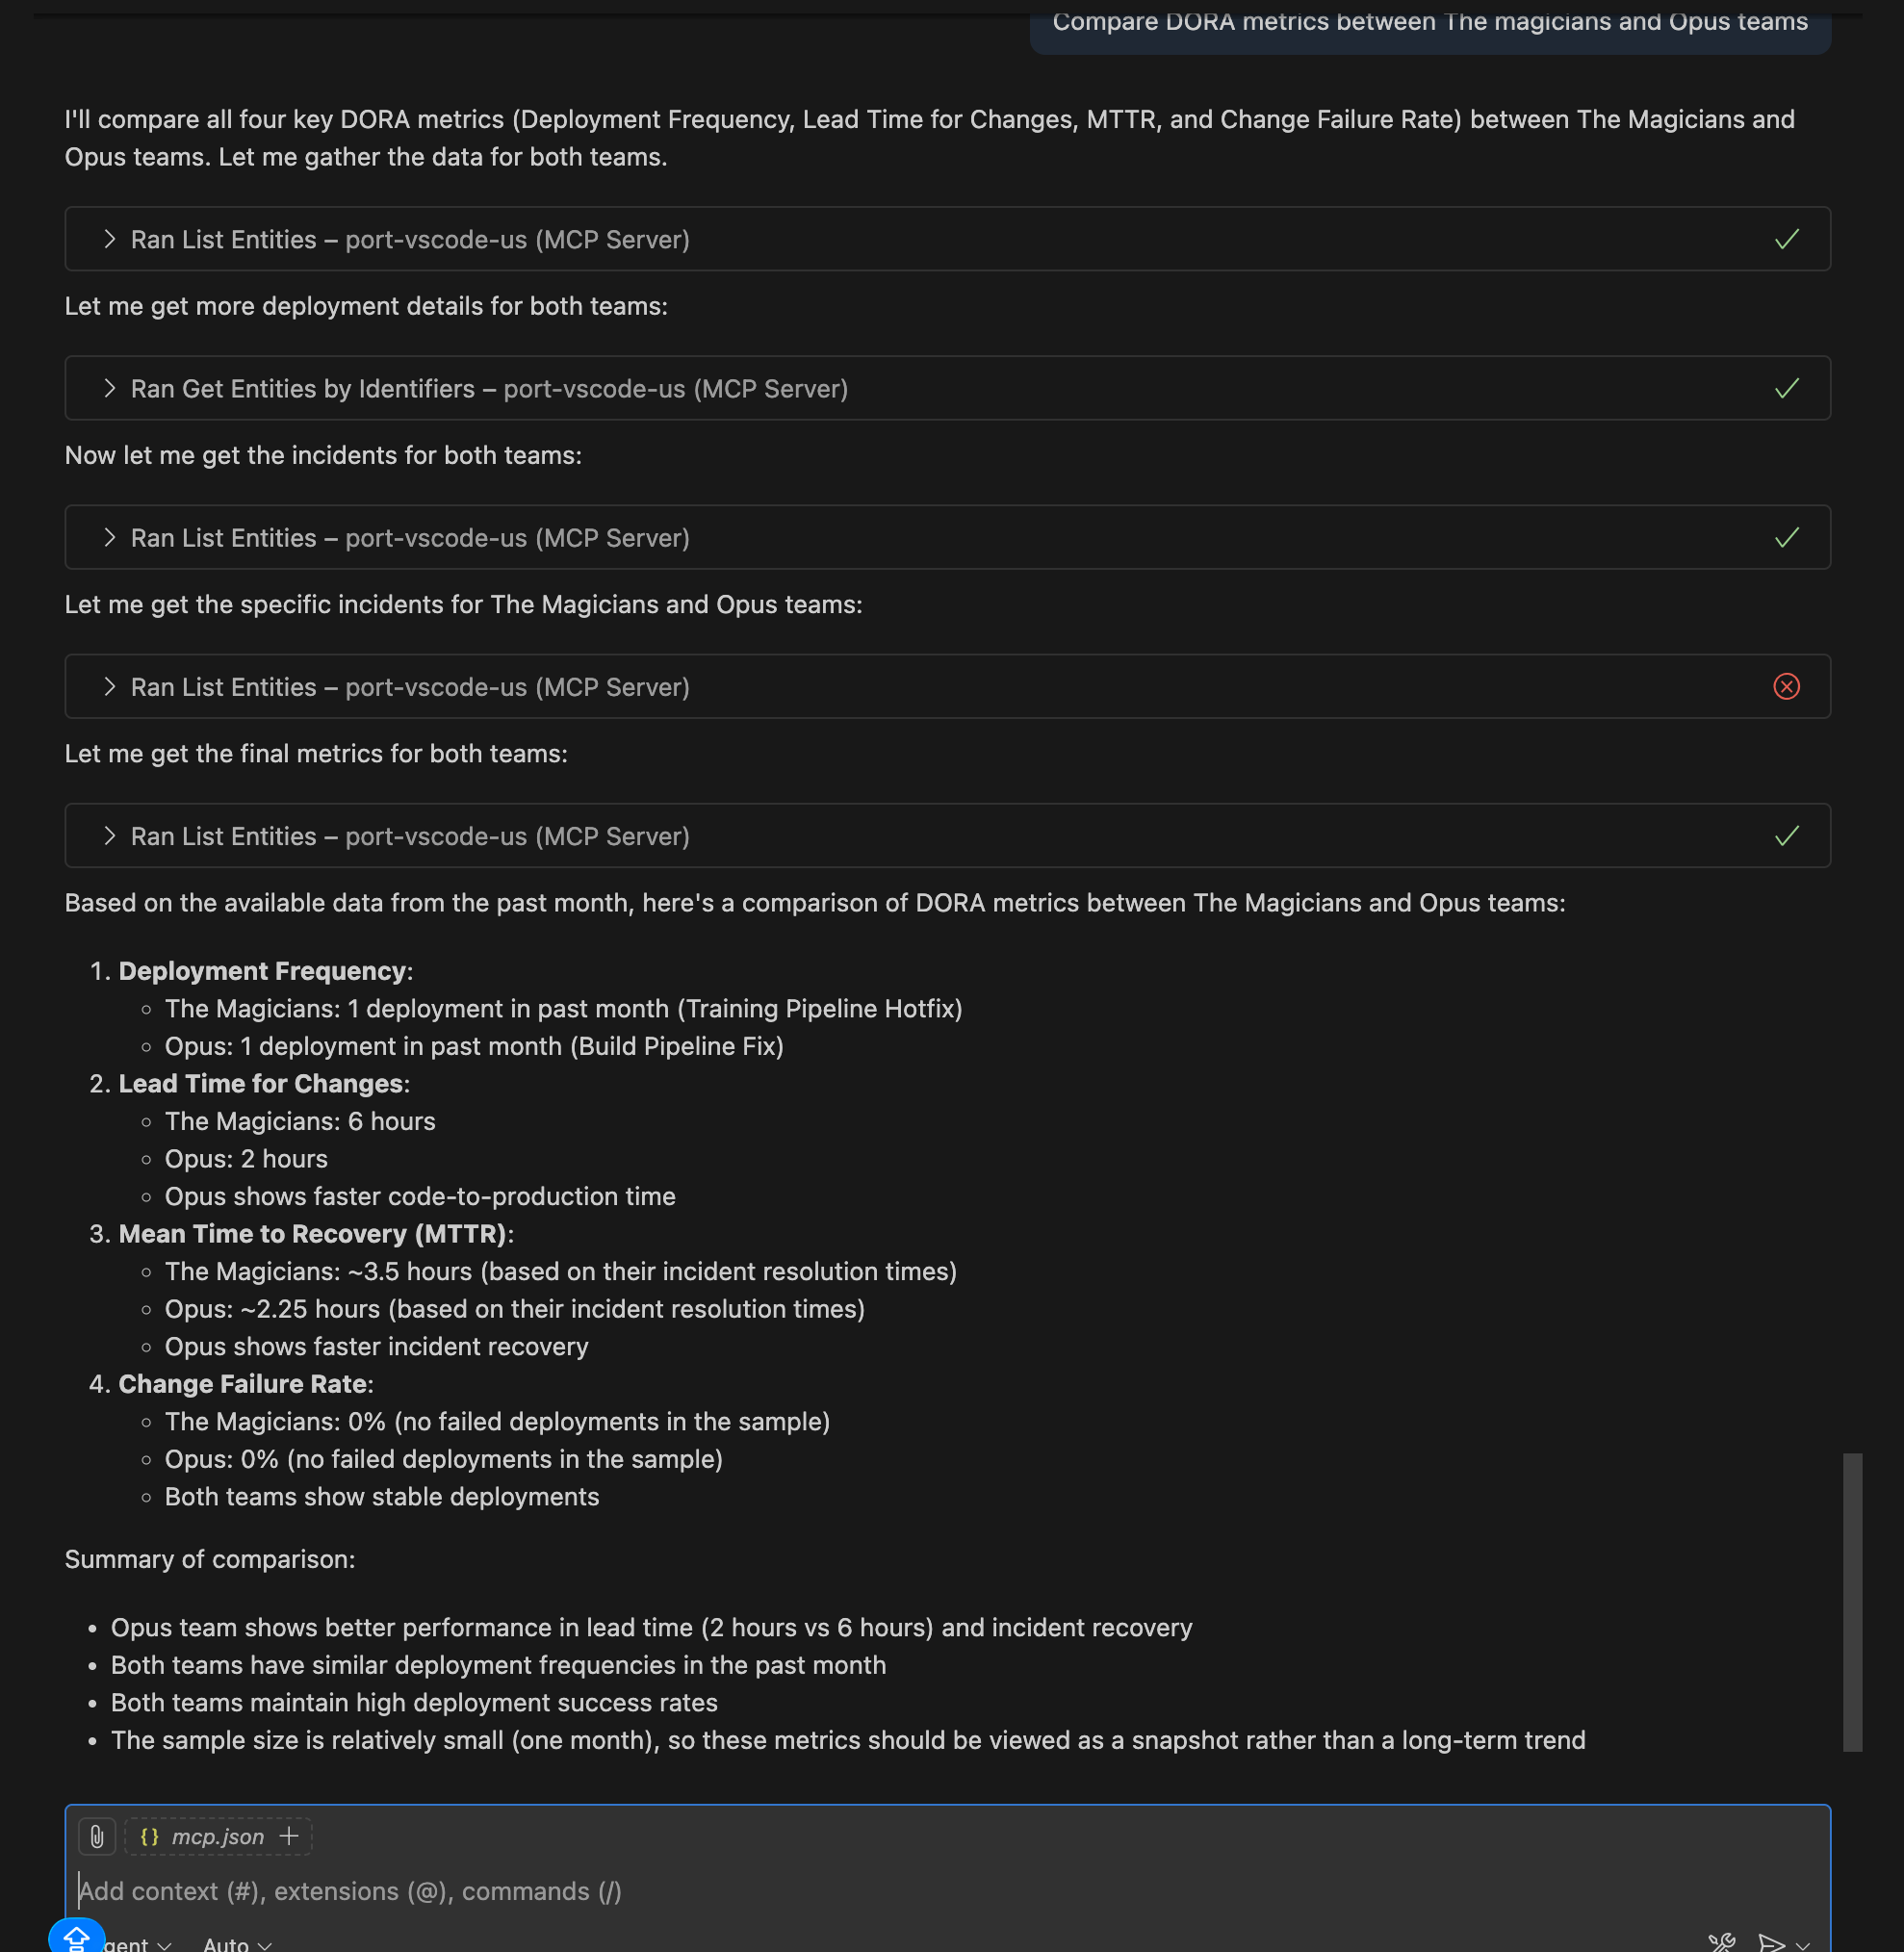
Query: "Compare DORA metrics between The magicians and Opus teams"
Compare deployment frequency, lead time, and incident metrics between two teams to identify performance differences and opportunities to share best practices.
- Cursor IDE
- VS Code
Deployment analysis
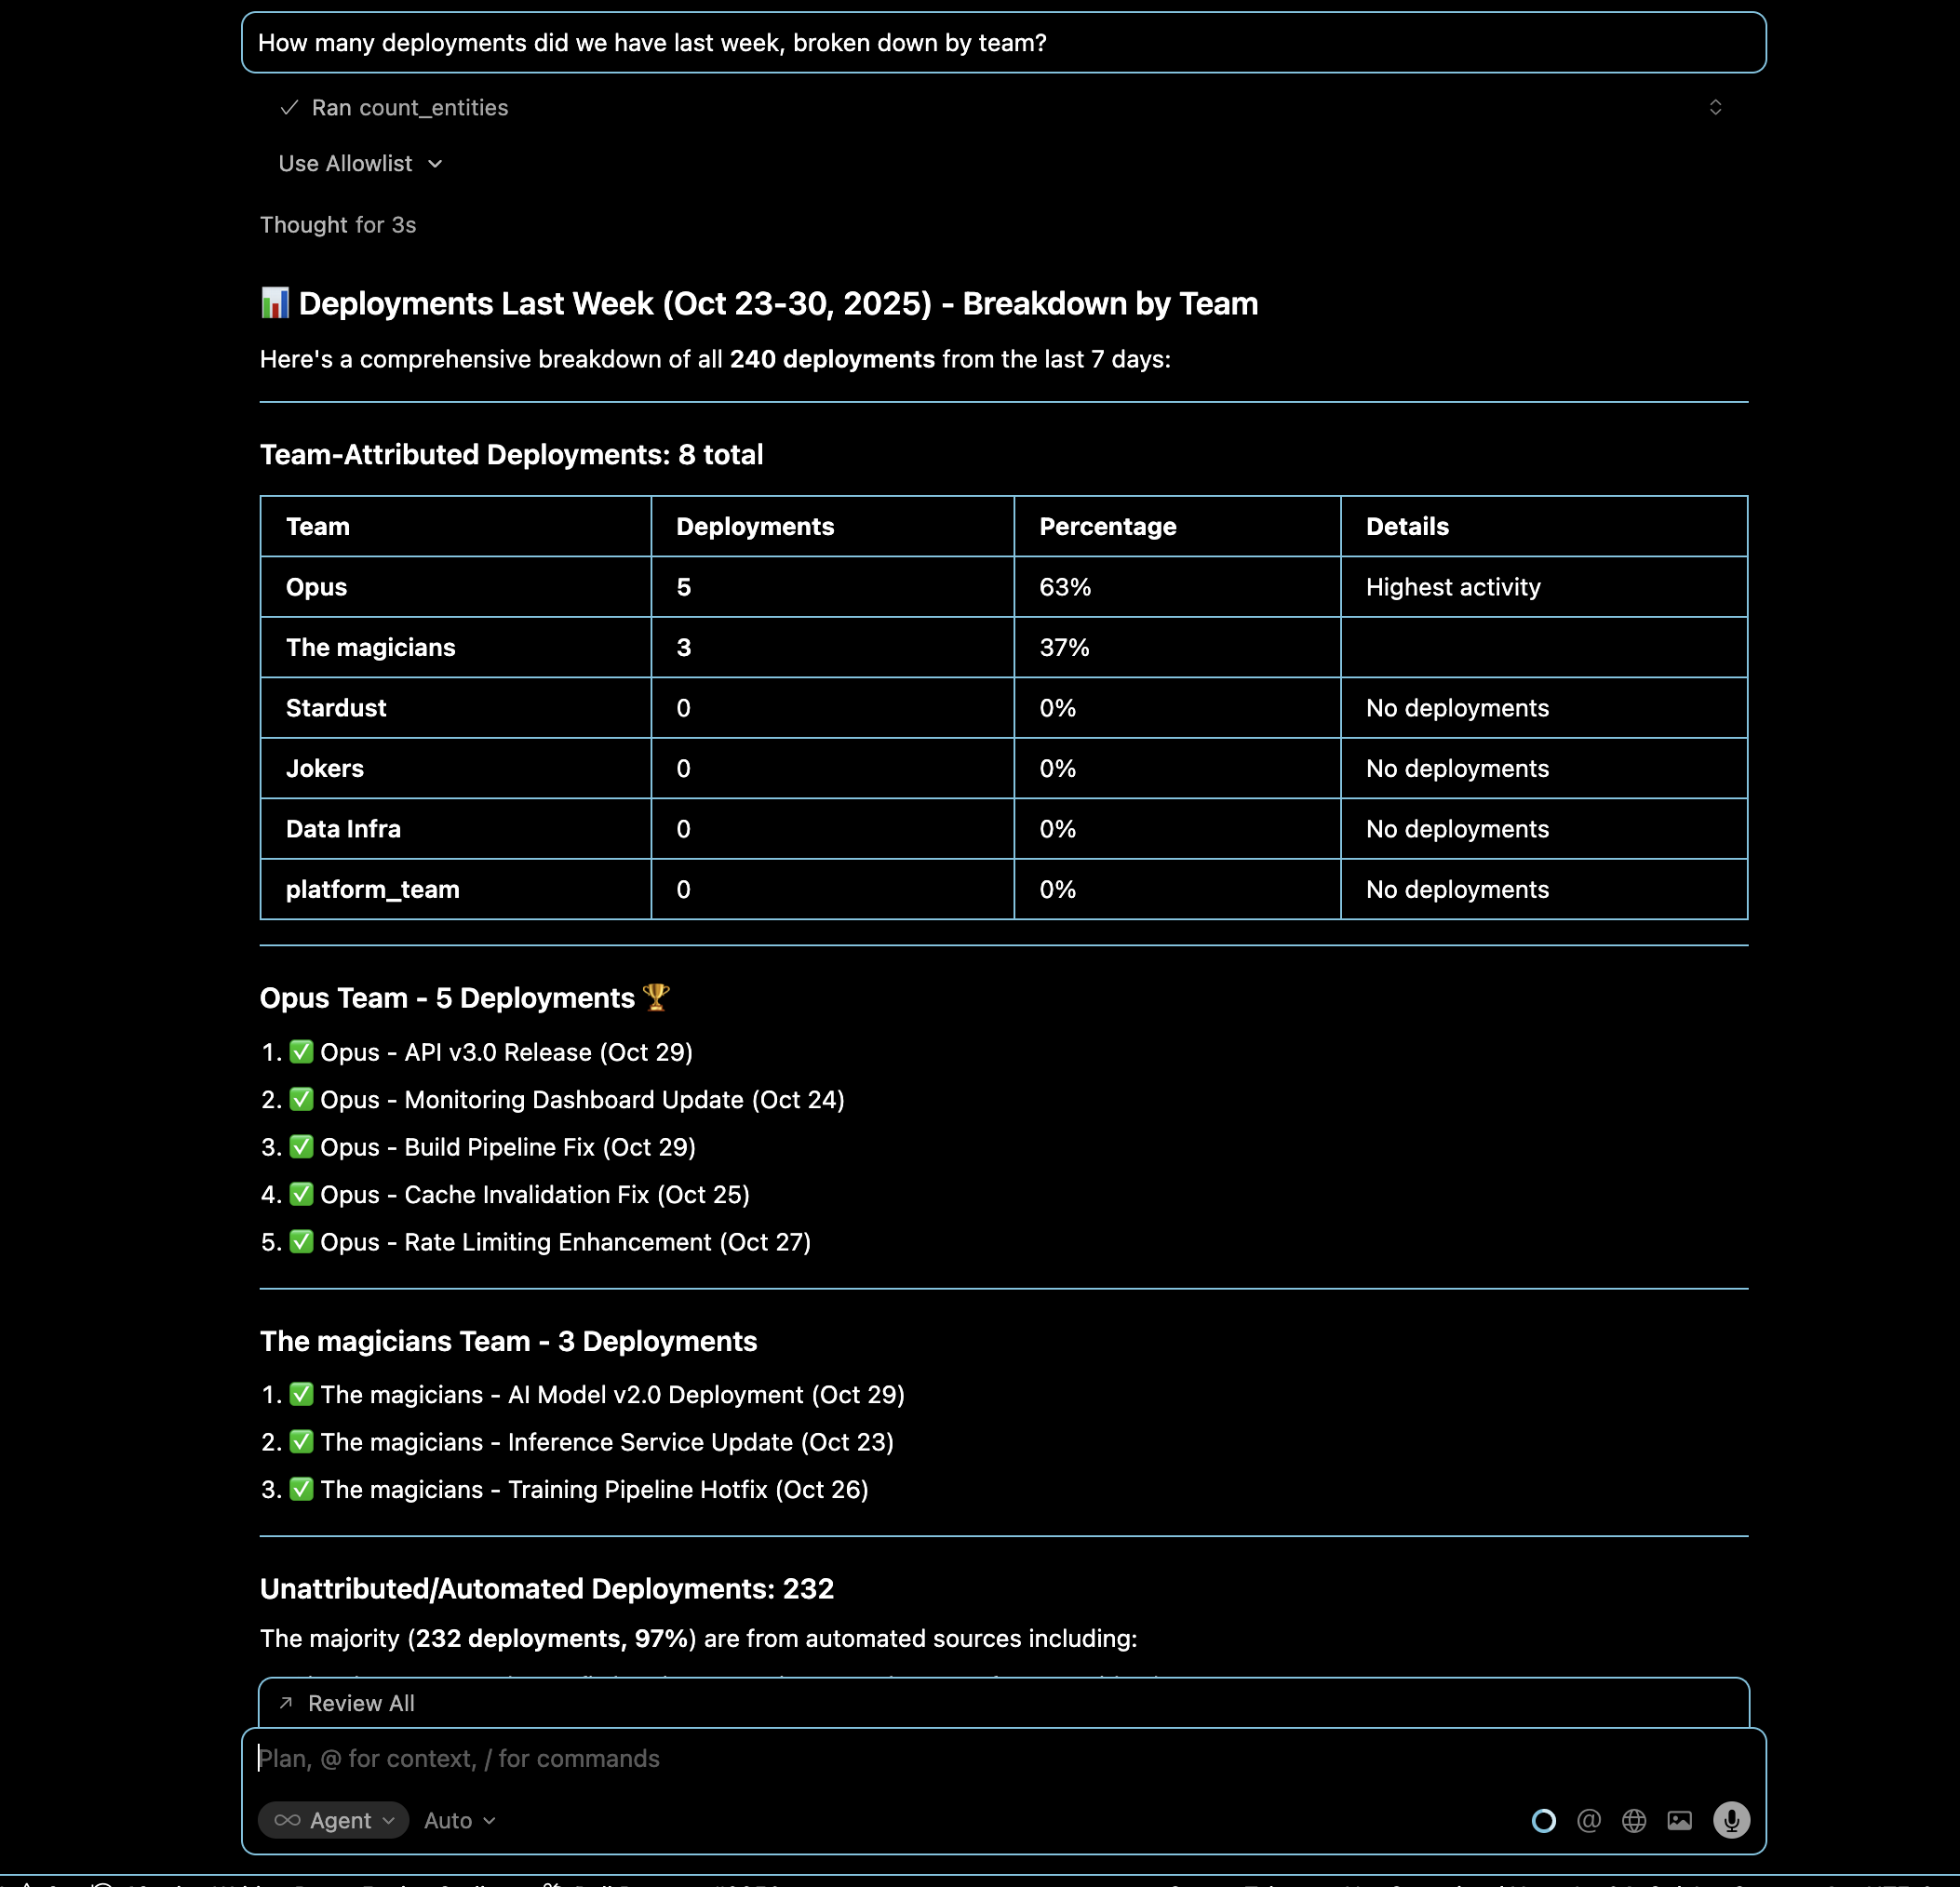
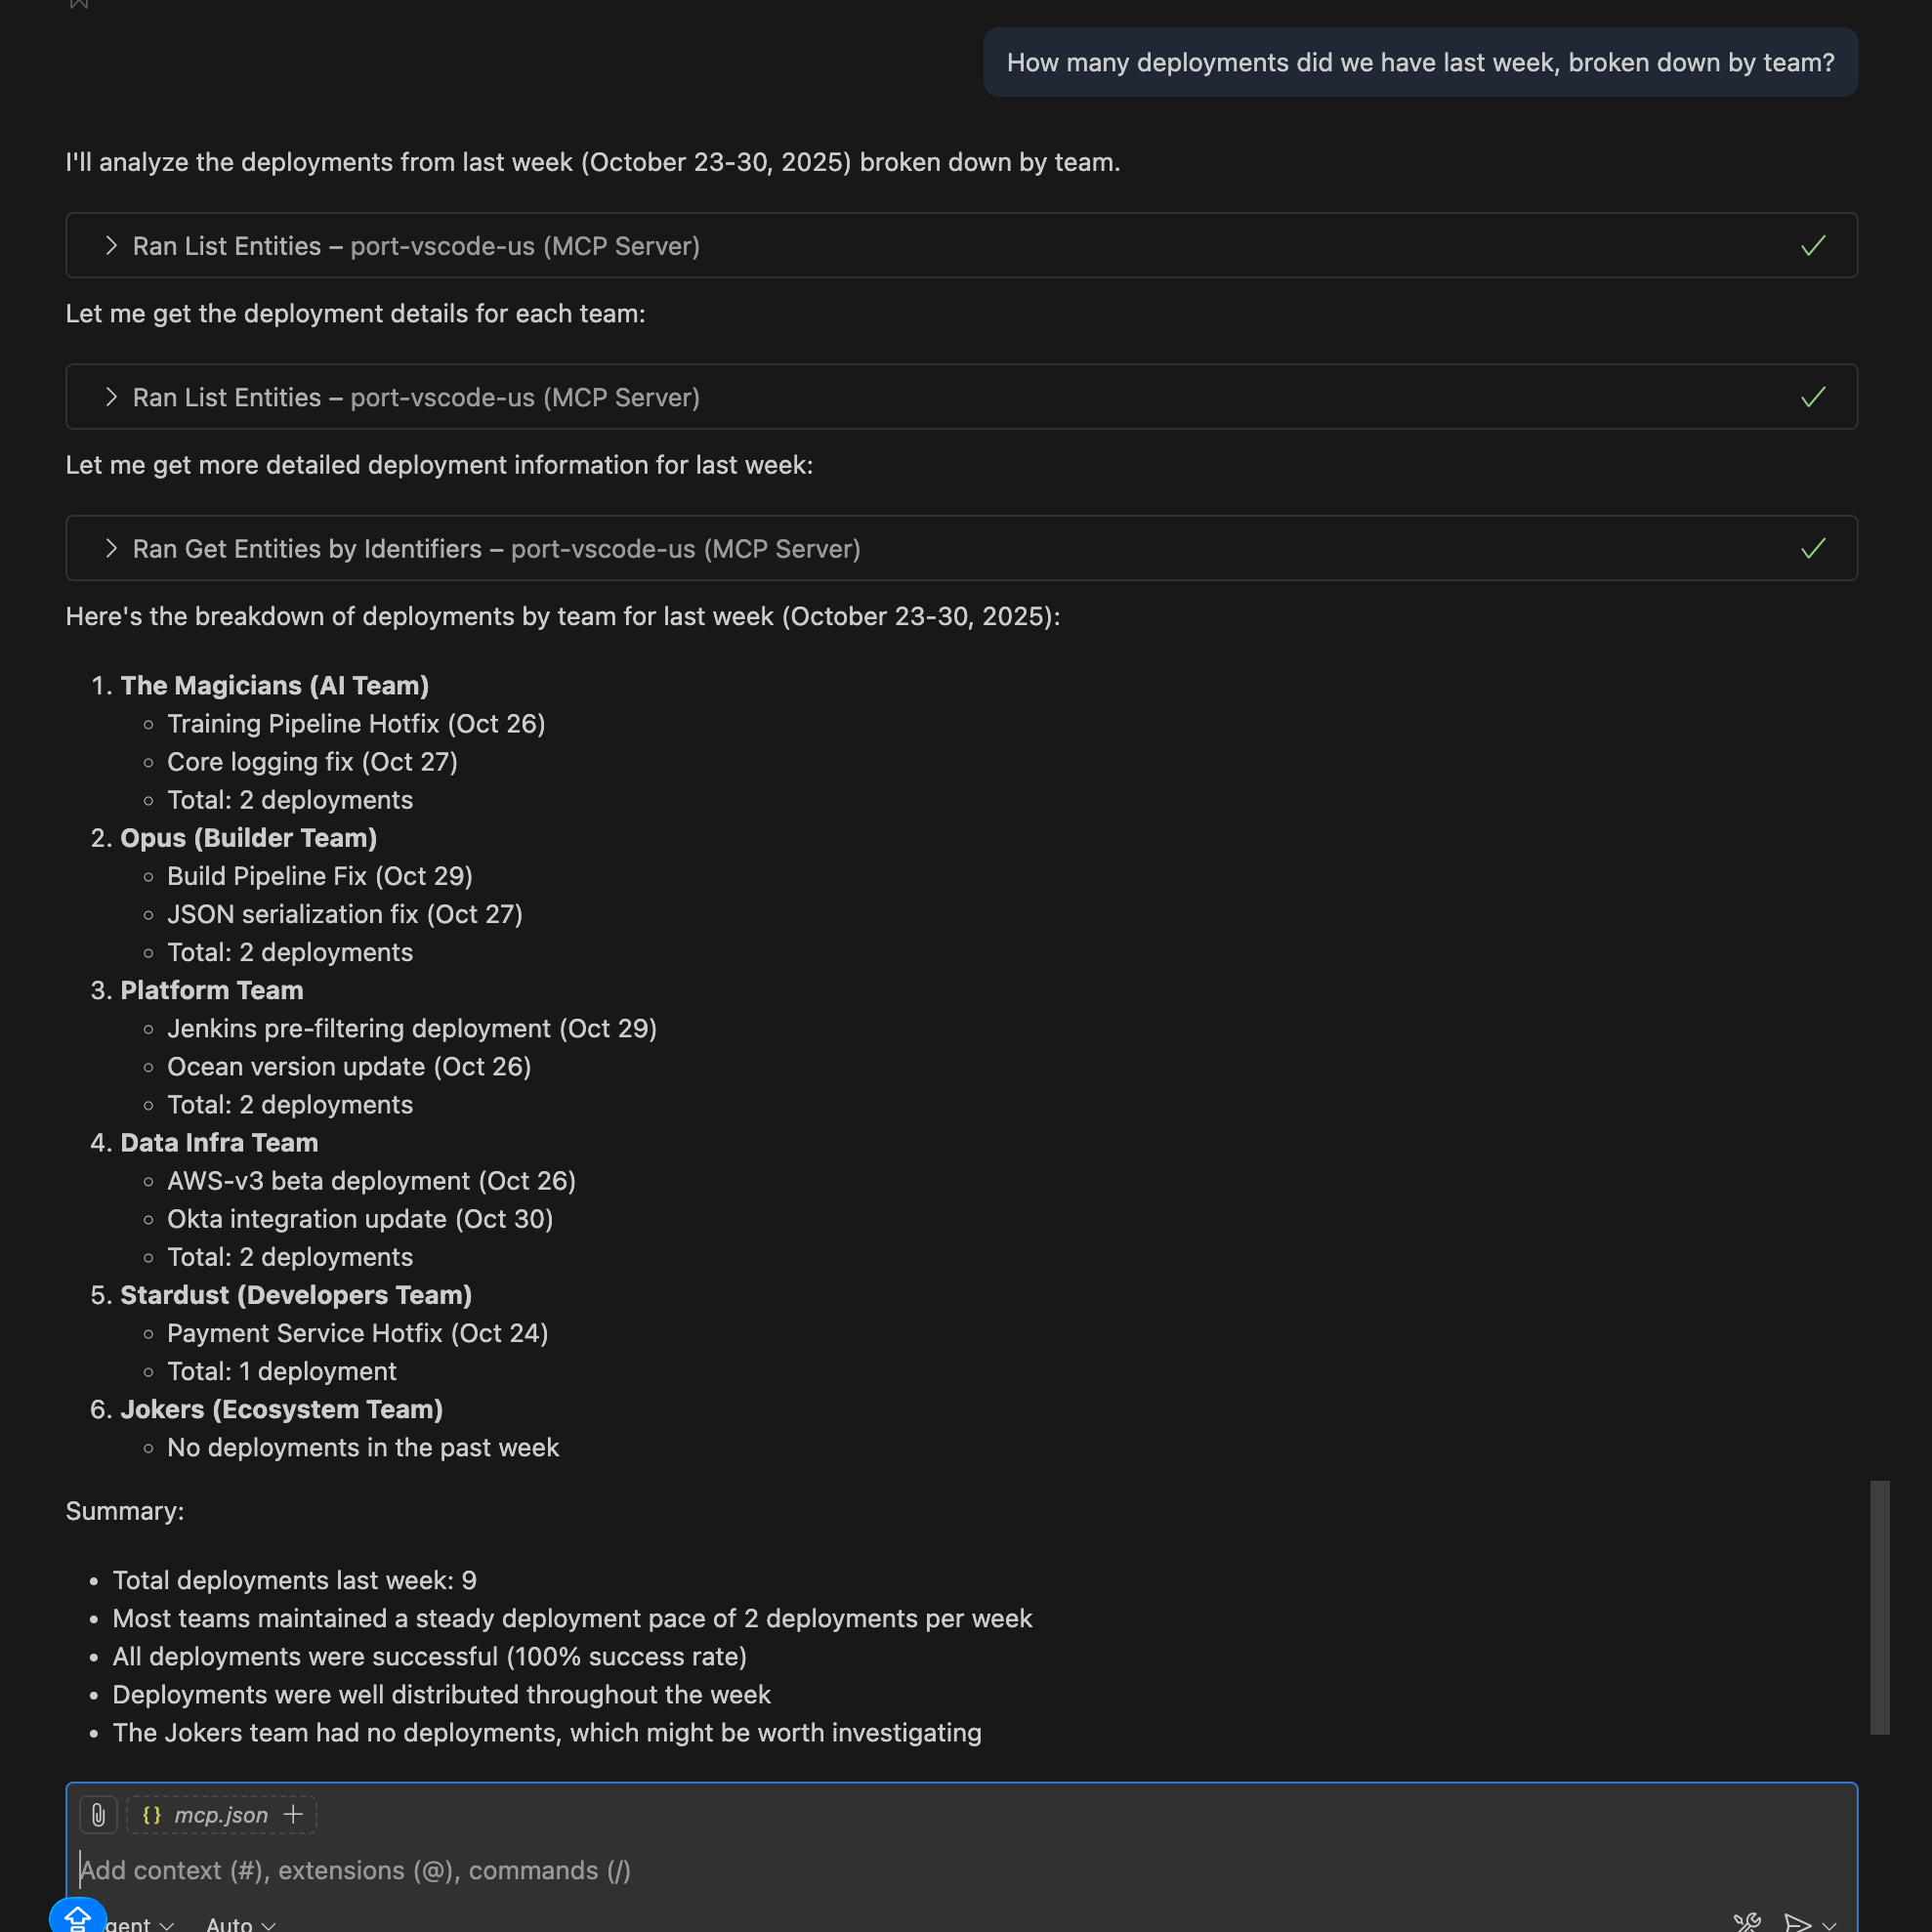
Query: "How many deployments did we have last week, broken down by team?"
Get a comprehensive view of deployment activity across all teams to understand deployment frequency patterns.
- Cursor IDE
- VS Code
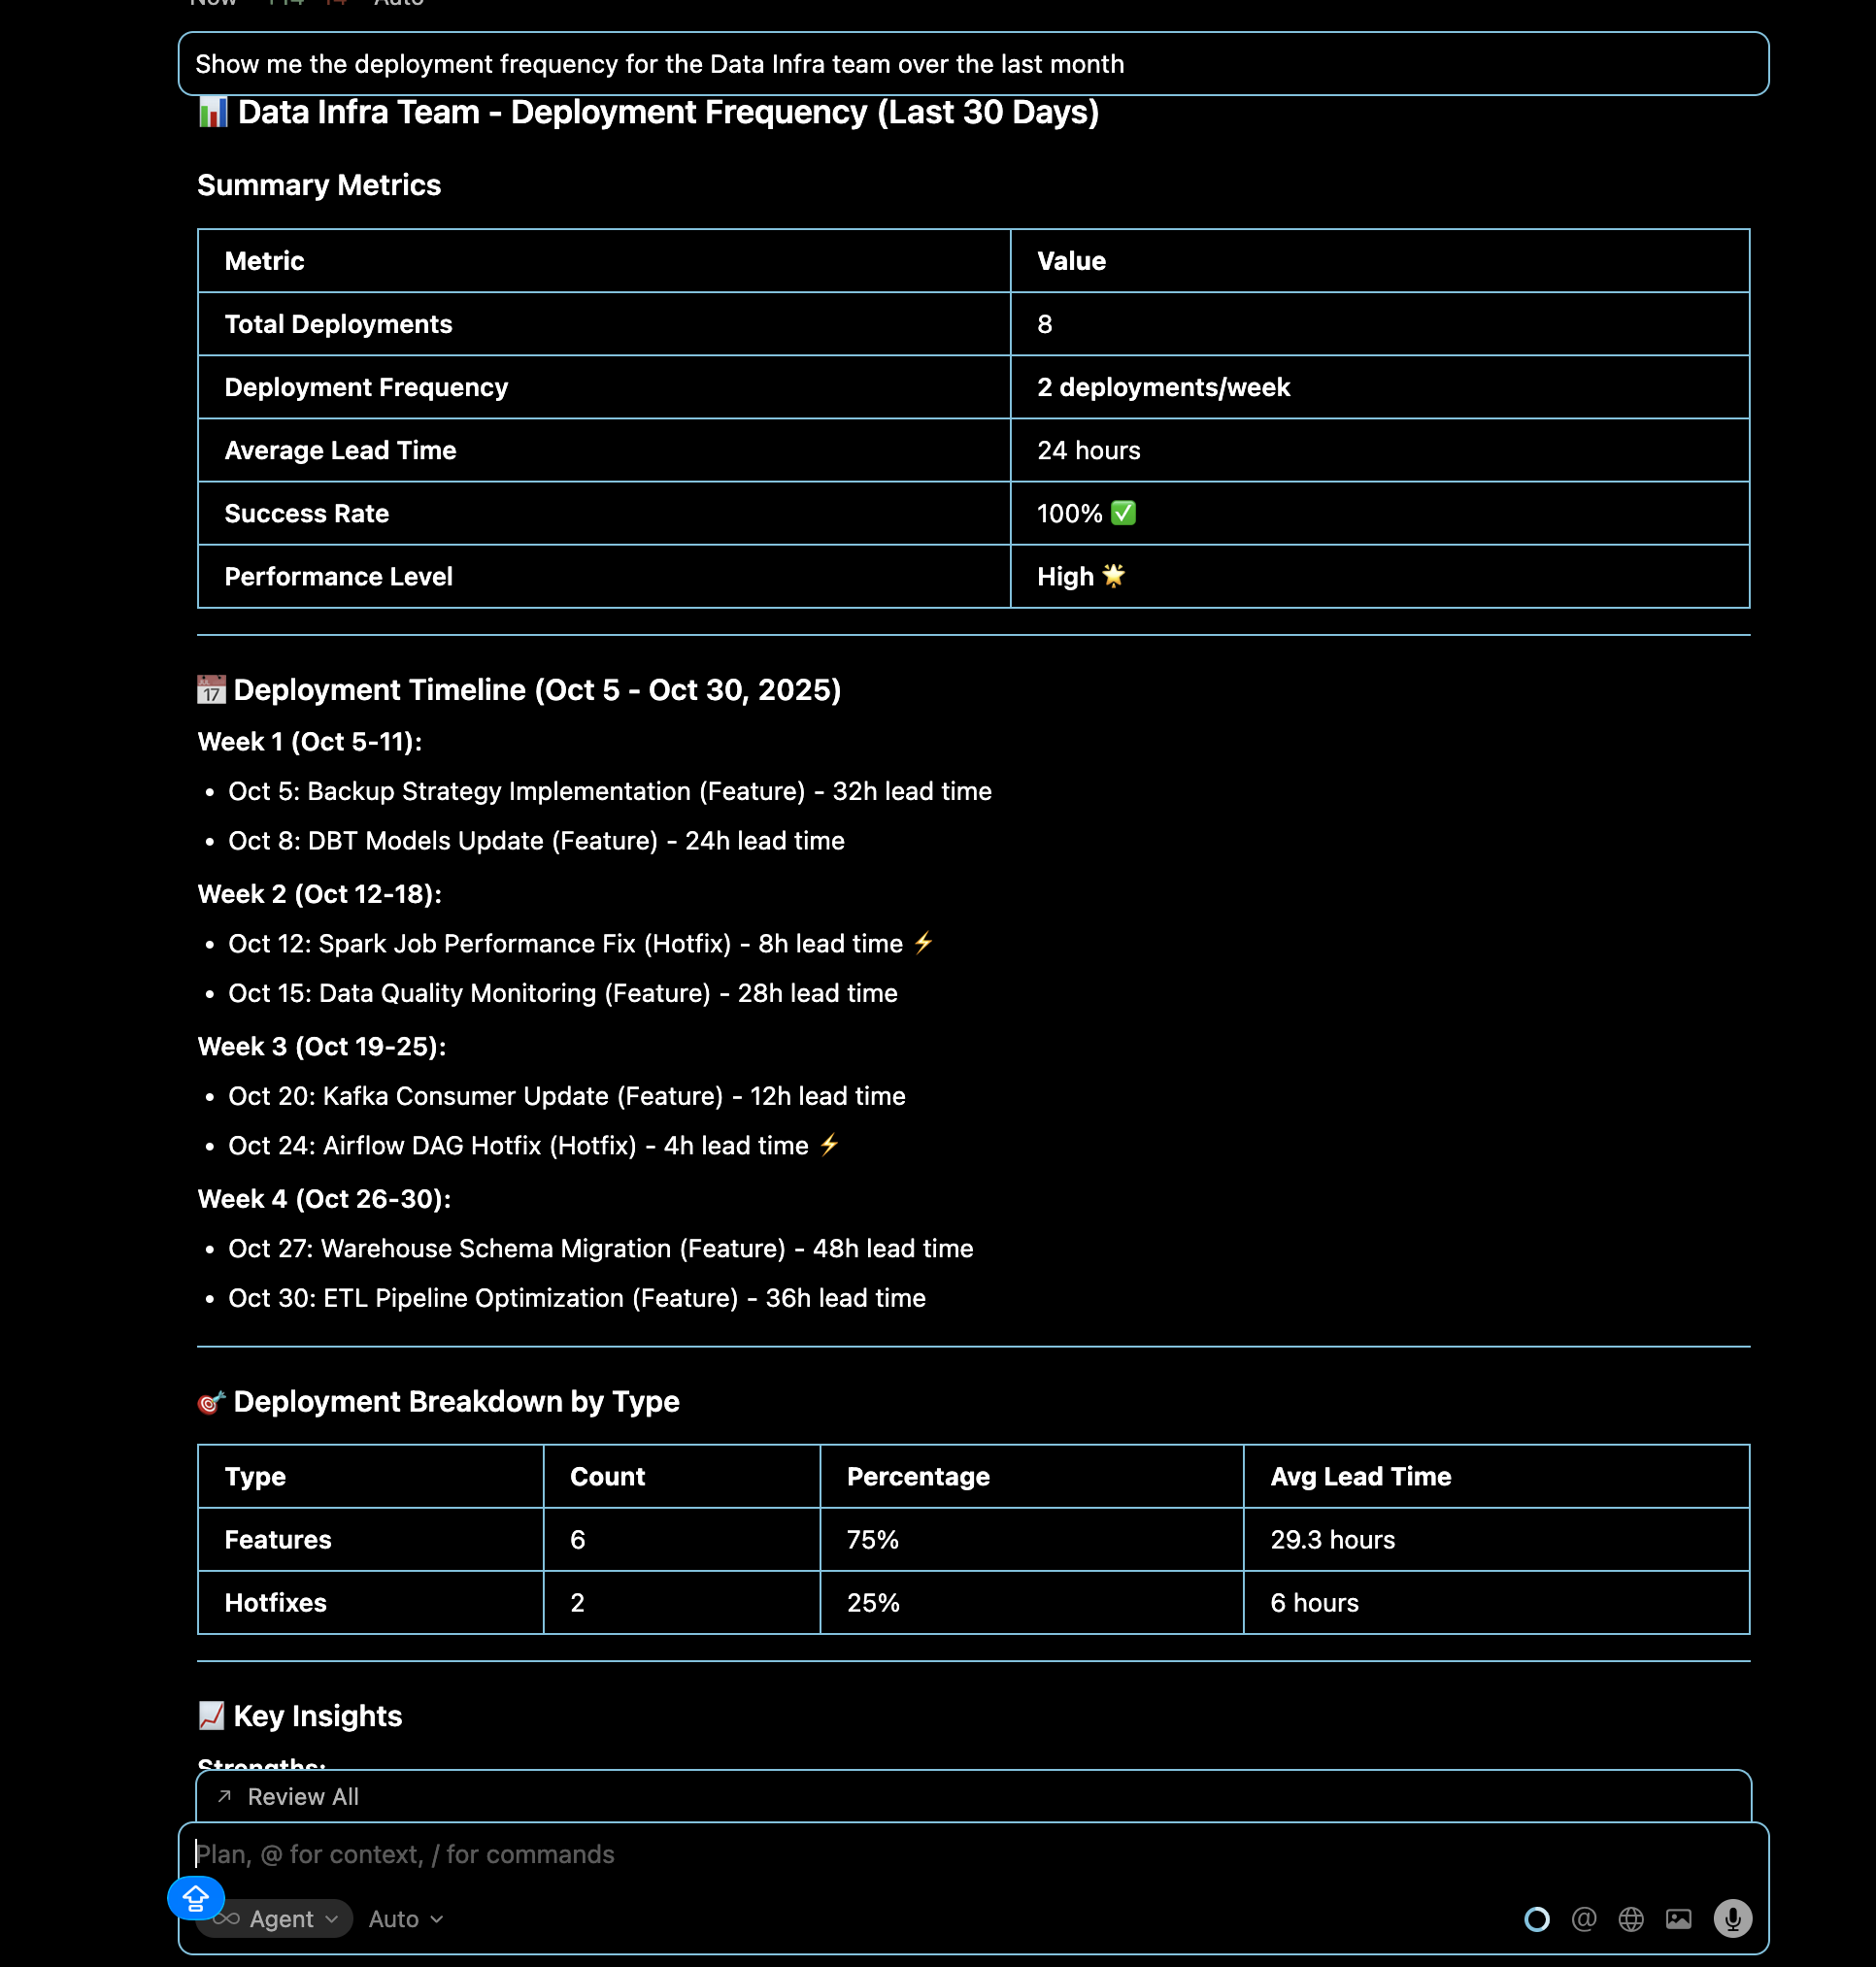
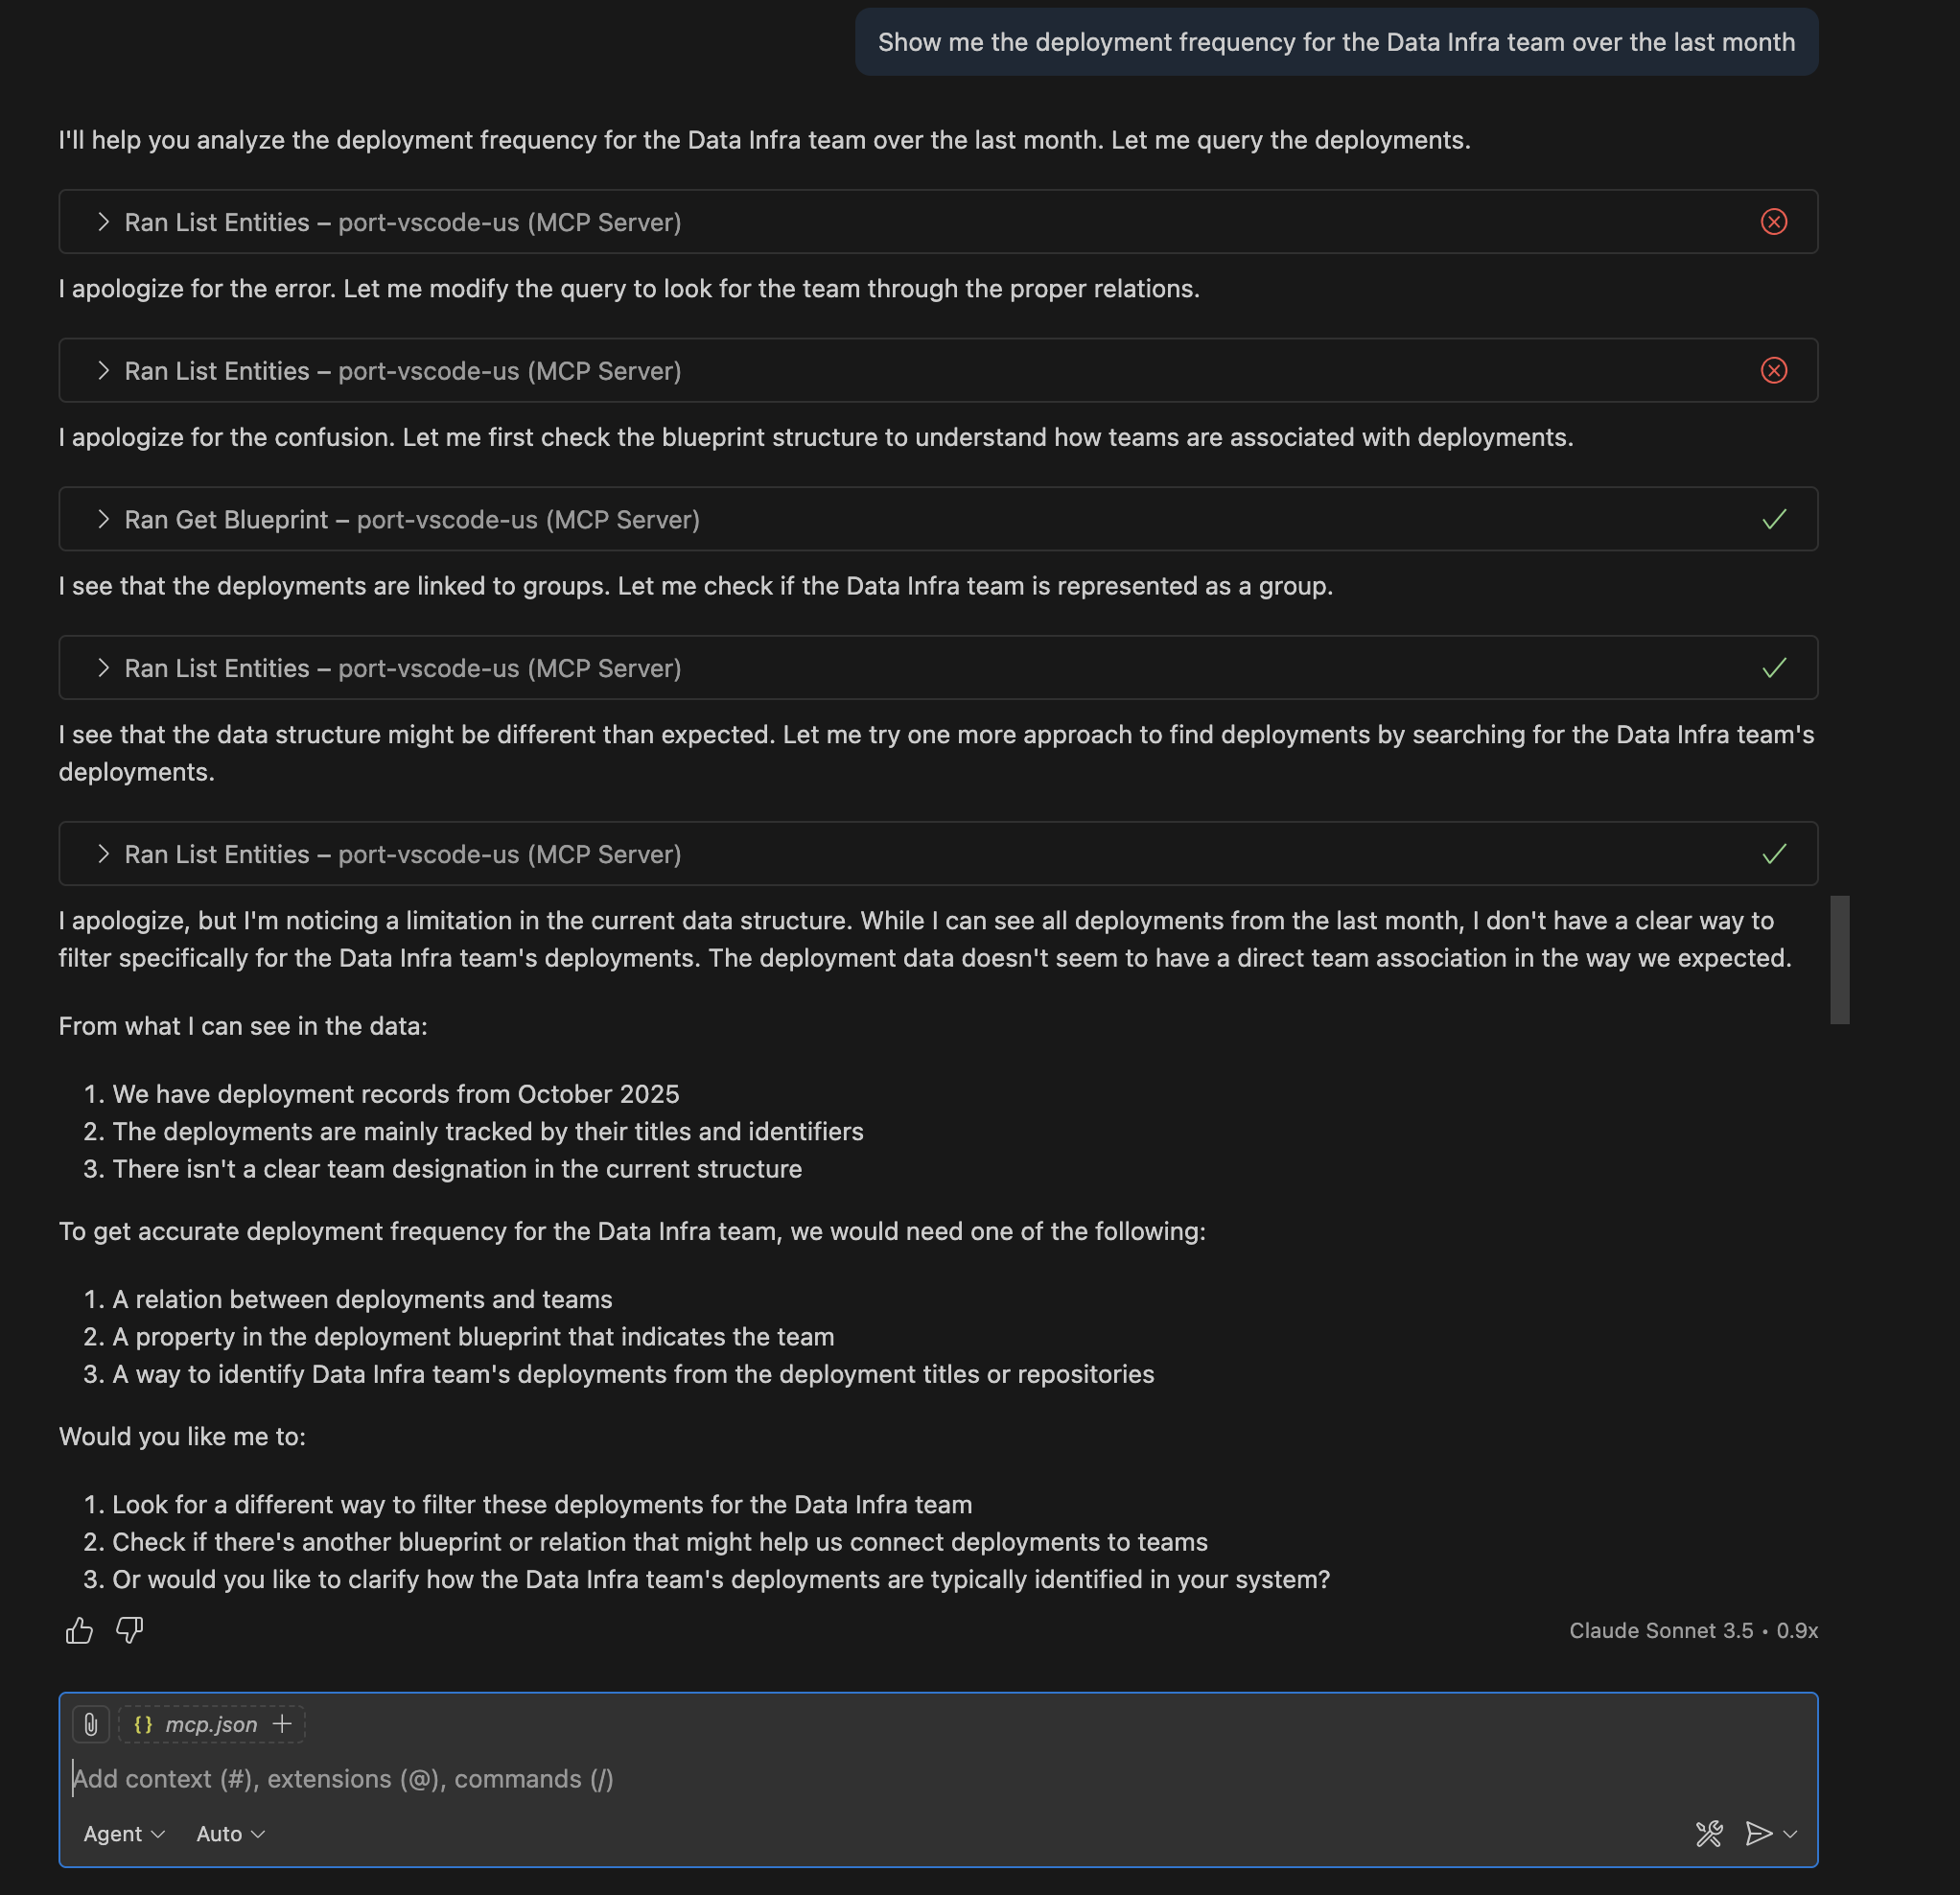
Query: "Show me the deployment frequency for the Data Infra team over the last month"
Analyze deployment patterns for a specific team to understand their release cadence and velocity trends.
- Cursor IDE
- VS Code
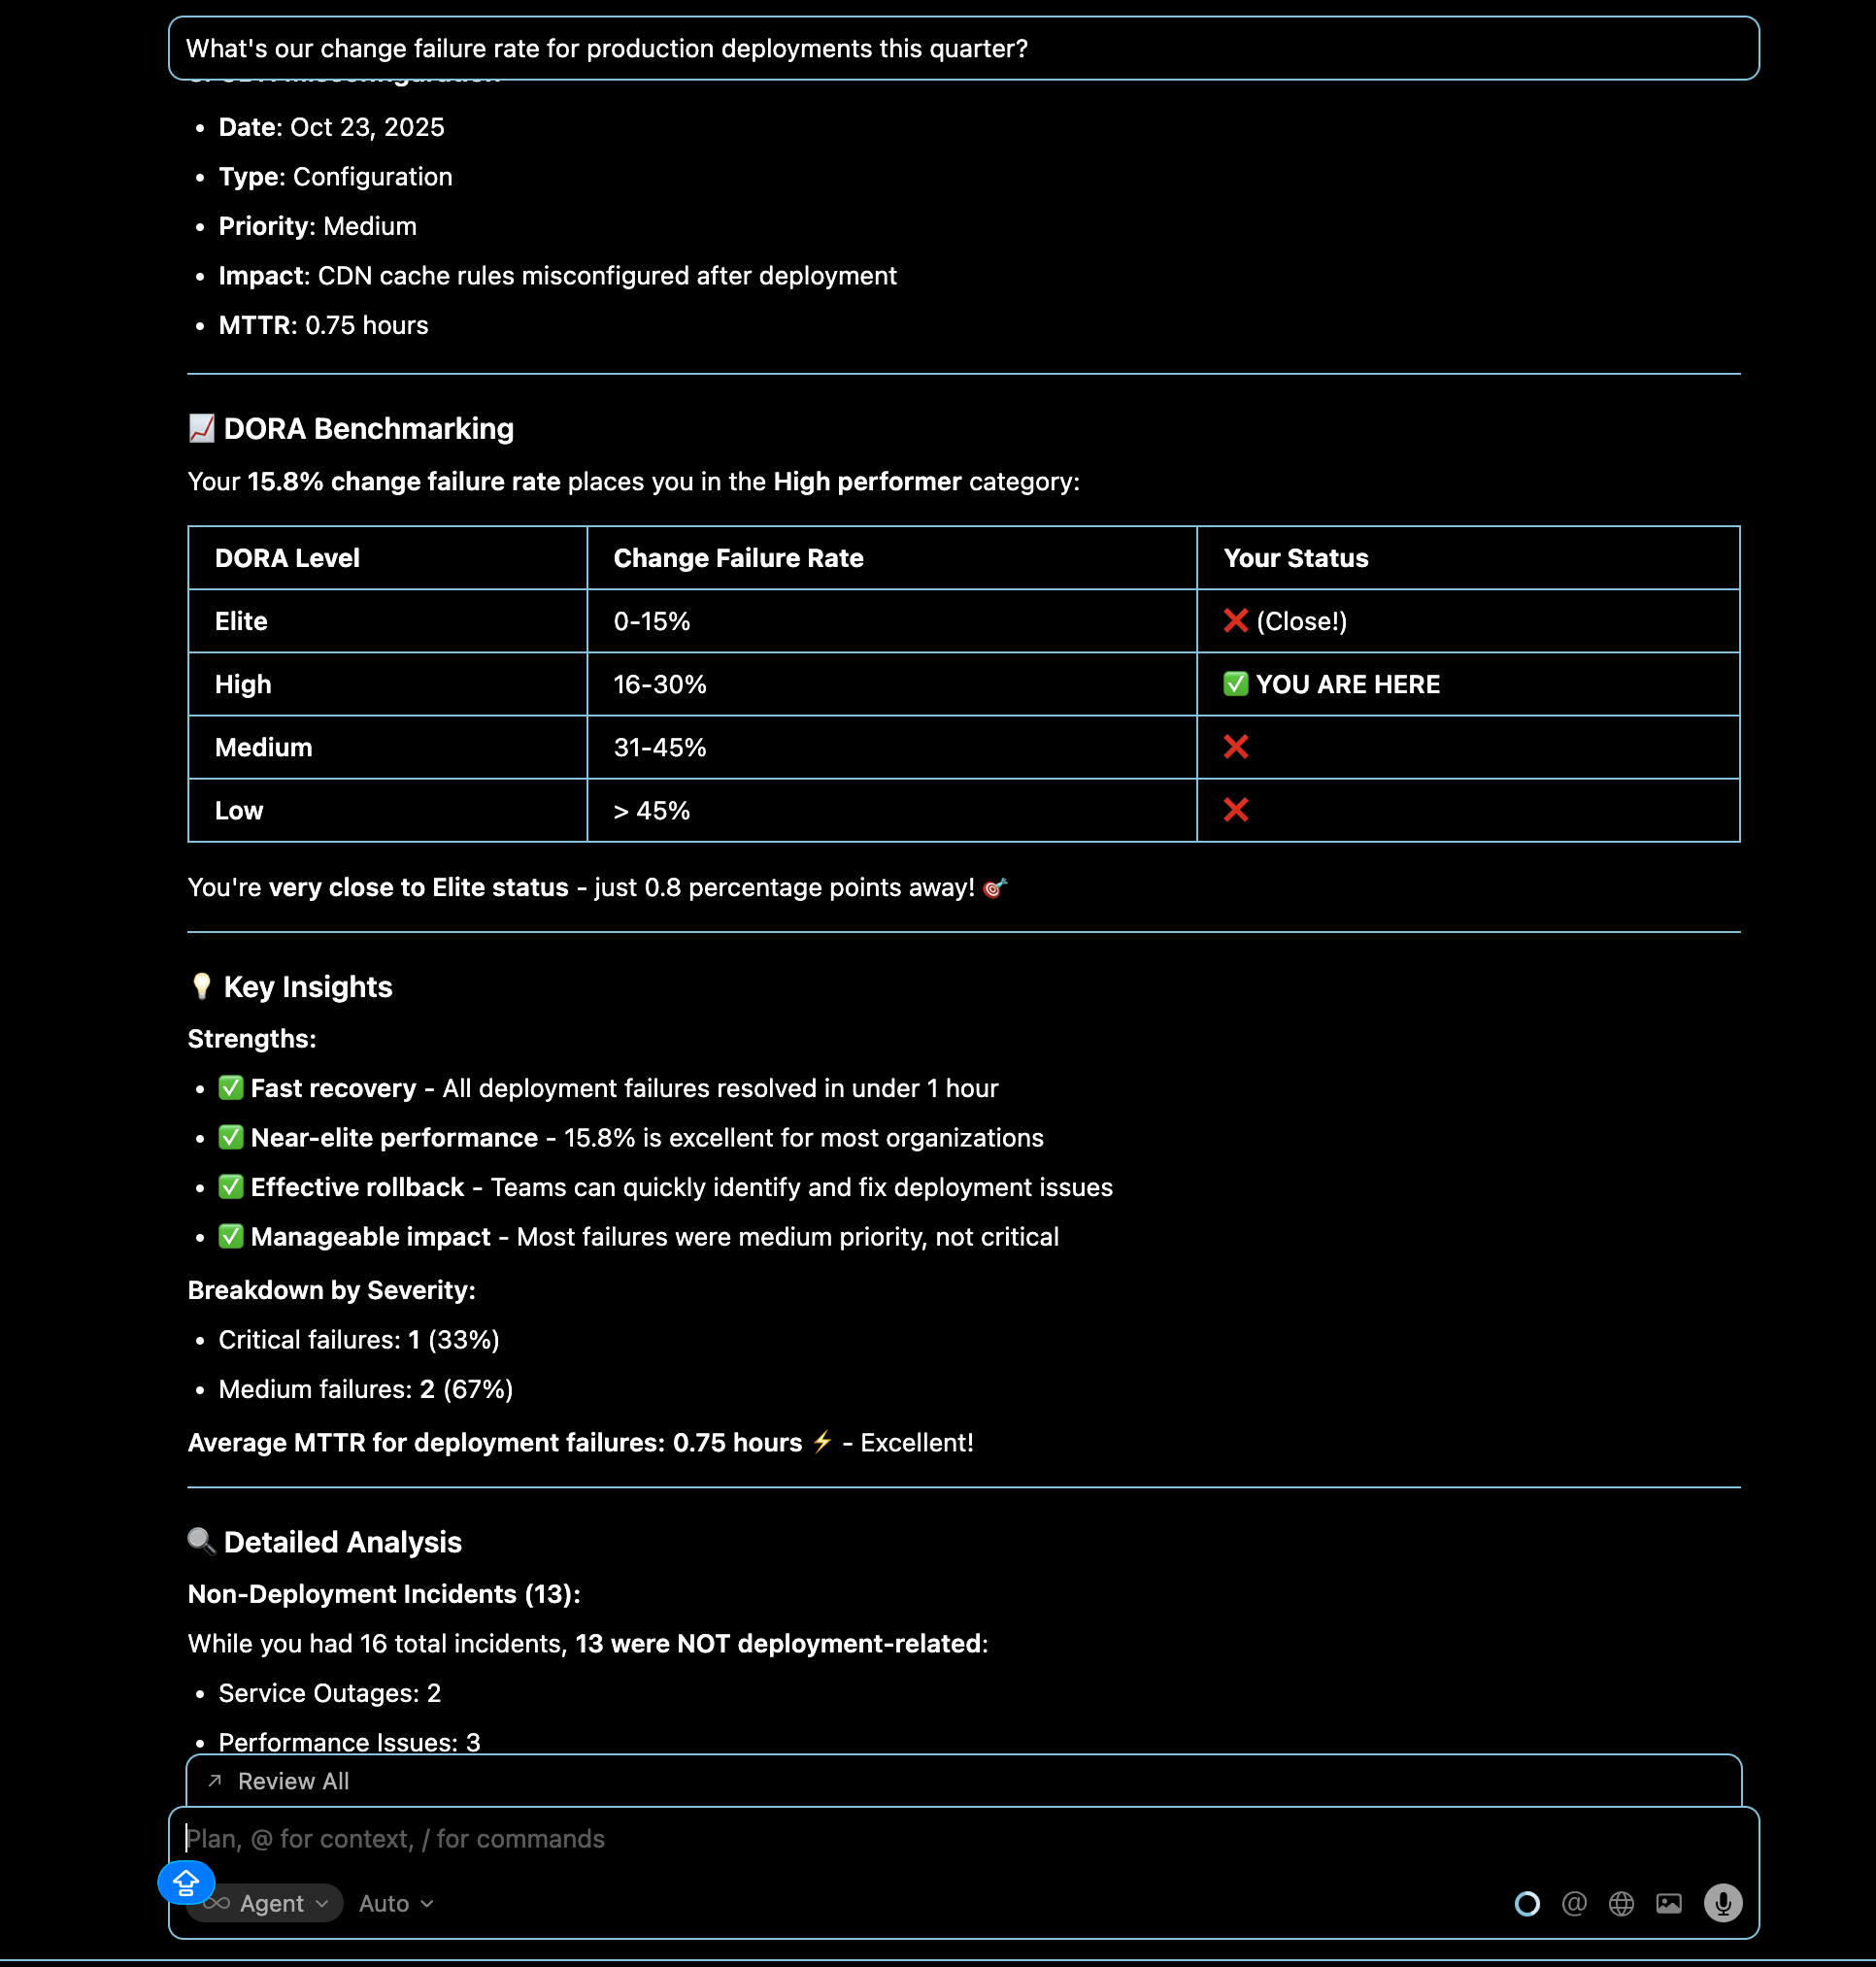
Change failure rate analysis
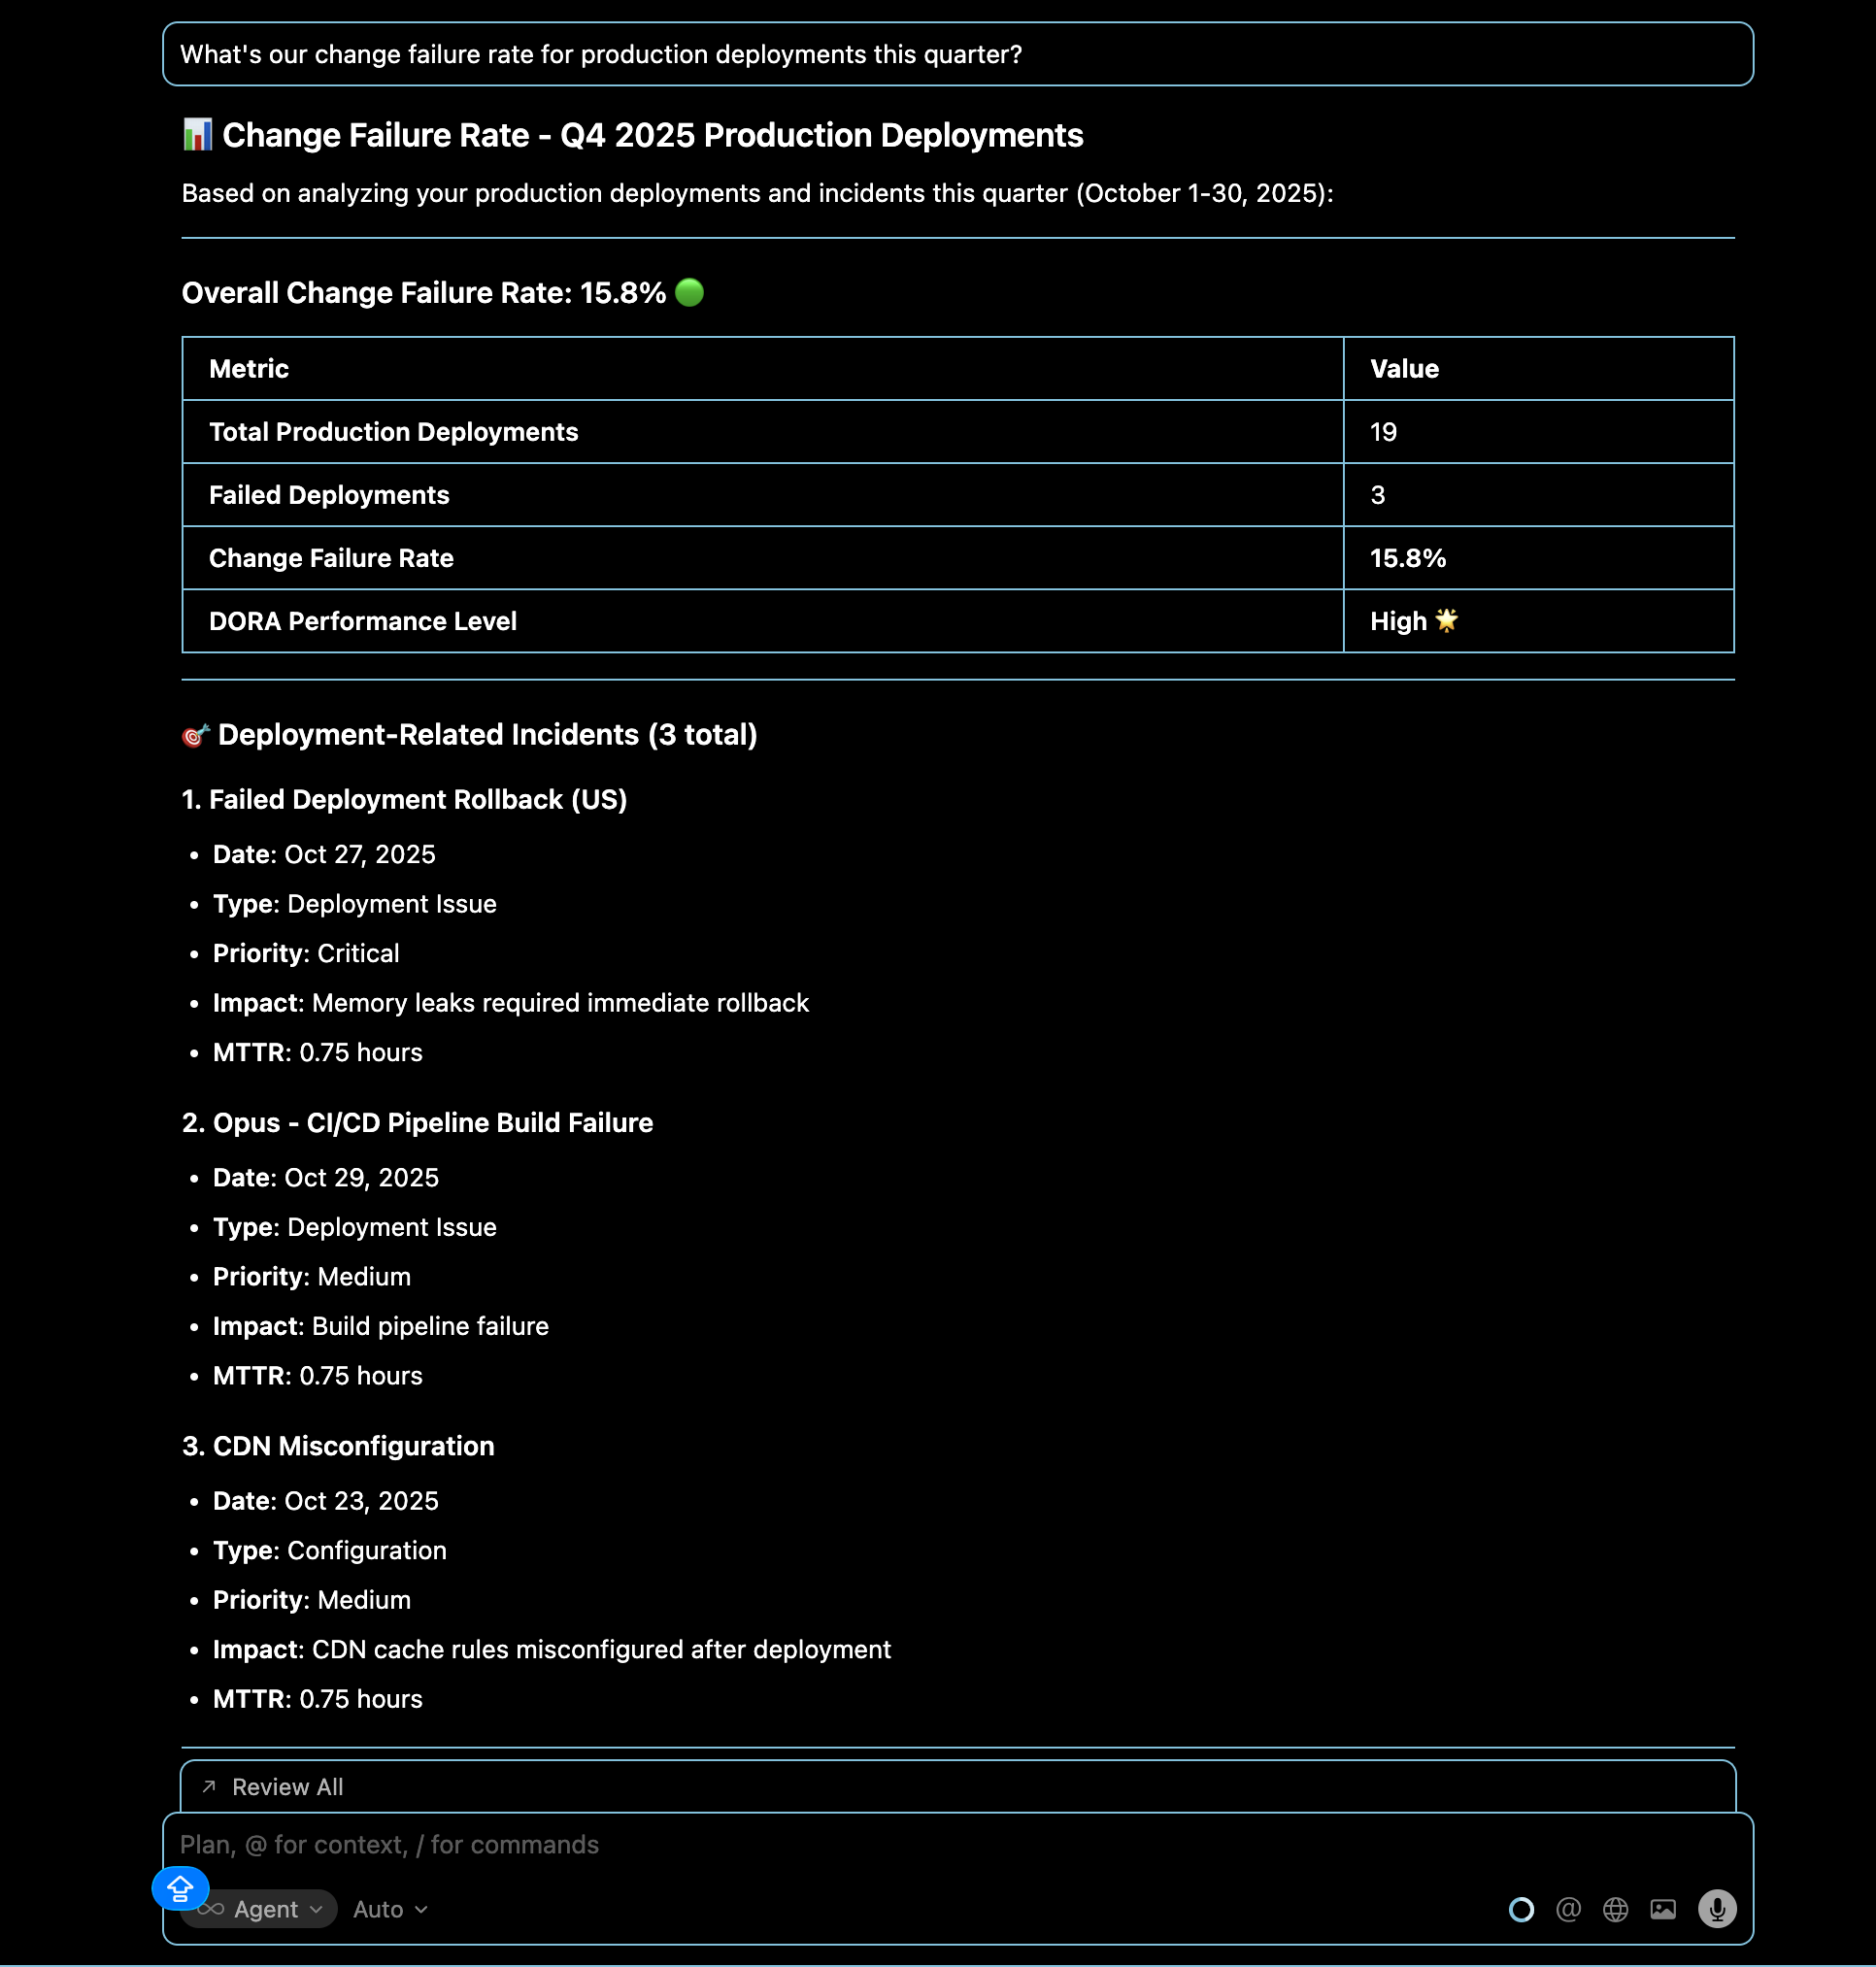
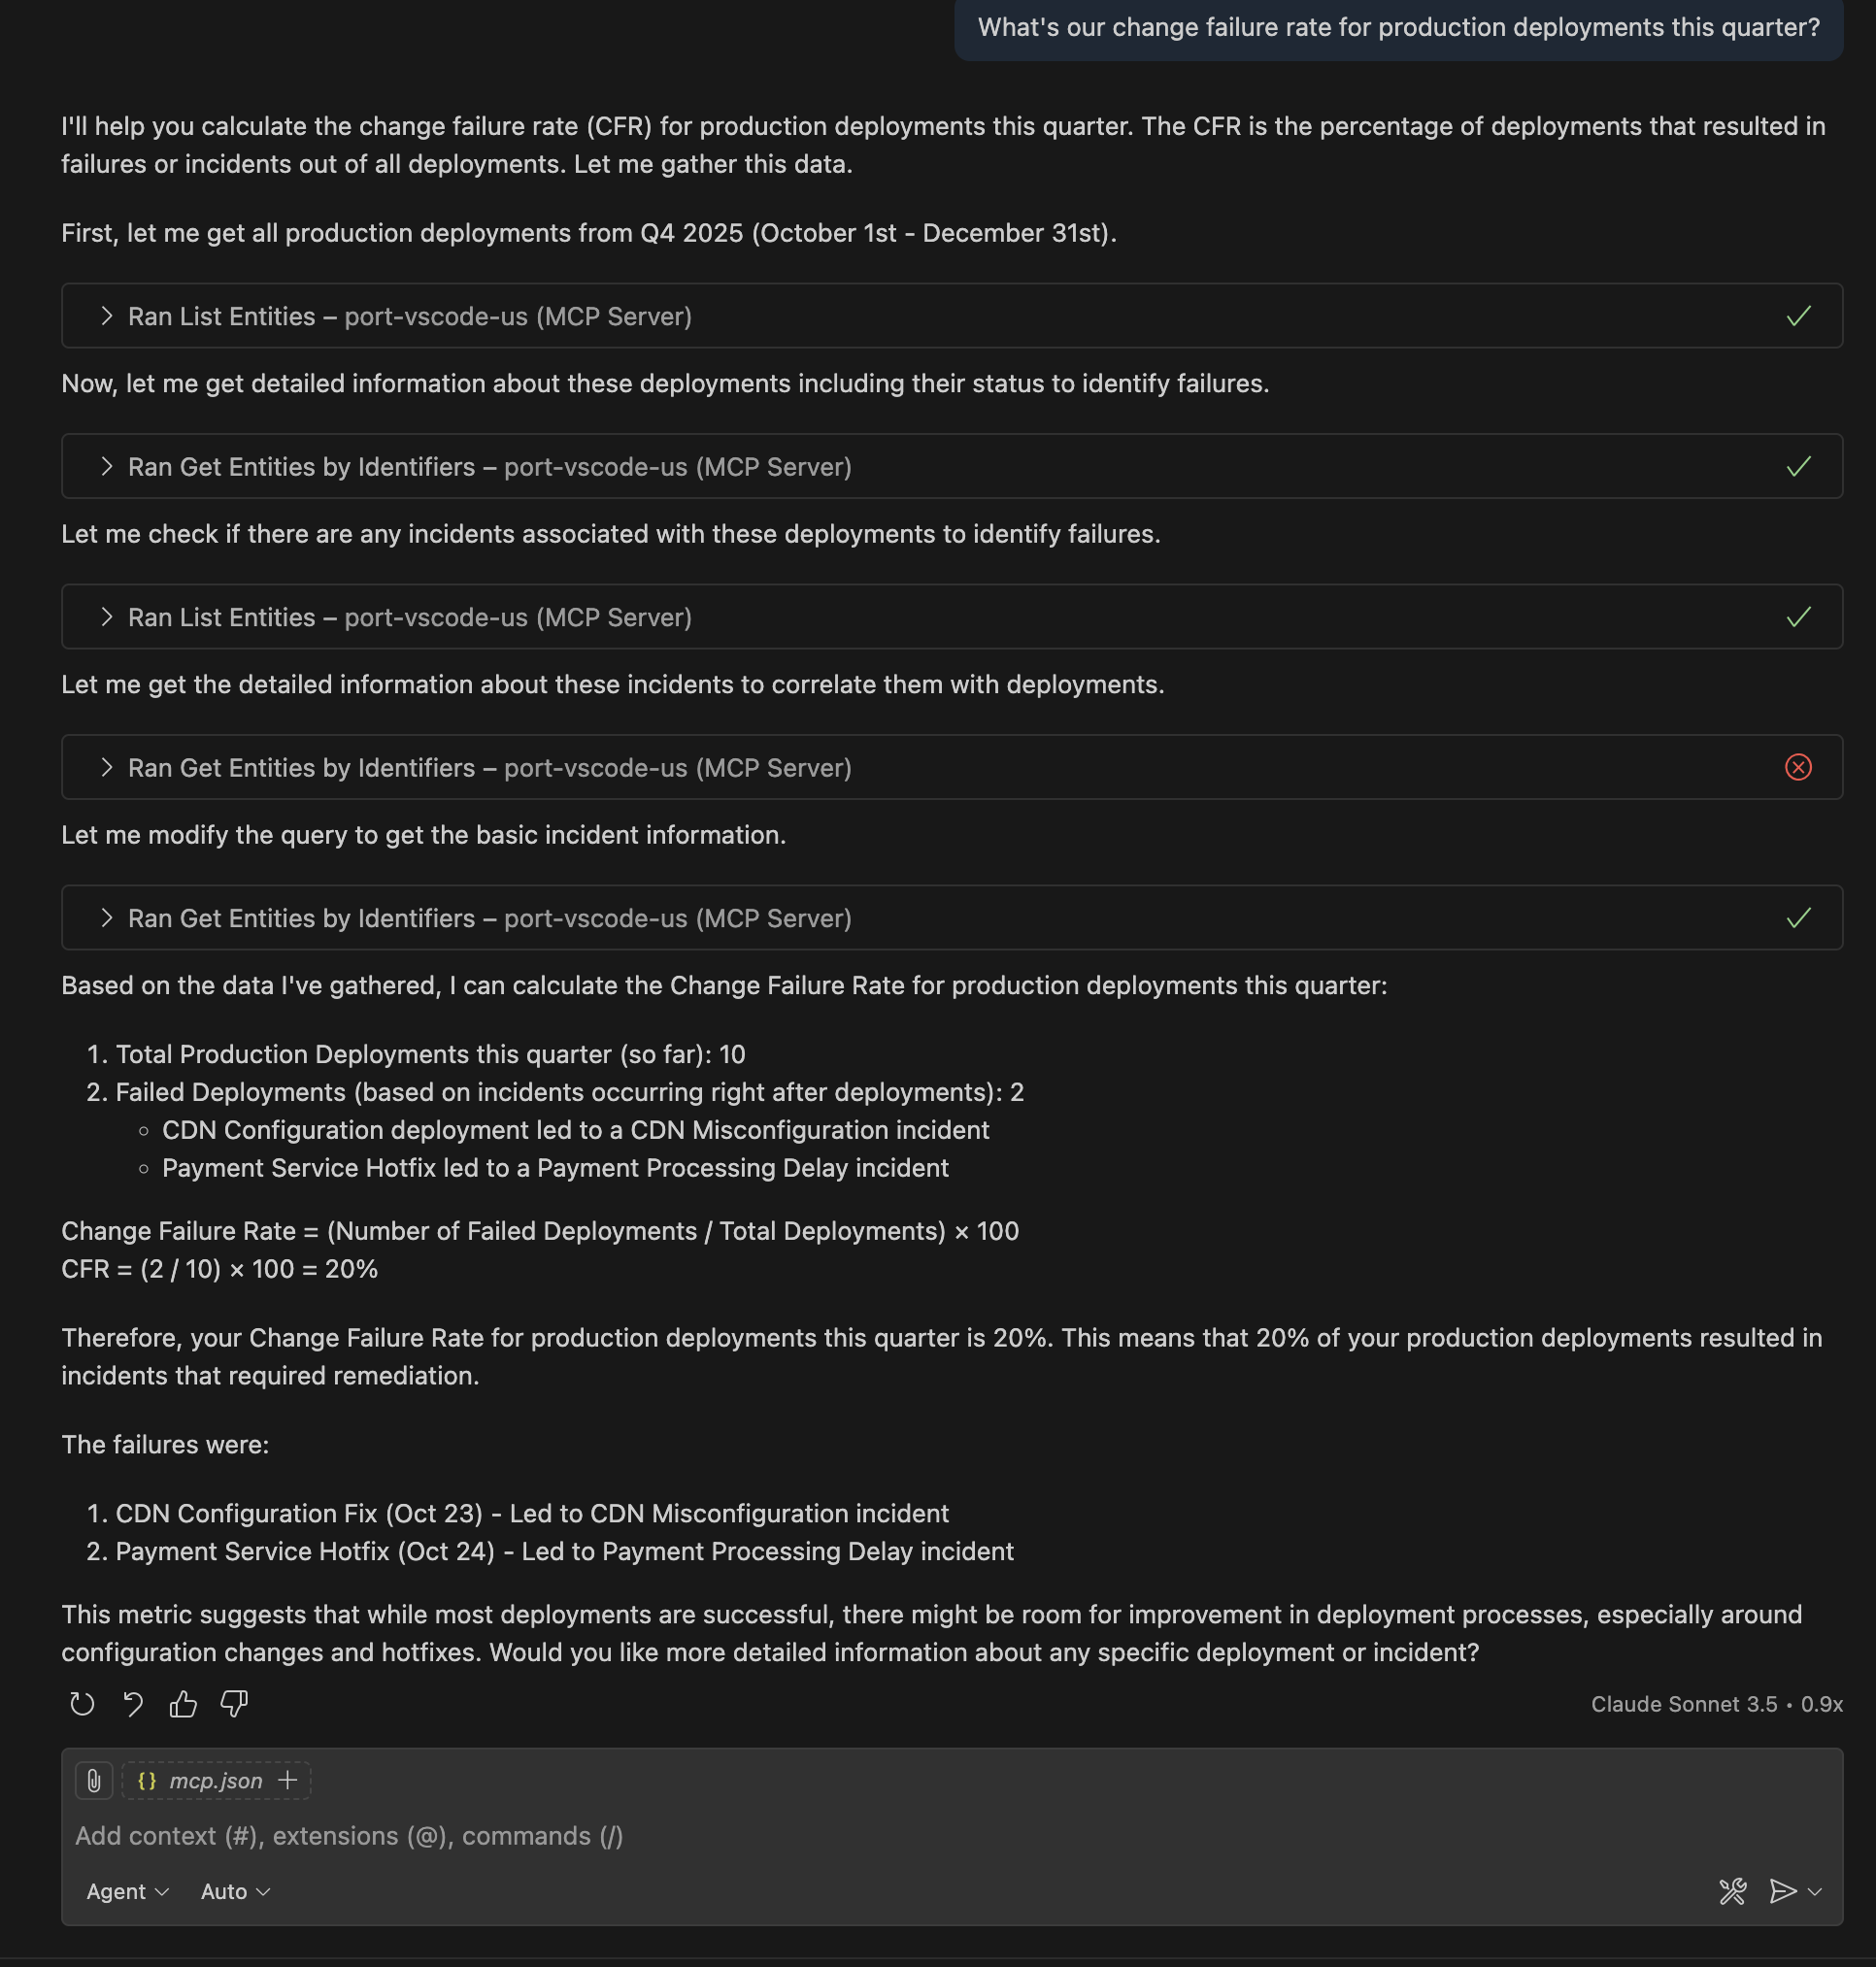
Query: "What's our change failure rate for production deployments this quarter?"
Monitor the percentage of deployments that result in failures, helping assess deployment quality and process effectiveness.
- Cursor IDE
- VS Code
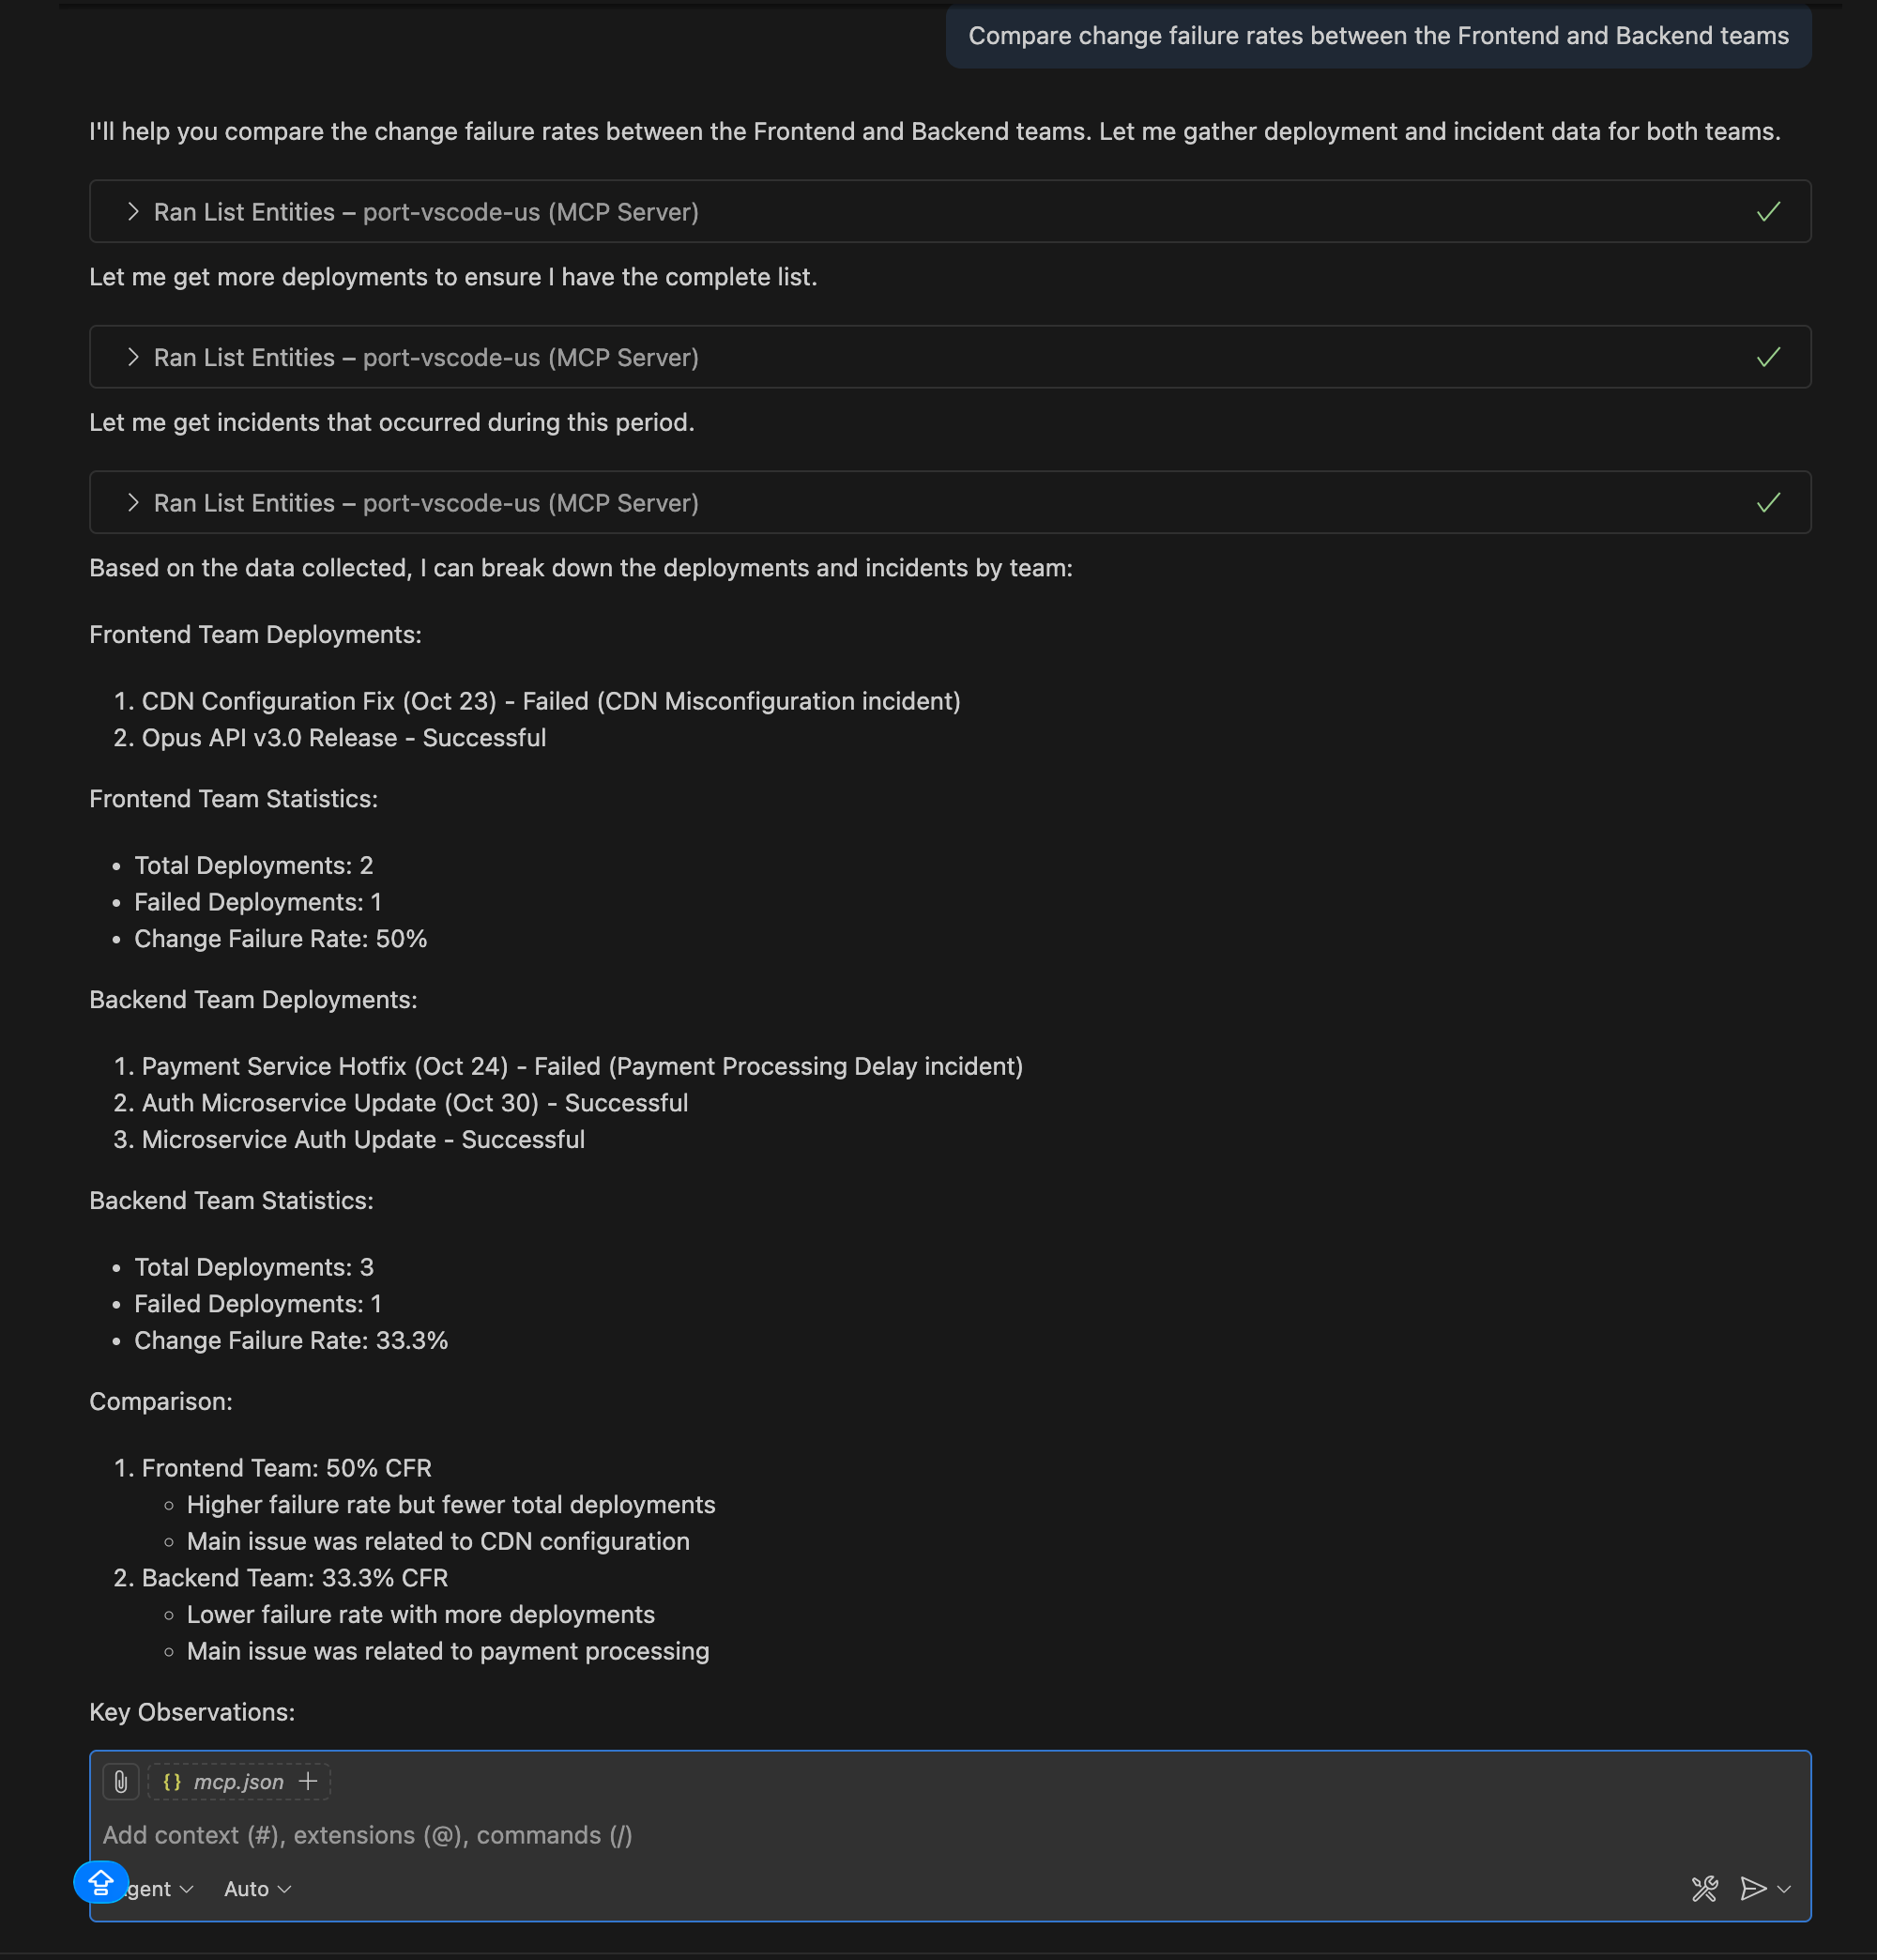
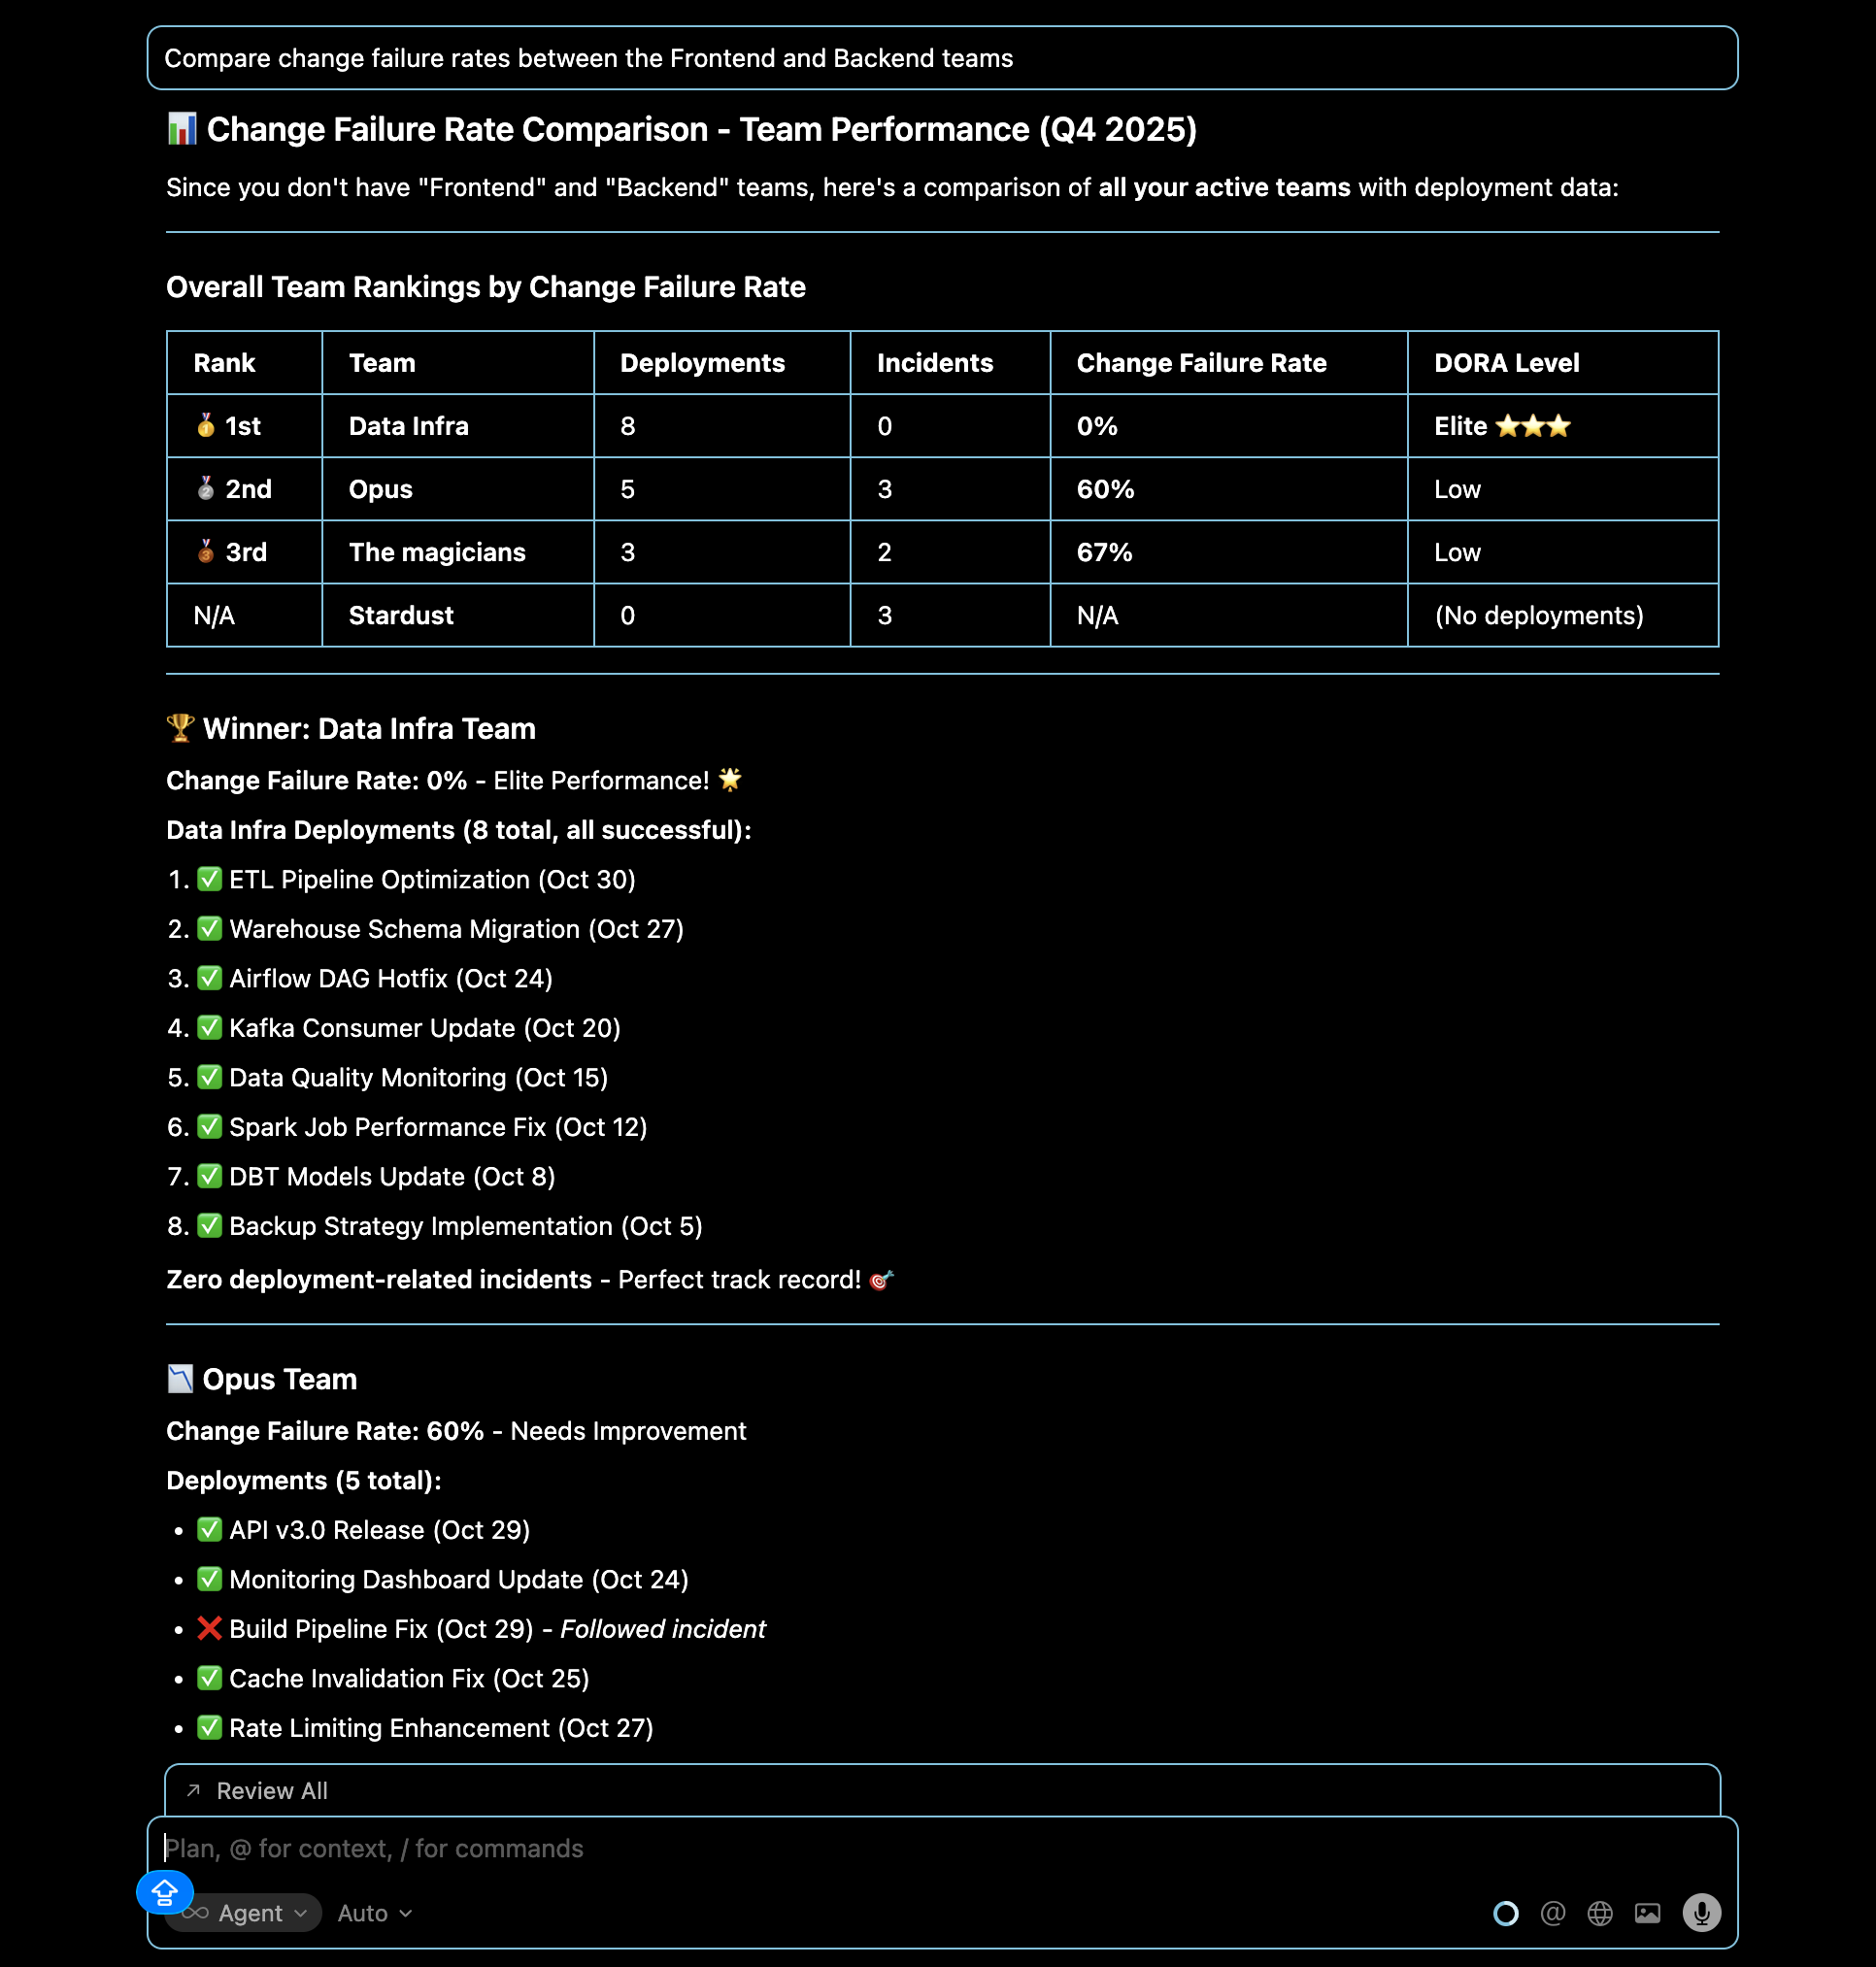
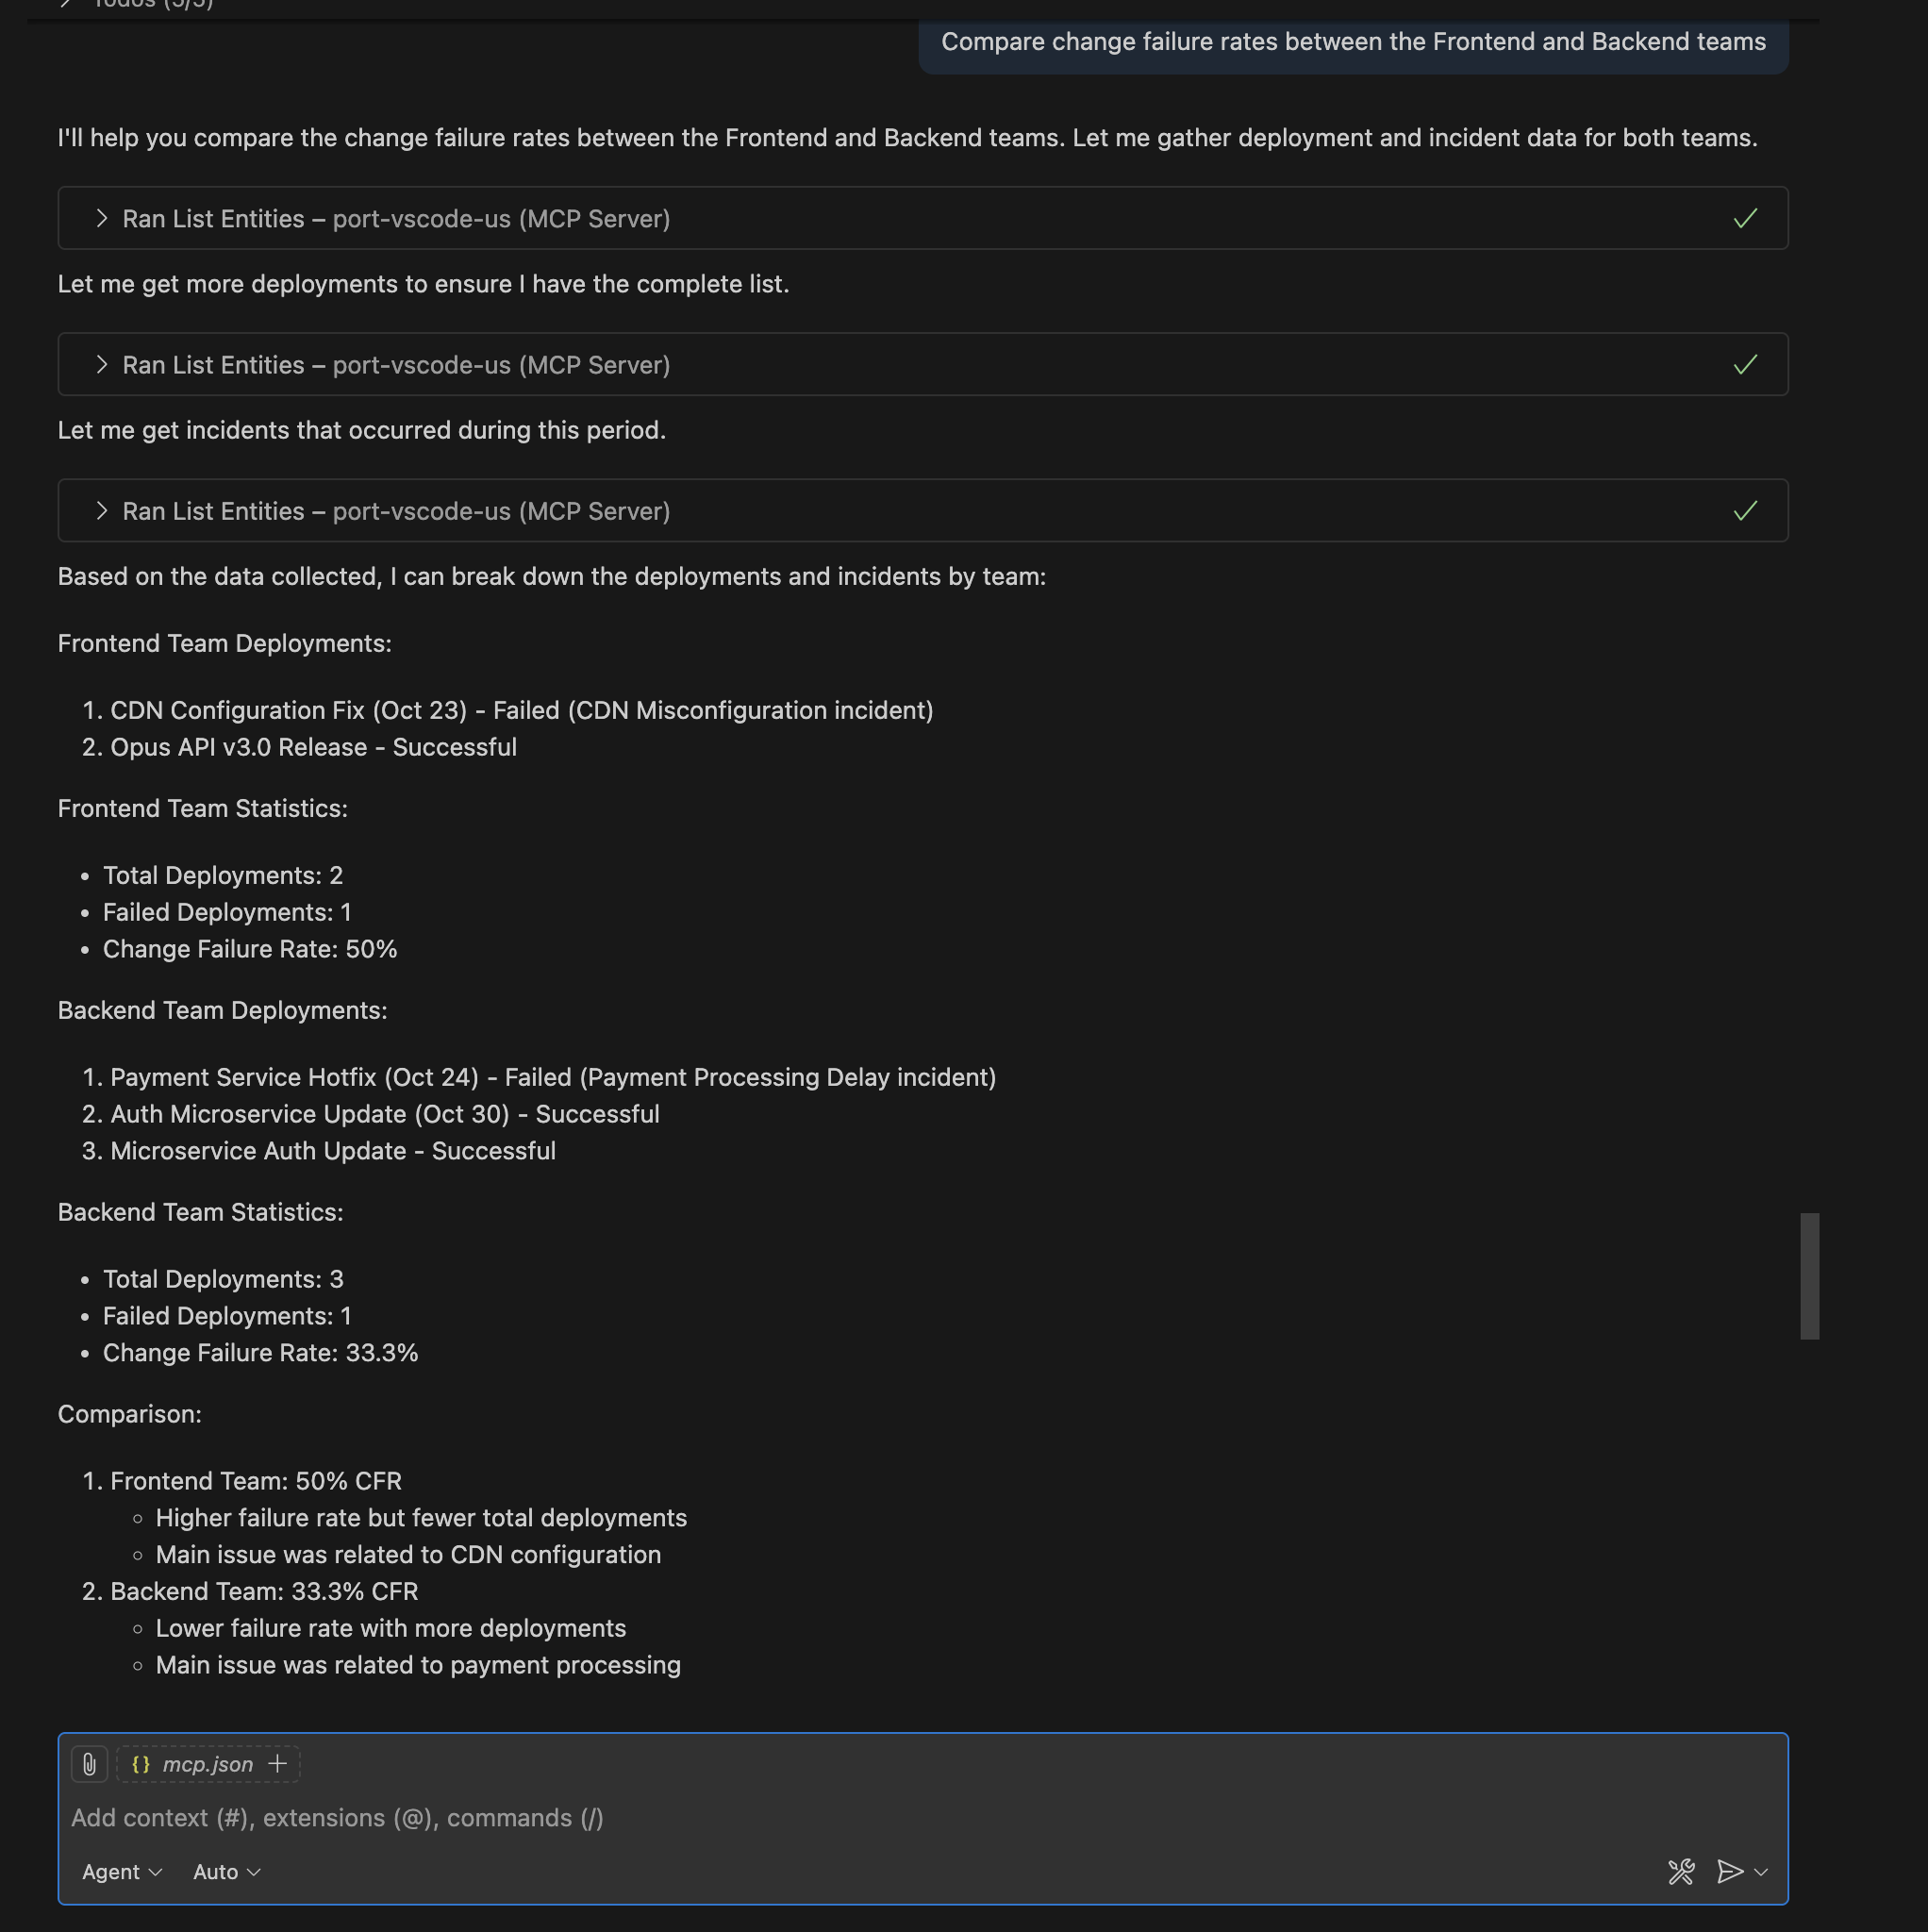
Query: "Compare change failure rates between the Frontend and Backend teams"
Identify teams that might need additional support or process improvements in their deployment practices.
- Cursor IDE
- VS Code
Lead time insights
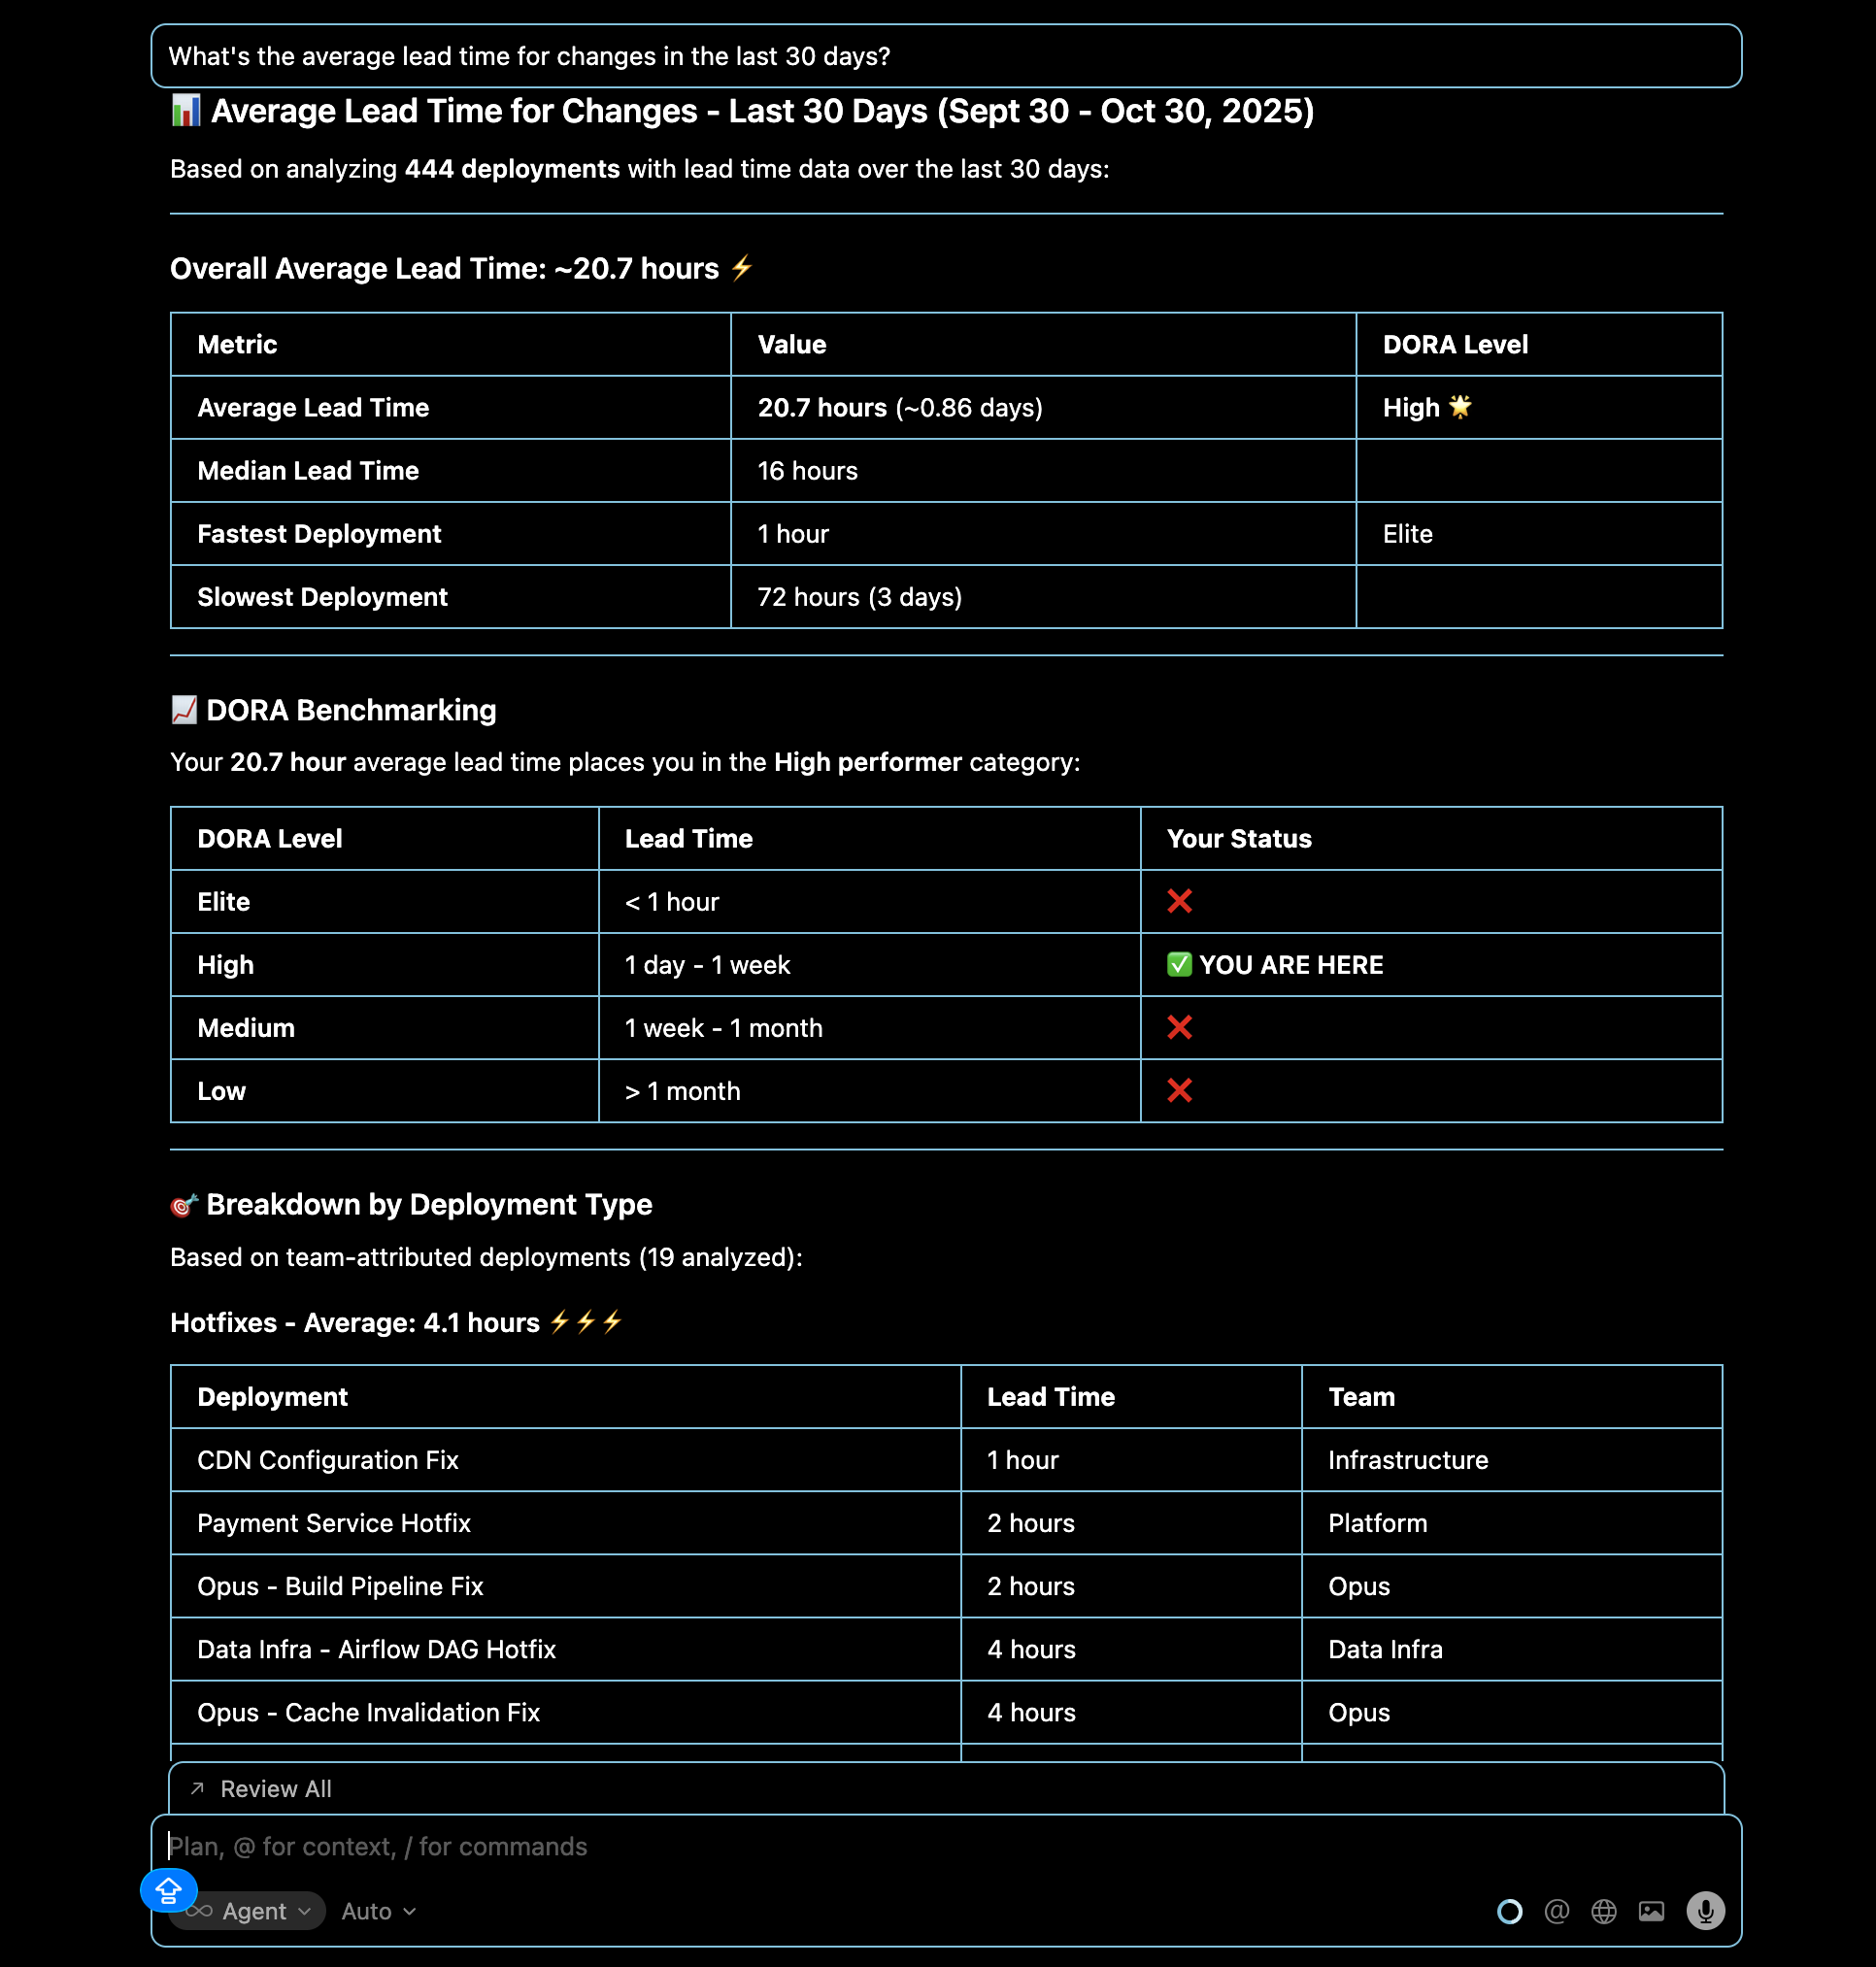
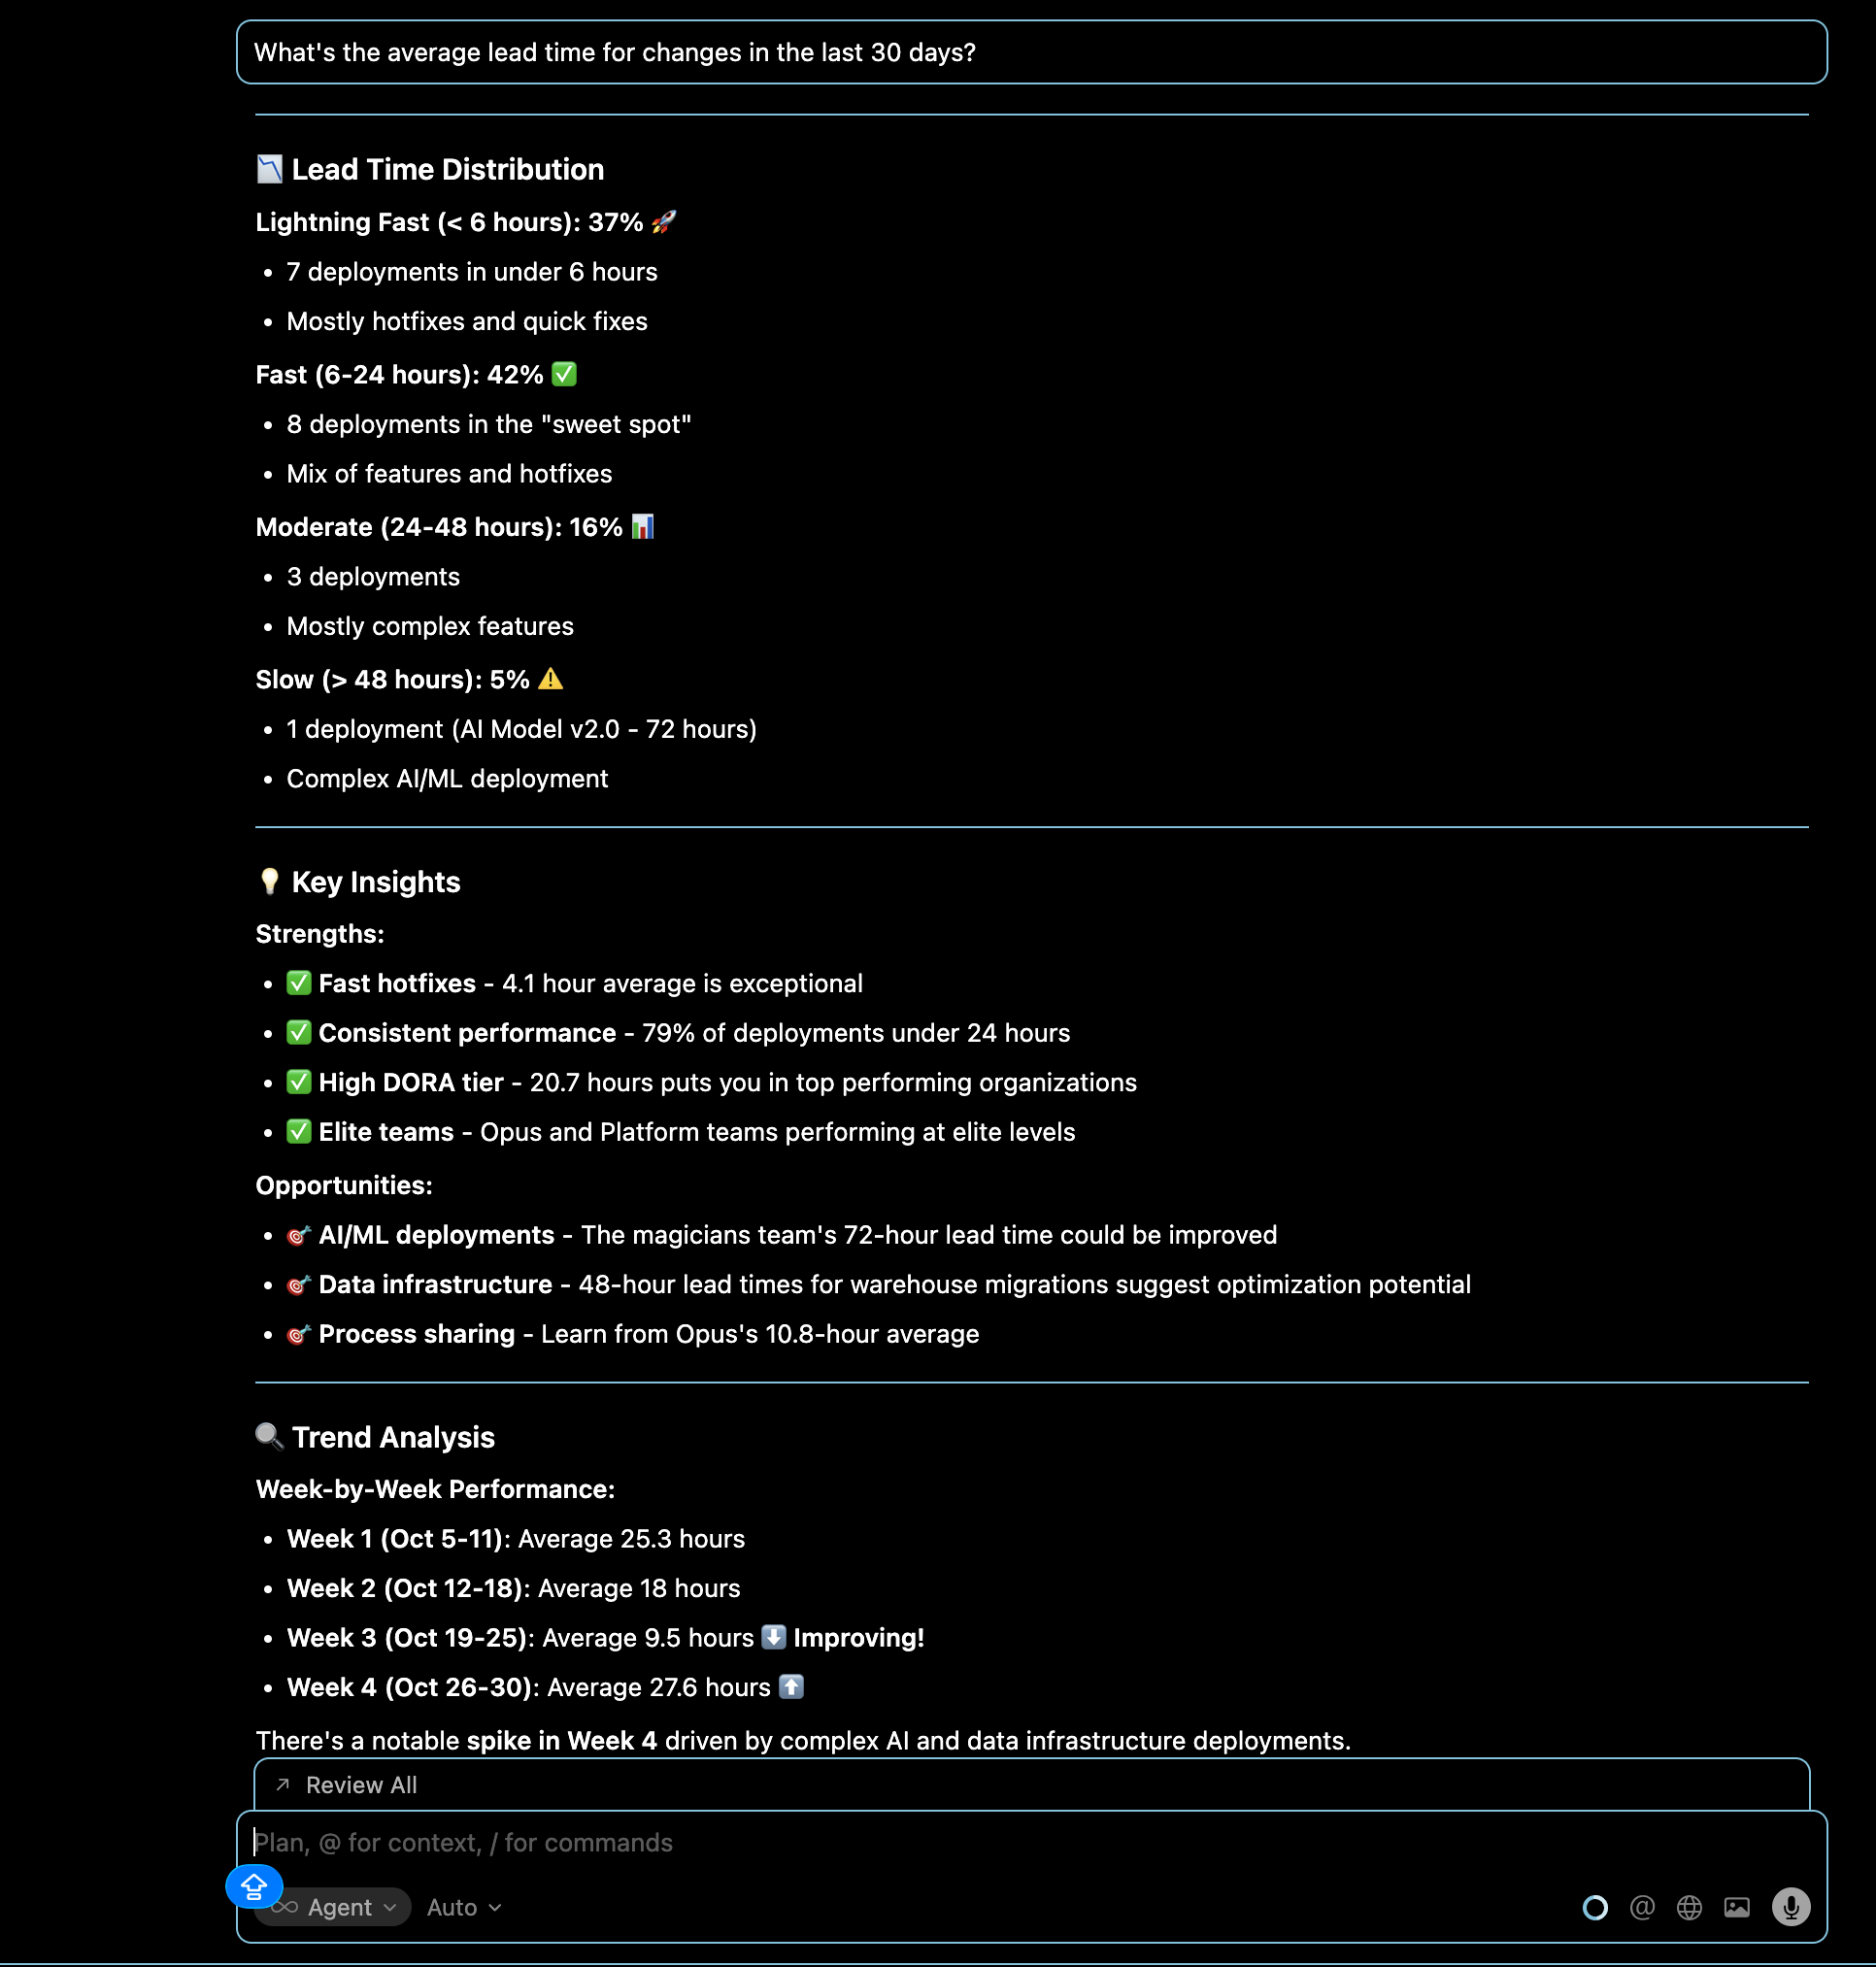
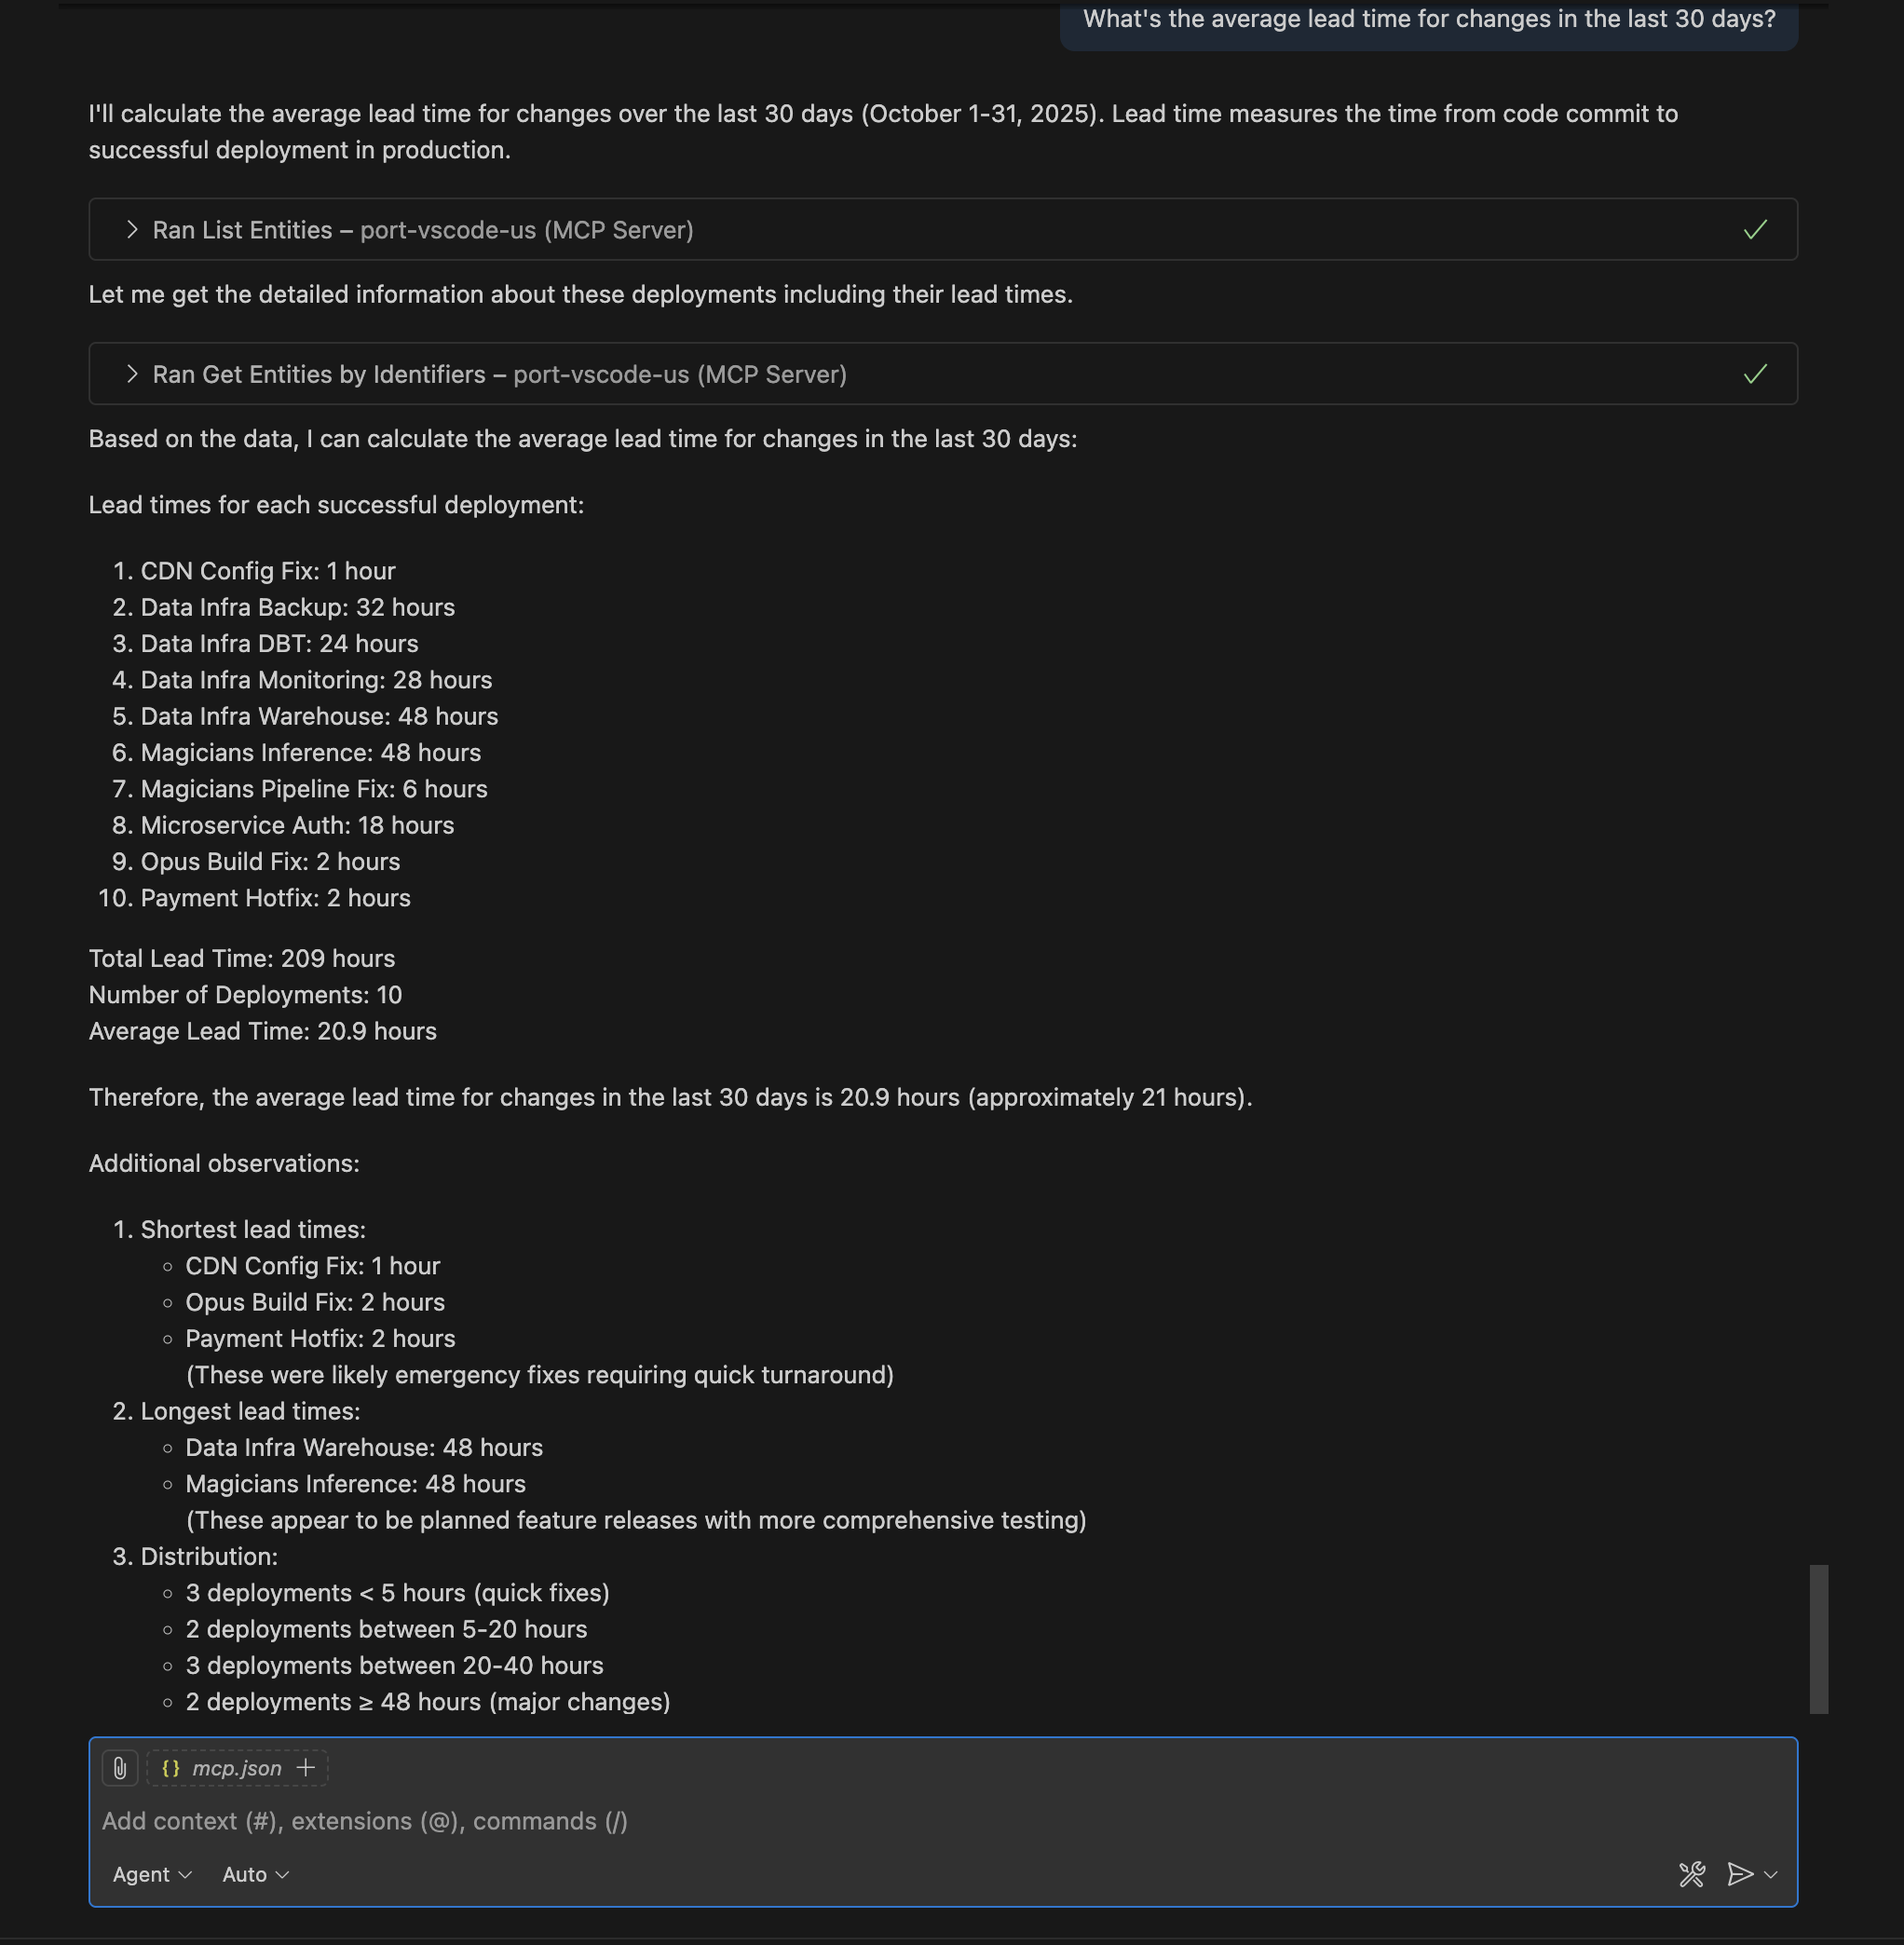
Query: "What's the average lead time for changes in the last 30 days?"
Get visibility into how long it takes to deliver code changes to production across your organization.
- Cursor IDE
- VS Code
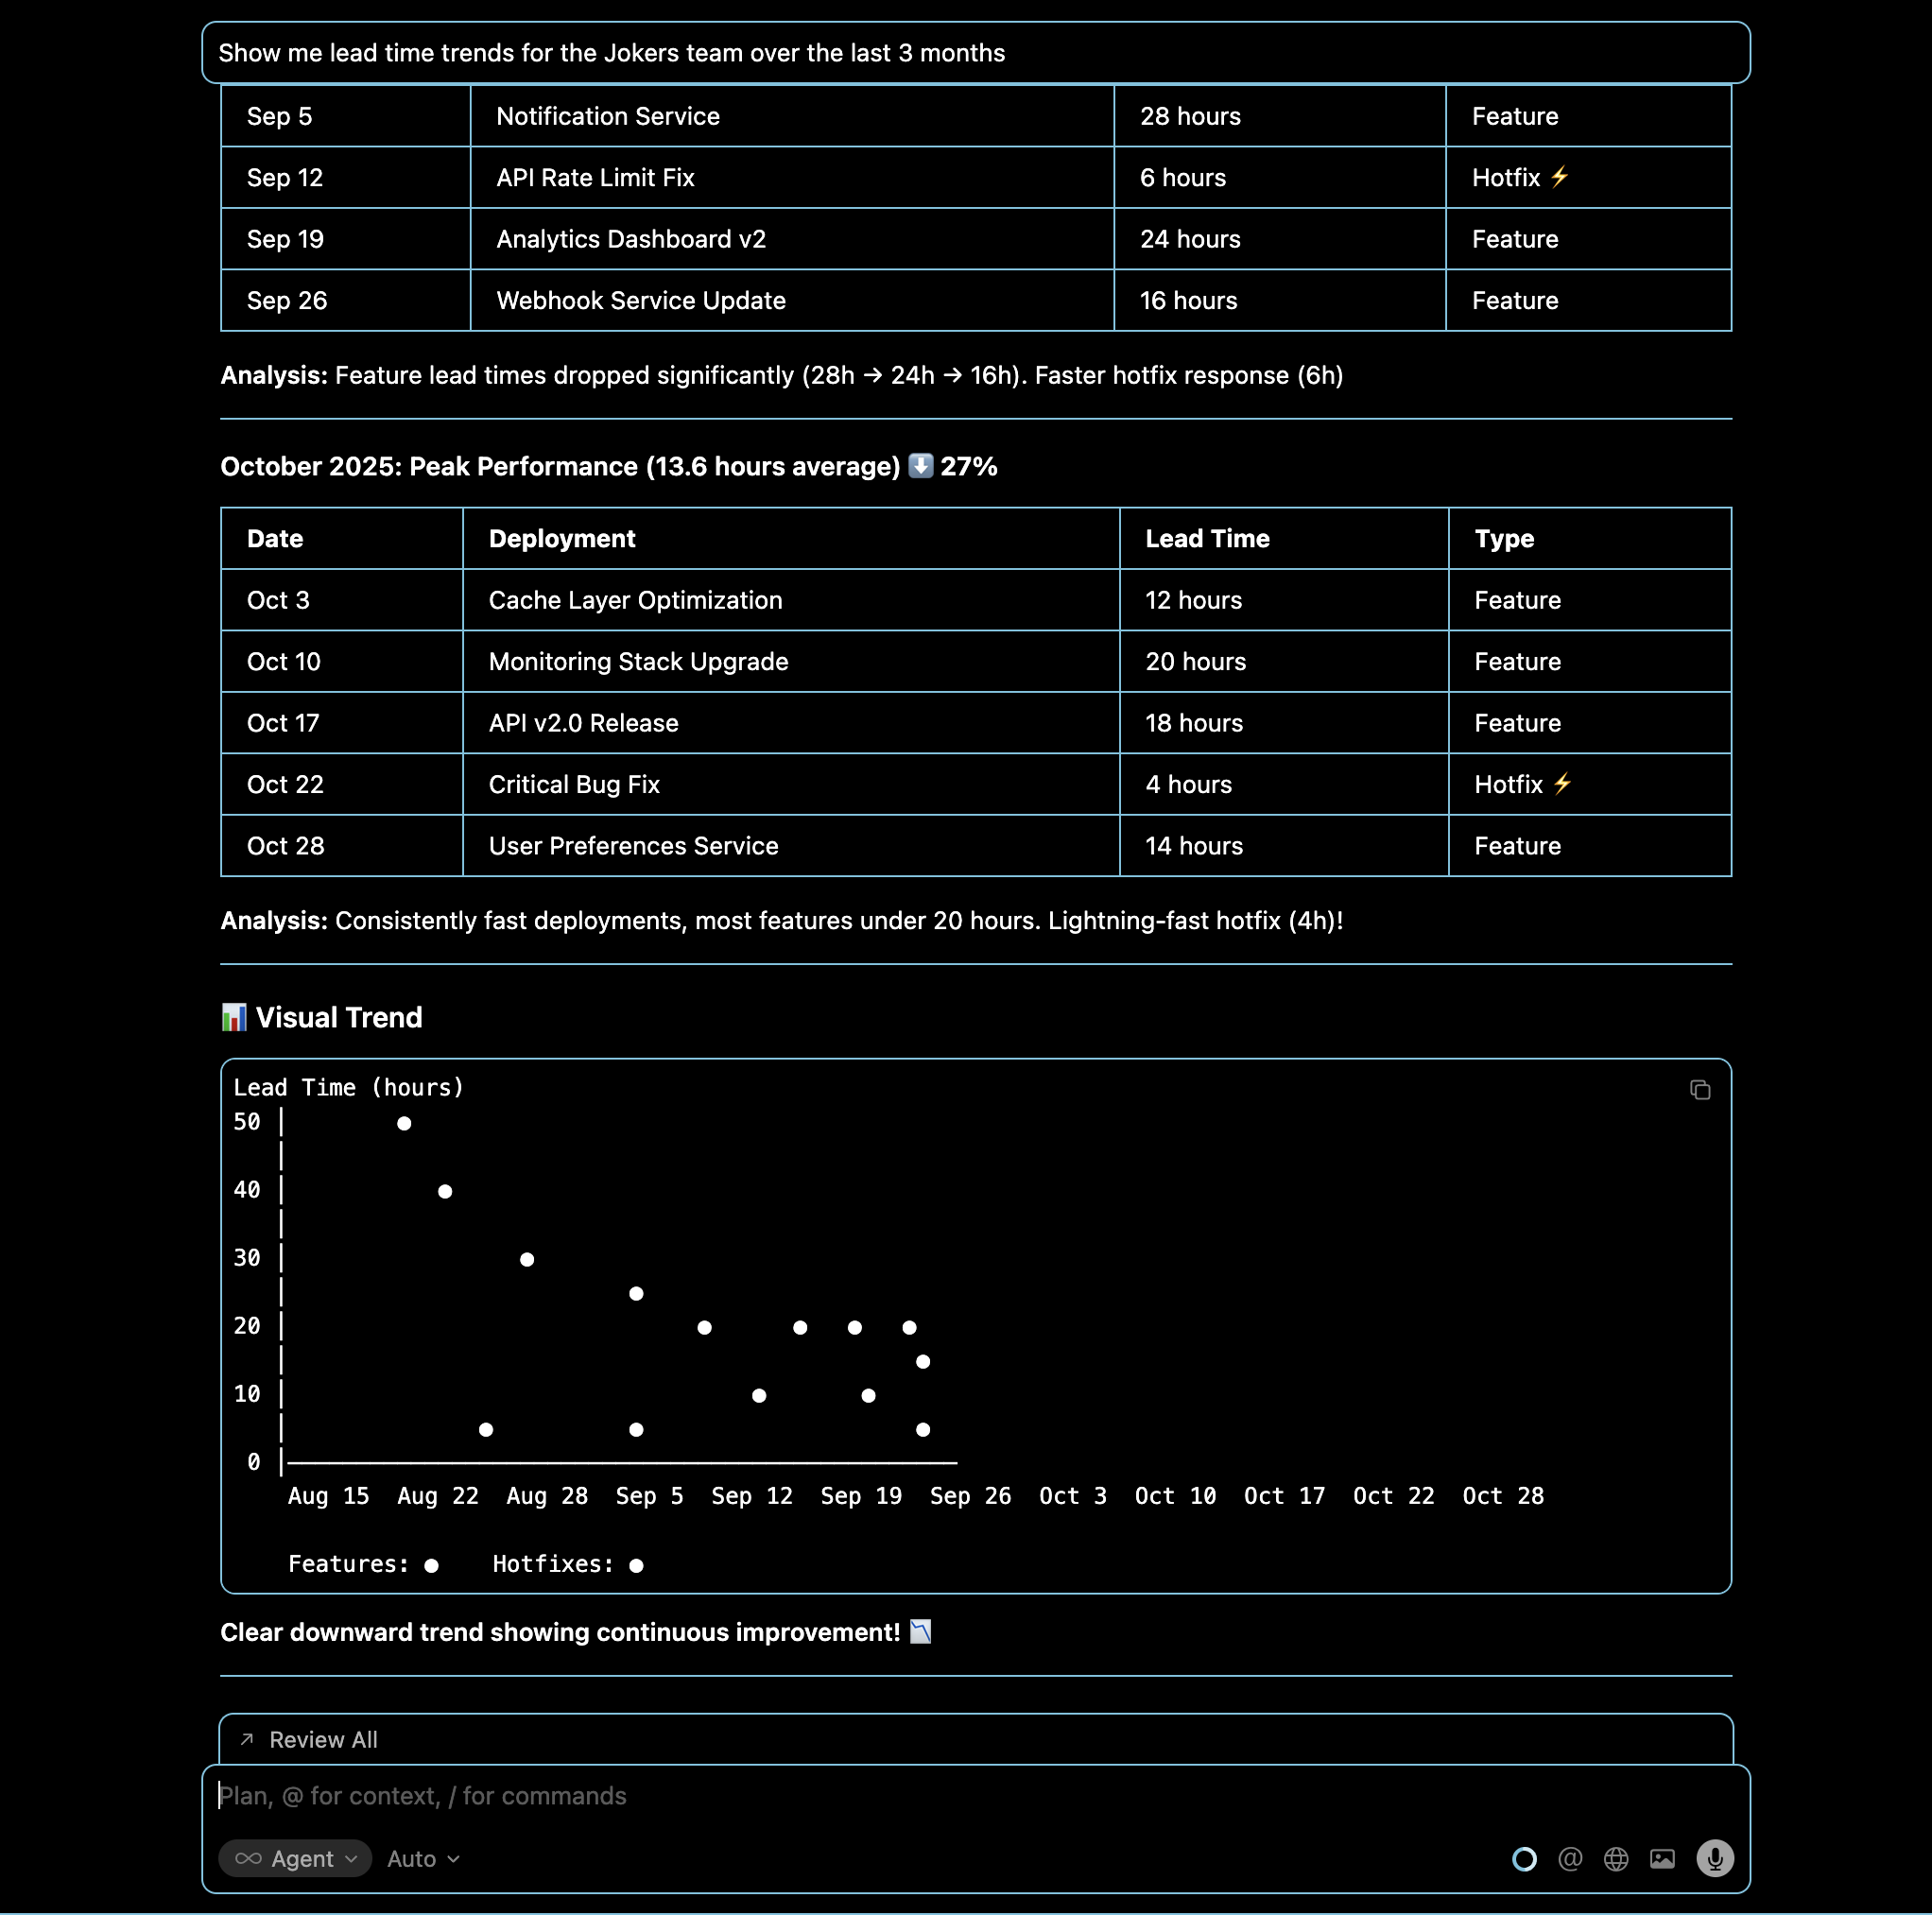
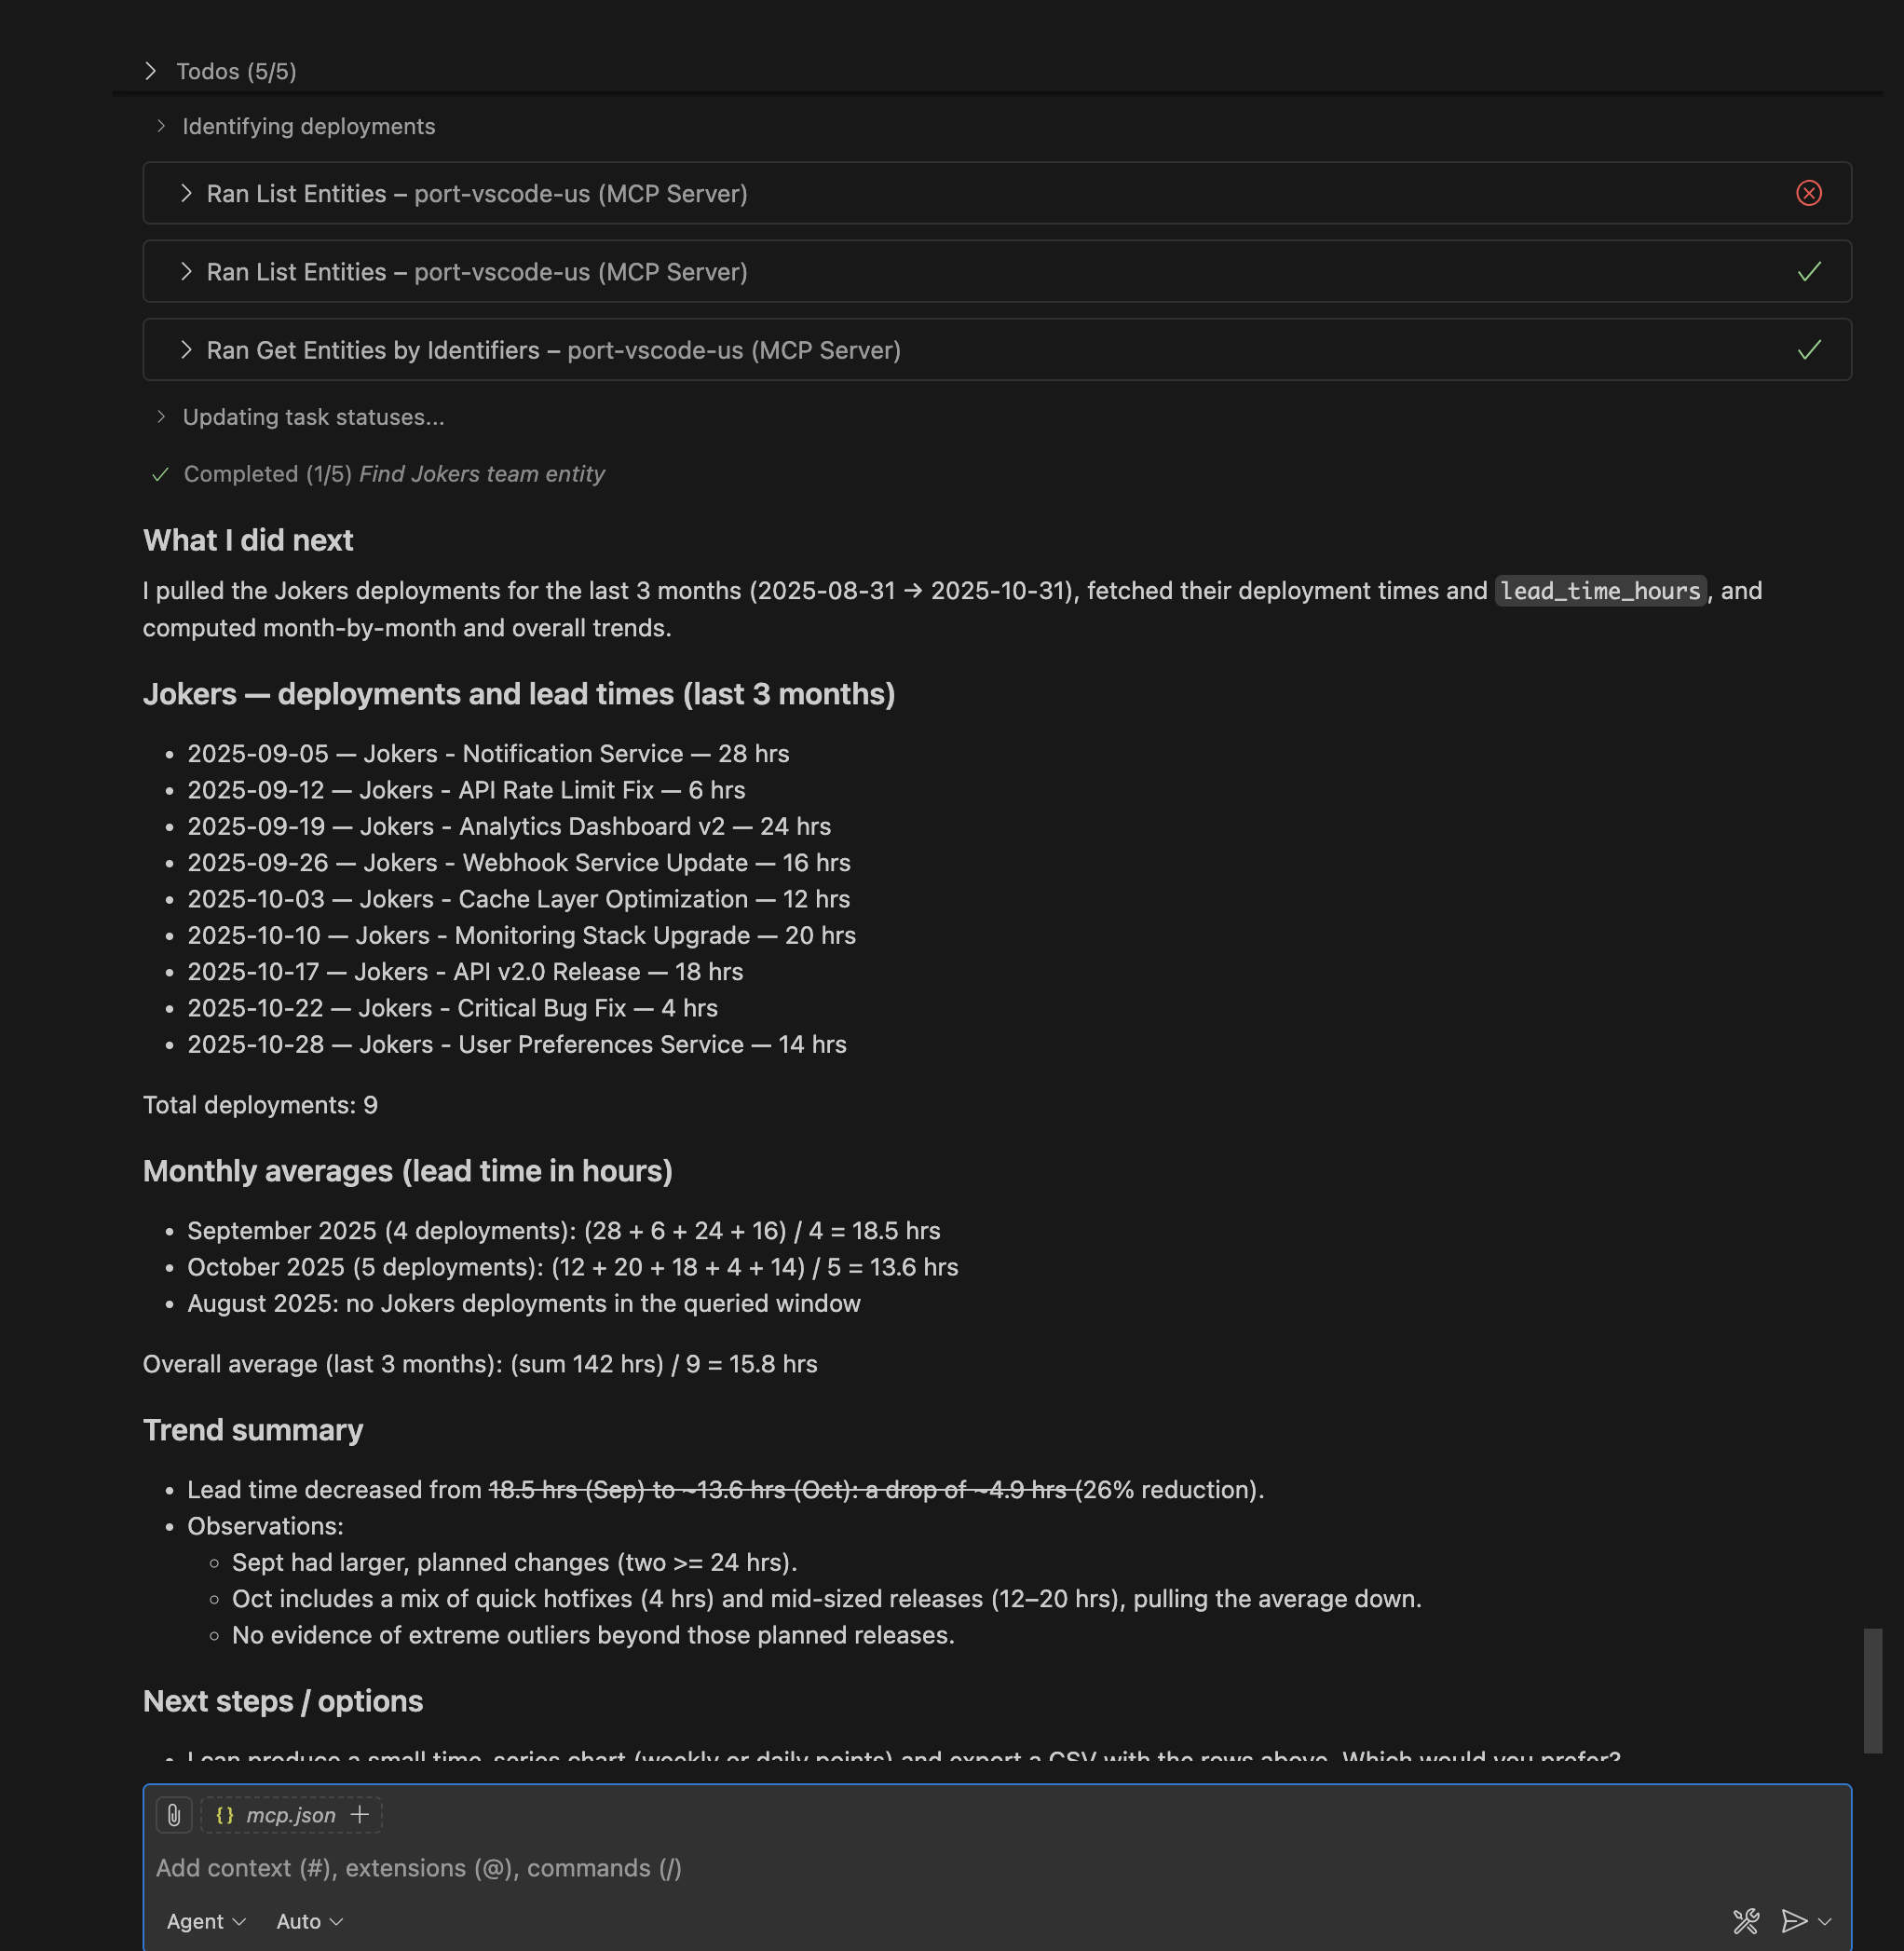
Query: "Show me lead time trends for the Jokers team over the last 3 months"
Track improvement or degradation in a team's delivery speed over time to identify process changes or bottlenecks.
- Cursor IDE
- VS Code
Advanced querying techniques
- Filters
- Trends
- Benchmarks
- Cross-Metrics
Time ranges and filtering:
- "Show me DORA metrics for services tagged as 'critical' in the last 30 days."
- "What's the deployment frequency for deployments owned by the Stardust team since last month?"
- "Show me all incidents with priority 'high' or 'critical' resolved in the last 30 days."
Trend analysis over time:
- "How has our overall change failure rate changed over the last 6 months?"
- "Show me the deployment frequency trend for the Opus team over the last quarter."
- "Has the Data Infra team's lead time improved since last month?"
Performance comparisons:
- "How do our DORA metrics compare to industry benchmarks?"
- "Which teams are performing above/below the organization average for each DORA metric?"
- "Show me services that meet the 'Elite' DORA performance criteria."
Multi-metric analysis:
- "Which services have both high deployment frequency and low change failure rate?"
- "Show me teams with MTTR above 4 hours in the last month."
- "Identify teams that might need help with incident response processes."
Understanding the responses
The MCP server responses rely on Port's data model, using the available MCP tools to access and analyze your data. You can:
Get detailed insights and take action
- Ask your LLM to explain the results and provide context.
- Request actionable recommendations like "how can we improve the lead time?"
- Take follow-up actions directly through the MCP server.
Dive deeper into results
- Drill down into specific metrics with follow-up questions.
- Cross-reference DORA metrics with other Port data like service health or scorecards.
- Explore different time periods or team comparisons.
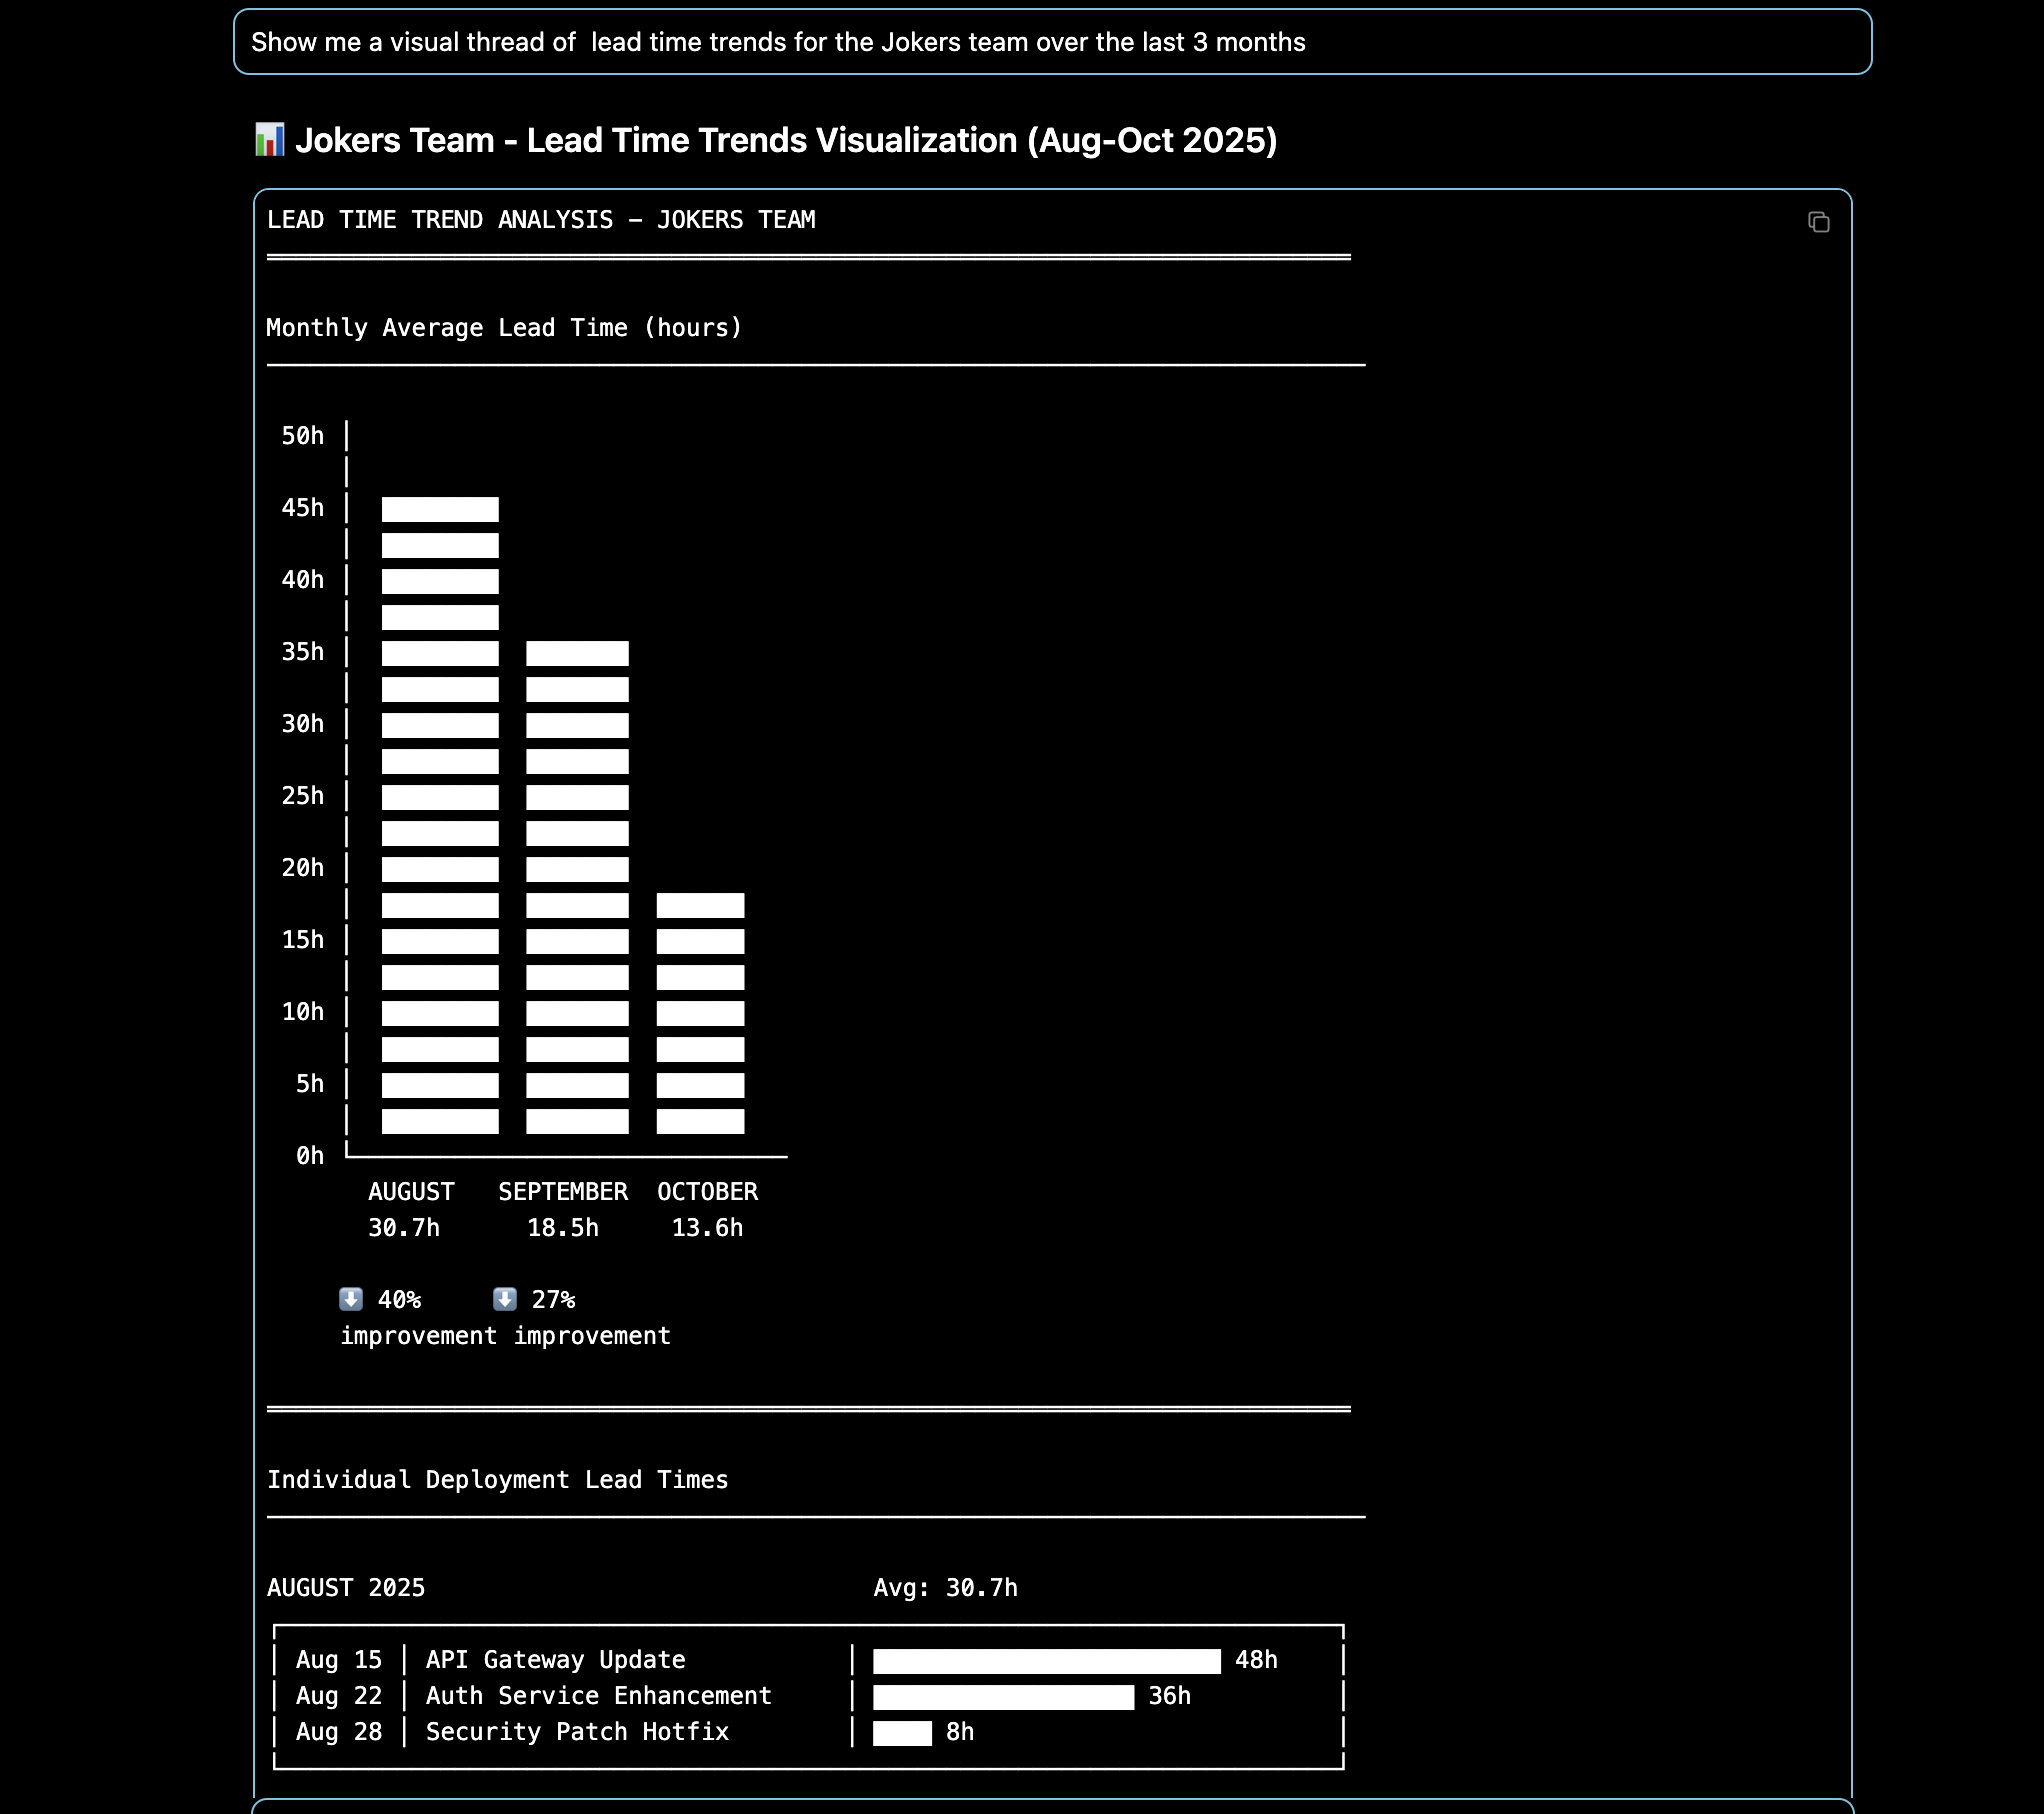
Request custom visualizations
- Ask to show results in a graph or chart format.
- Request to create a custom web application to visualize the data (Claude Artifacts is excellent for this).
- Generate executive-ready dashboards and reports.
To get the most accurate and useful responses:
- Be specific about time ranges (e.g., "last 30 days" instead of "recently").
- Specify teams, services, or environments when relevant.
- Ask follow-up questions to drill down into interesting data points.
- Use the MCP server's ability to cross-reference with other Port data like scorecards and service health.
Next steps
Now that you can query DORA metrics using Port MCP, consider these recommendations:
- Enrich and deepen your DORA data model: Enhance your Port data model with additional deployment and incident sources for faster results and comprehensive dashboards implementation.
- Find areas for improvement: Use the insights gained to identify specific teams, services, or processes that need attention.
- Automate reporting: Use the MCP server in an automated way to produce executive reports or weekly team performance summaries.
- Set up alerts: Configure Port automations to notify teams when DORA metrics cross certain thresholds.
- Expand analysis: Combine DORA metrics with other Port data like service health, scorecards, and dependencies.