Monitor integrations
This guide demonstrates how to set up monitoring and management capabilities for your Port Ocean integrations.
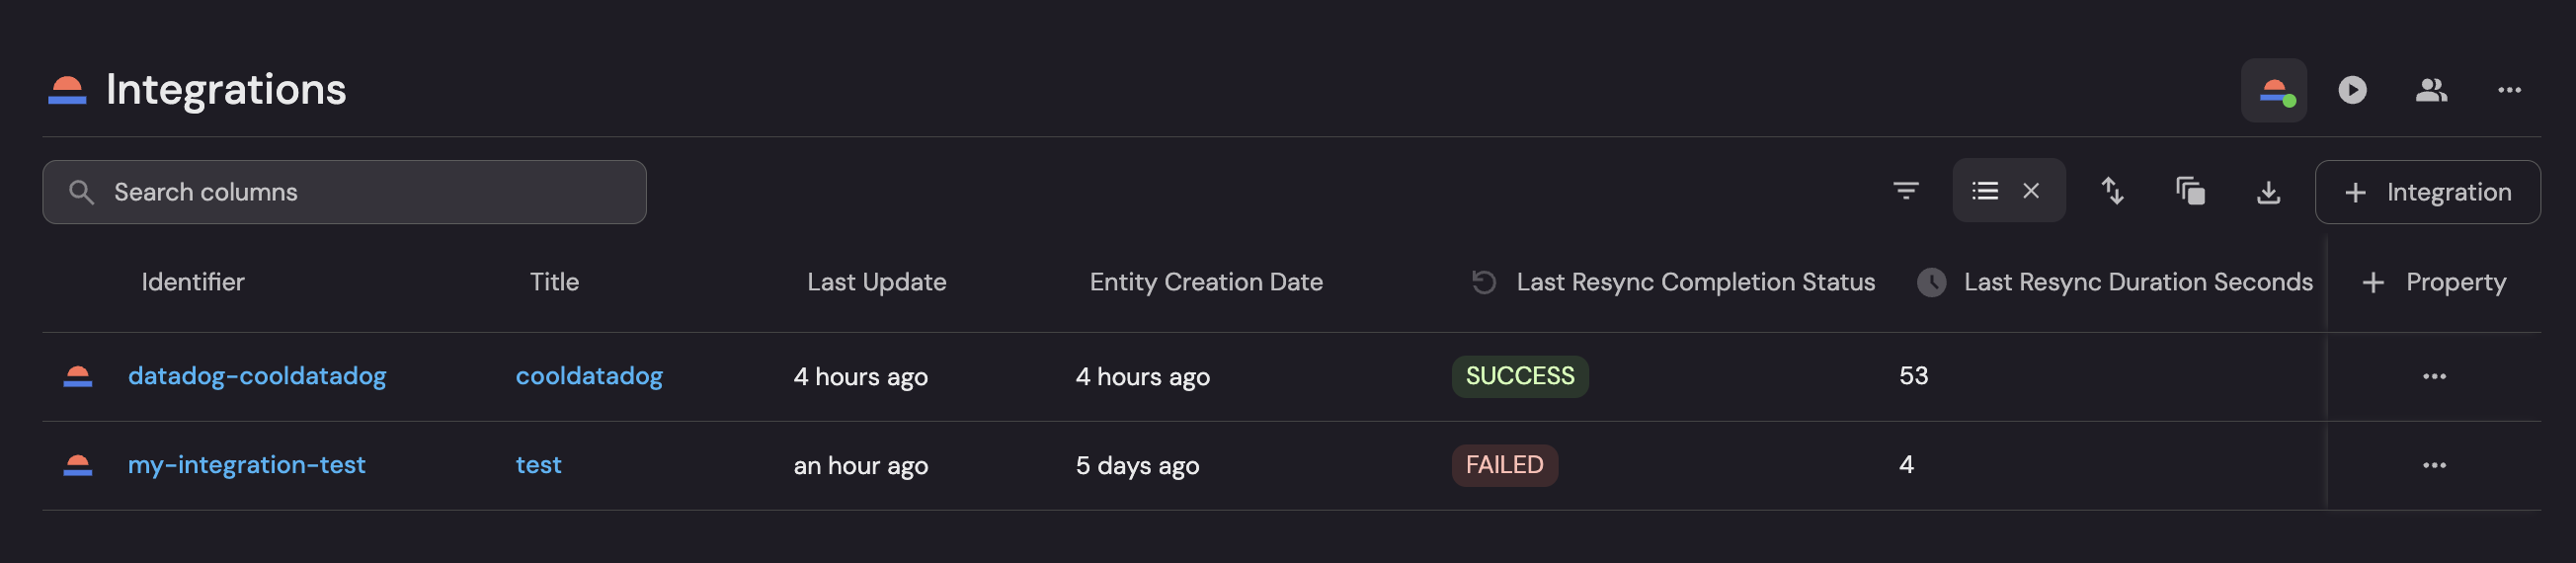
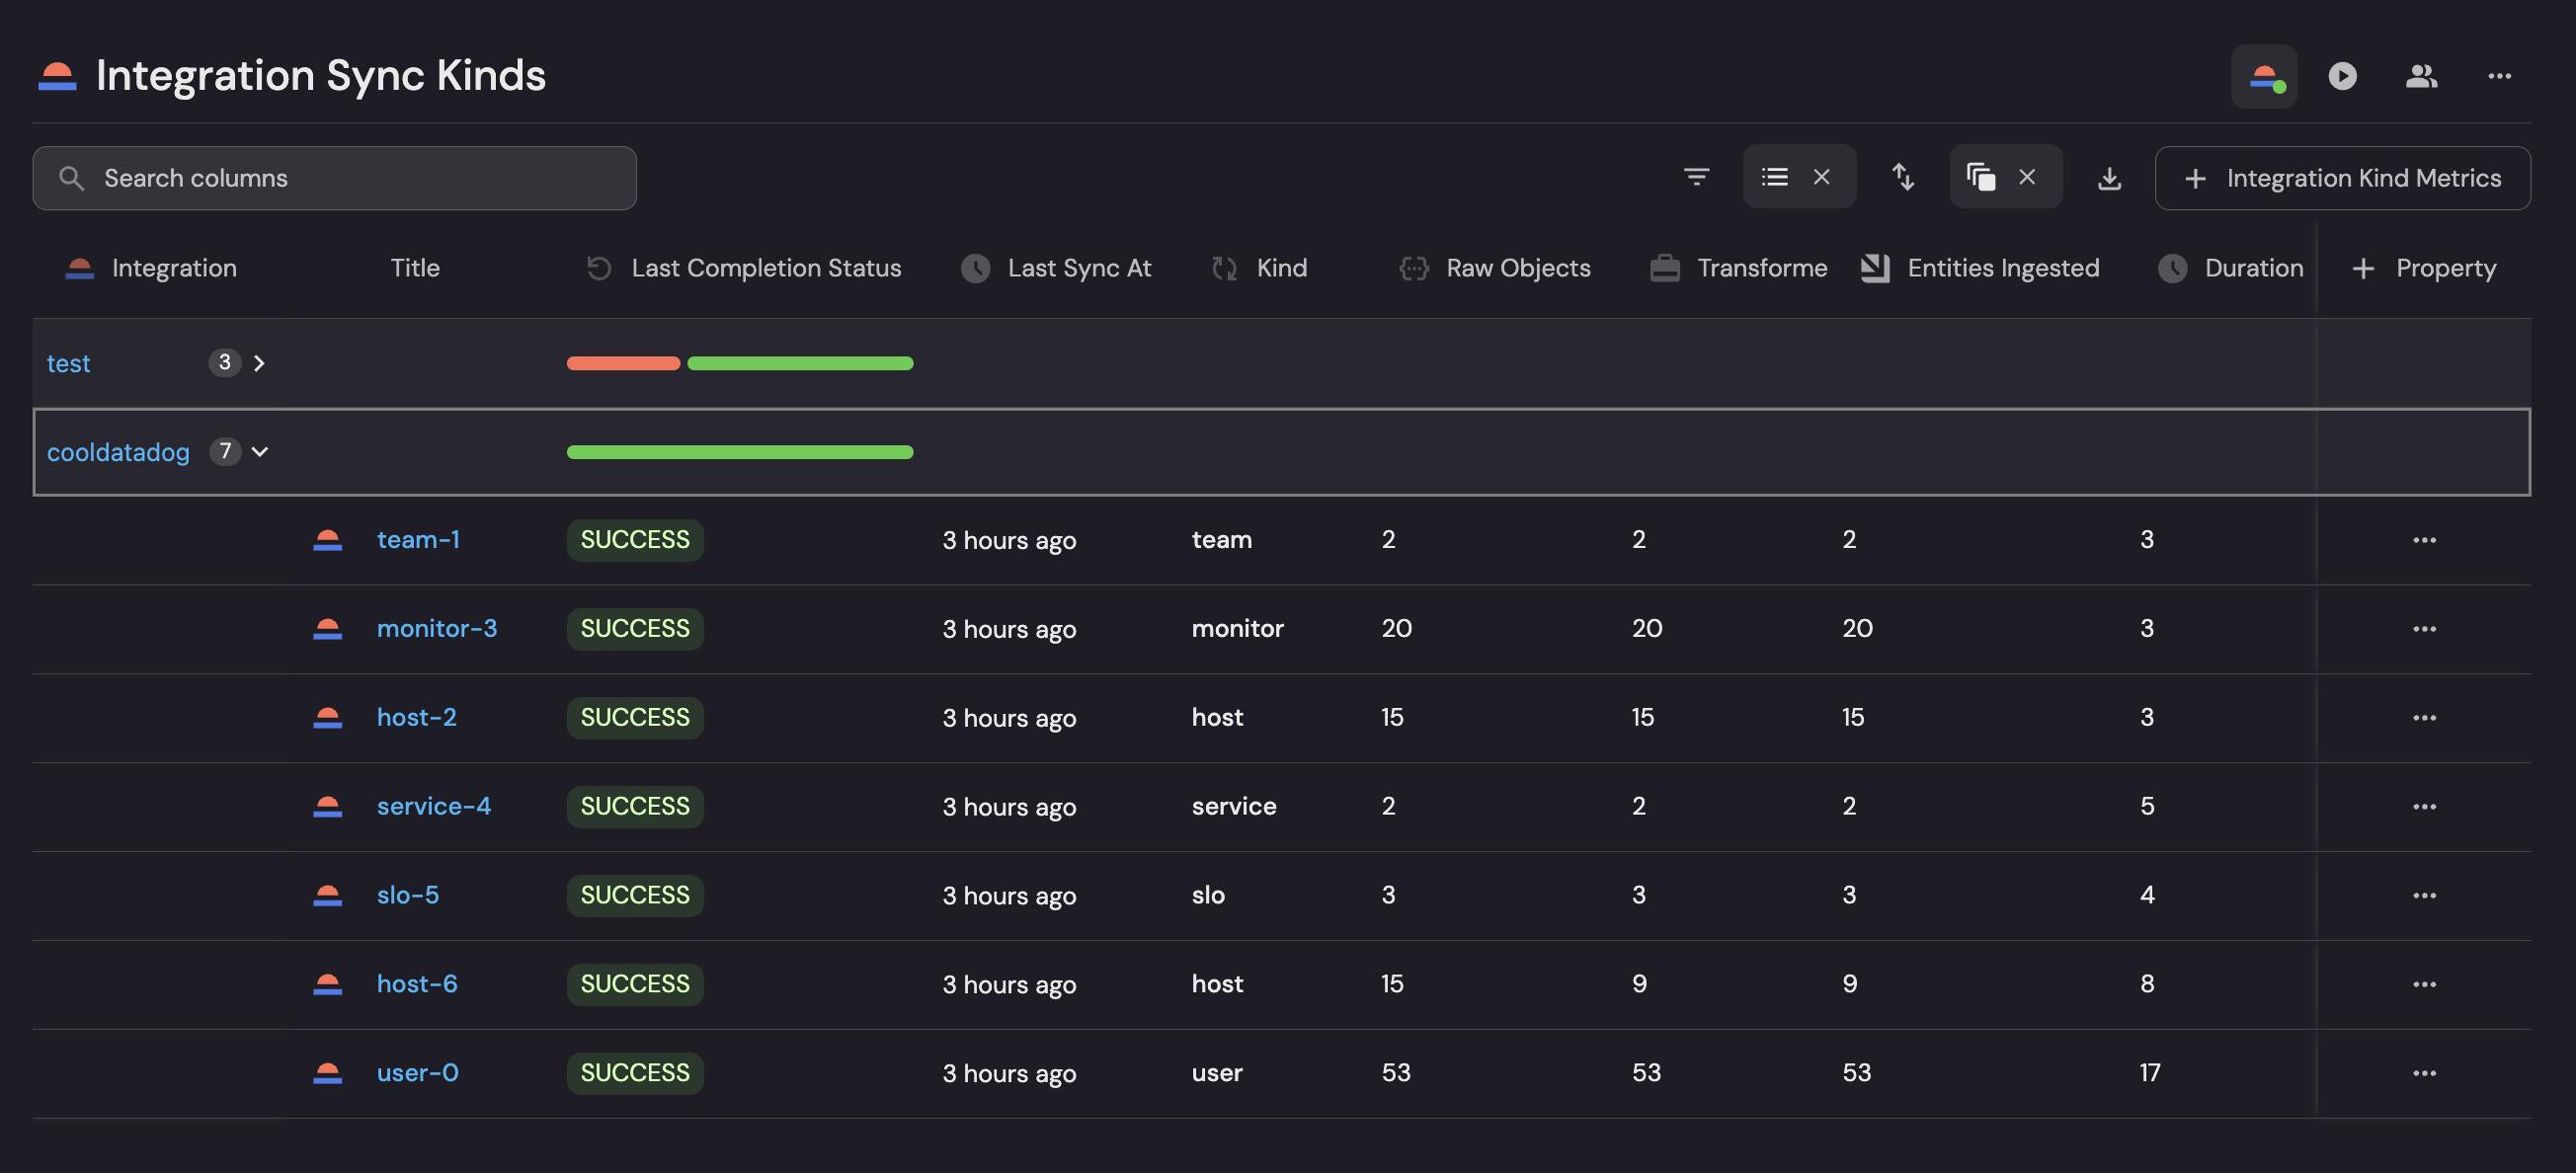
By implementing this monitoring setup, you'll be able to track:
- Overall integration sync status and timing
- Detailed metrics per integration kind
- Object counts at various stages (raw, transformed, ingested)
- Sync duration and performance metrics
Prerequisites
Before you begin, make sure you have:
- Self-hosted Ocean integrations installed.
- Port Ocean version v0.22.0 or later.
If your integration uses the data source processor (DSP) pipeline, review the monitoring limitations before using this setup to track DSP syncs.
Common use cases
- Monitor the health and performance of your integrations
- Track sync status and timing across different integration kinds
- Identify potential issues in the extract-transform-load (ETL) pipeline
- Measure the efficiency of your data ingestion process
Data model setup
Use the following two blueprints to structure your integration data in Port:
The Integration blueprint tracks overall resync status, duration, and timing.
Integration Blueprint (click to expand)
{
  "identifier": "integration",
  "title": "Integration",
  "icon": "Ocean",
  "schema": {
    "properties": {
      "last_resync_completion_status": {
        "type": "string",
        "title": "Last Resync Completion Status",
        "icon": "Reset",
        "enum": [
          "SUCCESS",
          "FAILED"
        ],
        "enumColors": {
          "SUCCESS": "green",
          "FAILED": "red"
        }
      },
      "last_resync_duration": {
        "type": "number",
        "title": "Last Resync Duration Seconds",
        "icon": "Clock"
      },
      "last_resync_at": {
        "icon": "Updates",
        "type": "string",
        "title": "Last Resync At",
        "format": "date-time"
      }
    },
    "required": []
  },
  "mirrorProperties": {},
  "calculationProperties": {},
  "aggregationProperties": {},
  "relations": {}
}
The Integration Kind Metrics blueprint tracks detailed metrics for specific integration kinds, including raw, transformed, and ingested objects.
Integration Kind Metrics Blueprint (click to expand)
{
  "identifier": "integration_kind_metrics",
  "description": "Metrics on integration sync kind",
  "title": "Integration Kind Metrics",
  "icon": "Ocean",
  "schema": {
    "properties": {
      "kind": {
        "icon": "Sync",
        "type": "string",
        "title": "Kind"
      },
      "raw_objects": {
        "icon": "JsonEditor",
        "type": "number",
        "title": "Raw Objects"
      },
      "transformed_objects": {
        "icon": "Travel",
        "type": "number",
        "title": "Transformed Objects"
      },
      "entities_ingested": {
        "icon": "Port",
        "type": "number",
        "title": "Entities Ingested"
      },
      "duration": {
        "icon": "Clock",
        "type": "number",
        "title": "Duration"
      },
      "last_completion_status": {
        "type": "string",
        "title": "Last Completion Status",
        "icon": "Reset",
        "enum": [
          "SUCCESS",
          "FAILED"
        ],
        "enumColors": {
          "SUCCESS": "green",
          "FAILED": "red"
        }
      },
      "last_sync_at": {
        "type": "string",
        "title": "Last Sync At",
        "icon": "Clock",
        "format": "date-time"
      }
    },
    "required": []
  },
  "mirrorProperties": {},
  "calculationProperties": {},
  "aggregationProperties": {},
  "relations": {
    "integration": {
      "title": "Integration",
      "target": "integration",
      "required": false,
      "many": false
    }
  }
}
Webhook setup
- Go to the connectors page in Port.
- Click on + Connector, and choose the Webhook type.
- Click on Custom integration and create a new webhook.
- Copy and store the generated webhook URL (should be in a format like
https://ingest.port.io/abc123). - Add the mappings below in the relevant section on the webhook configuration (see screenshot below).
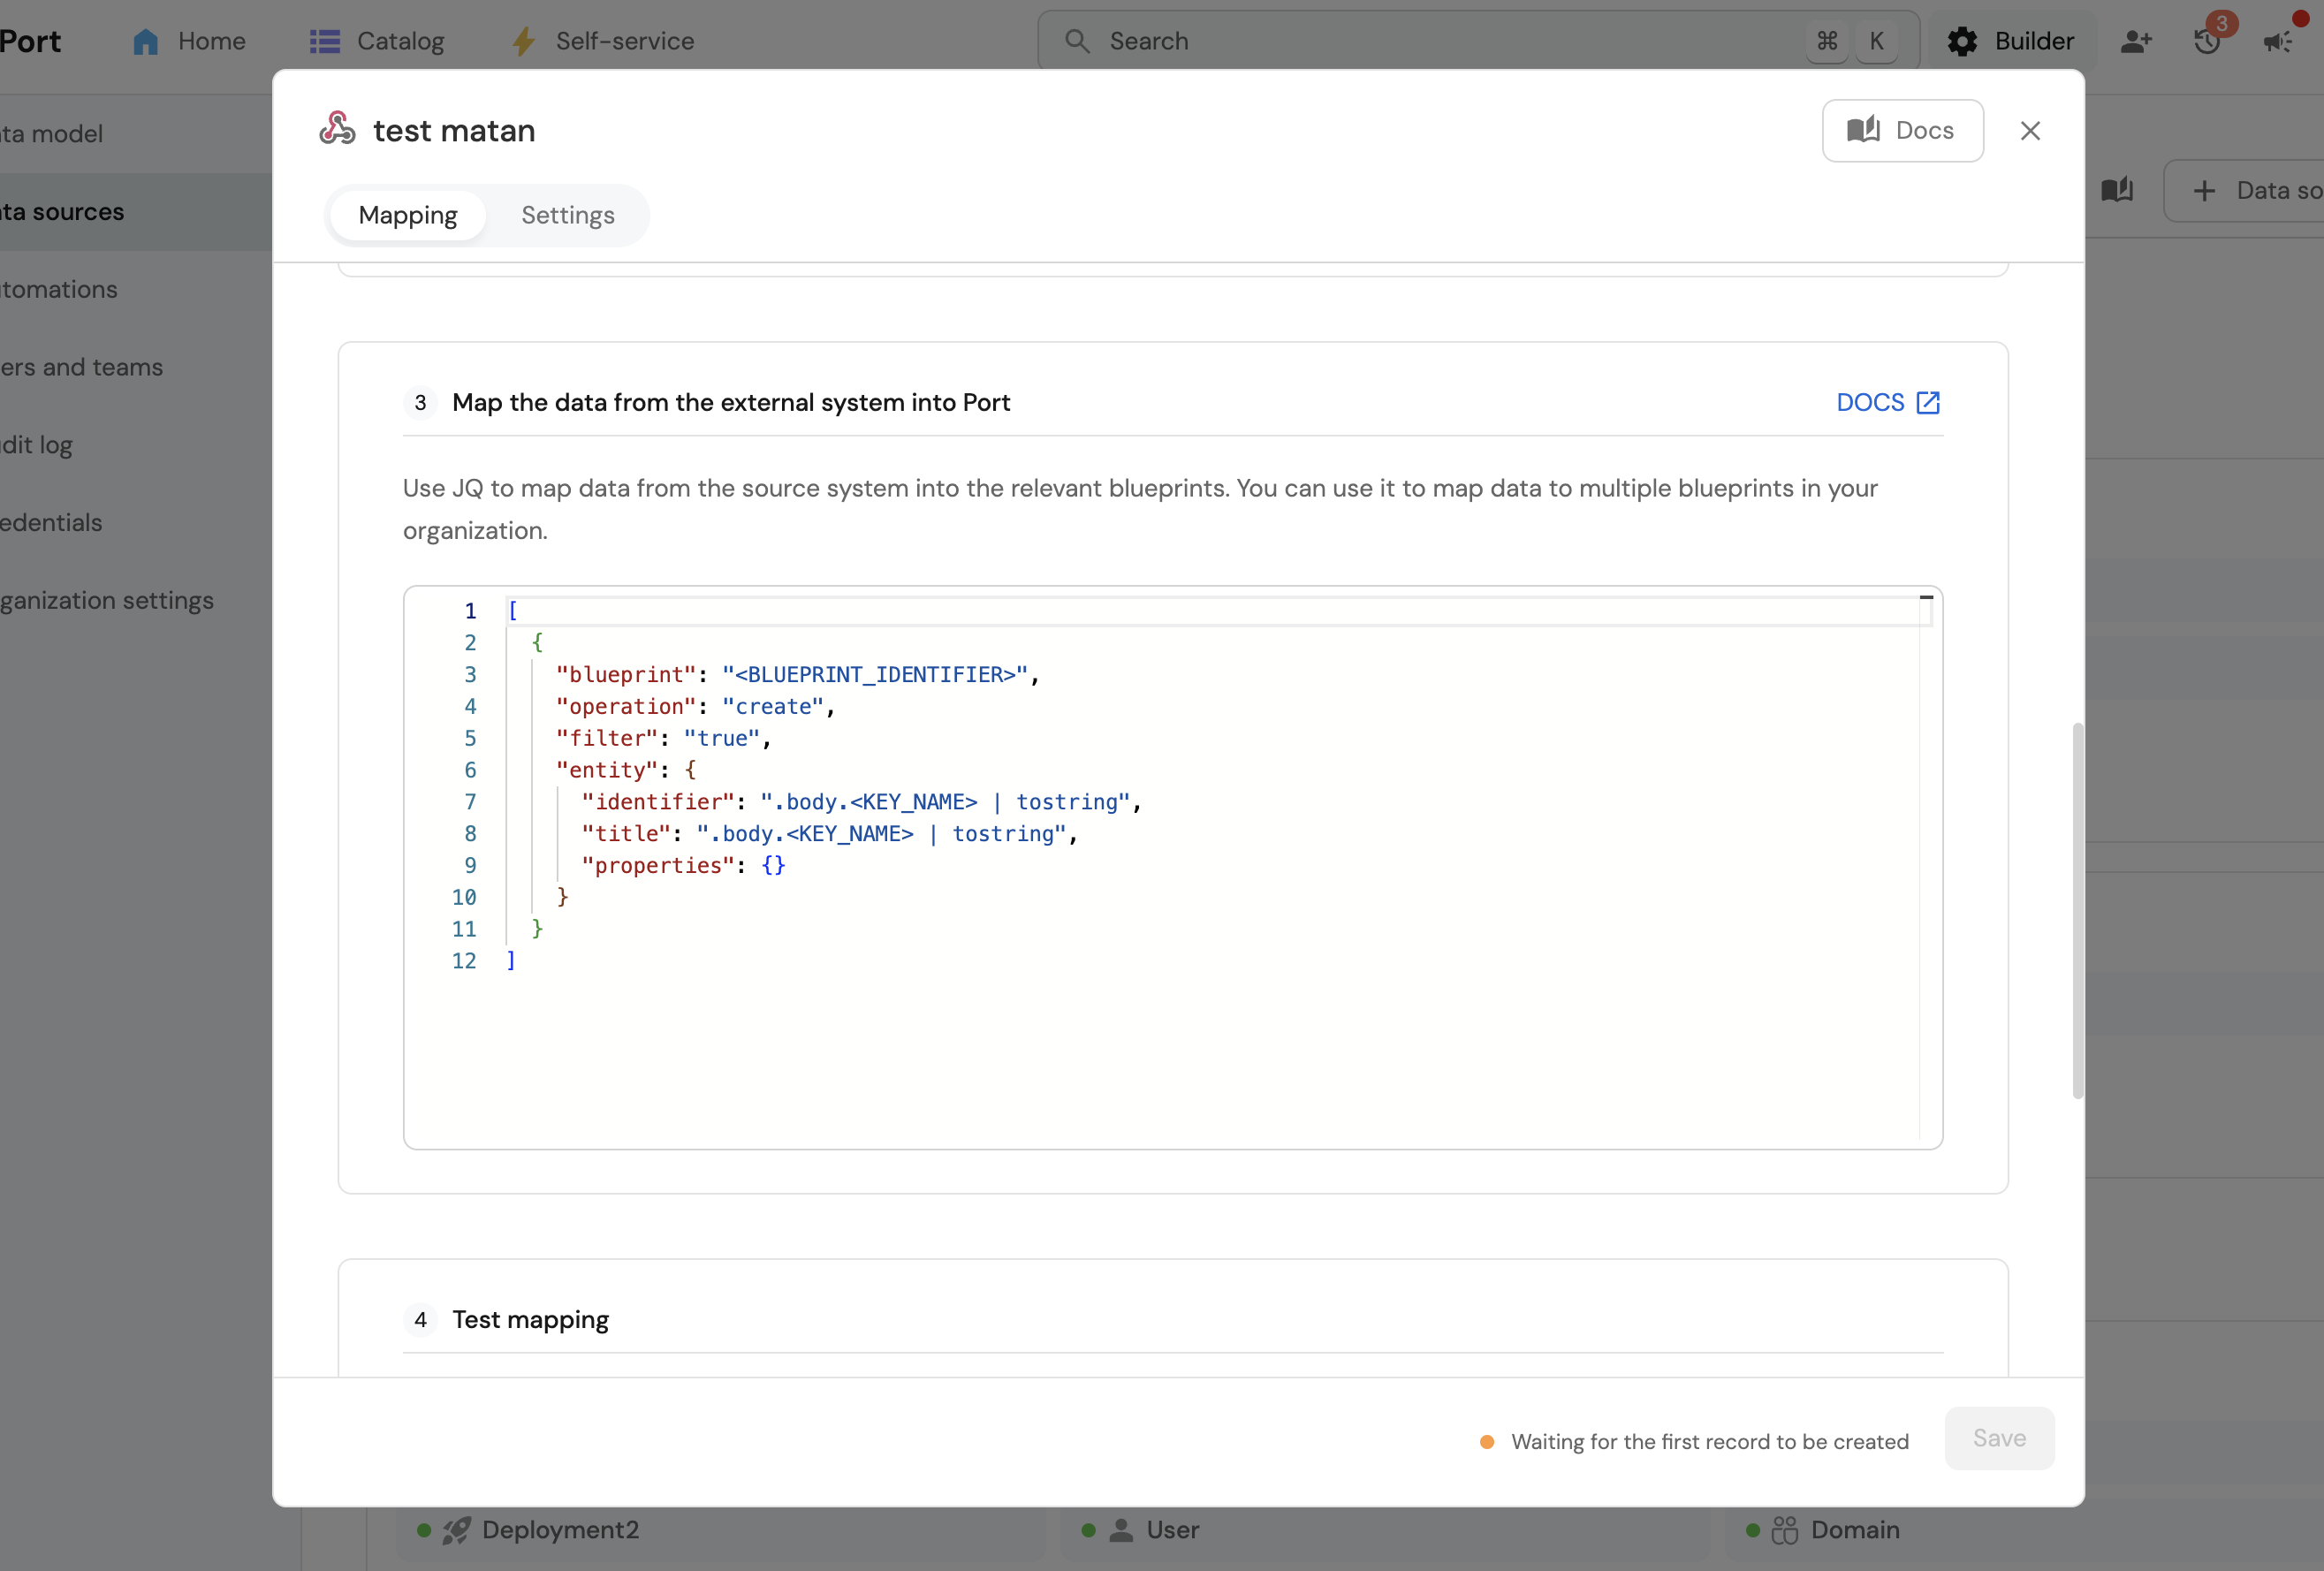
For Integration Kind Metrics:
Integration Kind Metrics Webhook Mapping (click to expand)
{
  "blueprint": "integration_kind_metrics",
  "operation": "create",
  "filter": ".body.kindIdentifier != '__runtime__'",
  "entity": {
    "identifier": ".body.kindIdentifier",
    "title": ".body.kindIdentifier",
    "properties": {
      "kind": ".body.kind",
      "duration": ".body.metrics.phase.resync.durationSeconds|round",
      "raw_objects": ".body.metrics.phase.extract.objectCountType.rawExtracted.objectCount",
      "transformed_objects": ".body.metrics.phase.transform.objectCountType.transformed.objectCount",
      "entities_ingested": ".body.metrics.phase.load.objectCountType.loaded.objectCount",
      "last_completion_status": "if .body.metrics.phase.resync.success == 1 then \"SUCCESS\" else \"FAILED\" end",
      "last_sync_at": "now | todateiso8601"
    },
    "relations": {
      "integration": ".body.integrationType + \"-\" + .body.integrationIdentifier"
    }
  }
}
For Integration Runtime Status:
Integration Runtime Status Webhook Mapping (click to expand)
{
  "blueprint": "integration",
  "operation": "create",
  "filter": ".body.kindIdentifier == '__runtime__'",
  "entity": {
    "identifier": ".body.integrationType + \"-\" + .body.integrationIdentifier",
    "title": ".body.integrationIdentifier",
    "properties": {
      "last_resync_duration": ".body.metrics.phase.resync.durationSeconds|round",
      "last_resync_completion_status": "if .body.metrics.phase.resync.success == 1 then \"SUCCESS\" else \"FAILED\" end",
      "last_resync_at": "now | todateiso8601"
    }
  }
}
Ensure the mappings are correctly added to handle both cases distinctly.
Configure metrics collection
Make sure you've updated the port-ocean version to use v0.22.0 or later.
To activate metrics collection, pass the following parameters when configuring your integration:
OCEAN__METRICS__ENABLED=true
OCEAN__METRICS__WEBHOOK_URL=<THE GENERATED WEBHOOK URL>
Replace <THE GENERATED WEBHOOK URL> with the URL you generated in Step 2.
Remember to repeat this step for each integration you want to monitor.
Create a monitoring dashboard
Now you can set up a dashboard to visualize your integration metrics:
- Navigate to your context lake.
- Click
+, select New dashboard, and clickCreateto create a new dashboard. - Add a Table widget, and select the
integrationblueprint. - Add a Line chart widget. Click + Line and select the
integrationblueprint, the integration you want to monitor, and thelast resync durationproperty. - Add Number chart to show the
raw,transformed, andingestedcounts as either aggregated values or for a specific integration.
Test your monitoring
After completing these steps:
- Trigger your integration sync
- Check Port to verify the status updates and metrics
- Review your dashboard to ensure all widgets are populated with data
All Ocean integrations expose a health check endpoint at /docs.
For example, if your integration is accessible at https://your-integration-host:8000, you can access the health check at https://your-integration-host:8000/docs.
Limitations
This guide collects Ocean metrics through a webhook and maps the legacy Ocean metrics payload into catalog entities. These mappings do not parse the DSP sync API response, so do not assume the webhook data matches the sync history you see in your portal.
For integrations on the data source processor (DSP) pipeline, use the /v1/events/... endpoint family when retrieving sync history and metrics through the API:
-
Call
GET /v1/events/integrationInternalId/{INTEGRATION_INTERNAL_ID}/syncsMetadatato list recent syncs and obtain acorrelationId. -
Call
GET /v1/events/integrationInternalId/{INTEGRATION_INTERNAL_ID}/correlationId/{CORRELATION_ID}/metricswith thatcorrelationIdto retrieve the sync's status and per-kind metrics.
The legacy /v1/integration/{integrationInternalId}/syncsMetadata and /syncMetrics routes do not return DSP sync data and can return {"ok":true,"count":0,"data":[]} even for a valid integration _id. An empty legacy response does not mean that your integration has not synced or that its sync failed.
See retrieve sync data through the API for permissions, placeholder values, and response differences. Adapt your collection and mapping logic before using DSP API responses with this guide's blueprints.