Measure sprint health with Jira
This guide walks you through measuring and visualizing sprint health at the team level. You will learn how to ingest sprint data from Jira issues, define sprint health metrics like completion rate and scope change, roll those metrics up to teams using aggregation properties, build trend visualizations, and enforce maturity standards with a scorecard.
Common use cases
- Track delivery predictability: Measure how consistently teams complete planned sprint work.
- Detect scope creep: Surface teams where mid-sprint additions are undermining planning.
- Reduce carryover: Identify teams that routinely carry unfinished work into the next sprint.
- Drive continuous improvement: Use maturity levels to encourage teams toward healthier sprint practices.
Prerequisites
- You have a Port account and have completed the onboarding process.
- Port's Jira integration is installed and syncing issues.
- You have identified the custom field IDs for the following fields in your Jira instance:
- Sprint Field ID to ingest the sprint name for each issue (see ingesting sprint data).
- Story Points Field ID to ingest the story points for each issue.
How to find your custom field IDsYou can find your custom field IDs by navigating to the Custom Fields section in your Jira instance and clicking on the field you want to use. The ID will be displayed in the URL. Learn more
Understanding sprint health metrics
Before configuring Port, let's define the three metrics that form the foundation of sprint health measurement:
| Metric | What it measures | Formula |
|---|---|---|
| Completion rate | Percentage of sprint-committed issues that were resolved by sprint end. | (issues done in sprint / total issues in sprint) × 100 |
| Scope change % | Percentage of issues added to the sprint after it started. | (issues added mid-sprint / total issues in sprint) × 100 |
| Carryover rate | Percentage of issues carried from the previous sprint without being completed. | (unresolved issues from prior sprint / total issues in sprint) × 100 |
A healthy sprint typically shows a high completion rate (>90%), low scope change (<10%), and low carryover (<10%).
Set up data model
We will extend the Jira issue blueprint with sprint-related fields and then add aggregation properties to the _team blueprint to roll up sprint health metrics.
Extend the Jira issue blueprint
Add properties that capture sprint context for each issue. These fields let us distinguish between issues that were planned, added mid-sprint, or carried over.
-
Go to your Builder page.
-
Search for the
Jira Issueblueprint and click on it. -
Click on the
...button in the top right corner, and choose{...} Edit JSON. -
Merge the following properties into the
propertiesobject of your existing blueprint:Sprint health properties for Jira issue (click to expand)
"sprint": {"title": "Sprint","type": "string","description": "The name of the current or most recent sprint for this issue"},"sprintState": {"title": "Sprint State","type": "string","enum": ["active", "closed", "future"],"description": "Whether the sprint is active, closed, or planned"},"storyPoints": {"title": "Story Points","type": "number","description": "The estimated effort for this issue"},"addedMidSprint": {"title": "Added Mid-Sprint","type": "boolean","description": "Whether this issue was added after the sprint started"},"carriedOver": {"title": "Carried Over","type": "boolean","description": "Whether this issue was carried from a previous sprint"} -
Click
Saveto update the blueprint.
Add a team relation to Jira issues
To roll up sprint metrics per team, we need a relation from Jira Issue to the _team blueprint. If your issues already have a team relation (for example, via the assignee's team), you can skip this step.
-
In the
Jira Issueblueprint, click on the...button in the top right corner, and choose{...} Edit JSON. -
Add the following to the
relationsobject:"team": {"target": "_team","title": "Team","description": "The team responsible for this issue","required": false,"many": false} -
Click
Save.
Add aggregation properties to the team blueprint
Now we will add aggregation properties to the _team blueprint to compute sprint health metrics from the related Jira issues.
-
Go to your Builder page.
-
Search for the
Teamblueprint (_team) and click on it. -
Click on the
...button in the top right corner, and choose{...} Edit JSON. -
Add the following aggregation properties:
Sprint health aggregation properties (click to expand)
"sprintIssuesTotal": {"title": "Sprint Issues (Total)","icon": "DefaultProperty","type": "number","target": "jiraIssue","query": {"combinator": "and","rules": [{"property": "sprintState","operator": "=","value": "active"}]},"calculationSpec": {"func": "count","calculationBy": "entities"}},"sprintIssuesDone": {"title": "Sprint Issues (Done)","icon": "DefaultProperty","type": "number","target": "jiraIssue","query": {"combinator": "and","rules": [{"property": "sprintState","operator": "=","value": "active"},{"property": "status","operator": "=","value": "Done"}]},"calculationSpec": {"func": "count","calculationBy": "entities"}},"sprintIssuesAddedMidSprint": {"title": "Sprint Issues (Added Mid-Sprint)","icon": "DefaultProperty","type": "number","target": "jiraIssue","query": {"combinator": "and","rules": [{"property": "sprintState","operator": "=","value": "active"},{"property": "addedMidSprint","operator": "=","value": true}]},"calculationSpec": {"func": "count","calculationBy": "entities"}},"sprintIssuesCarriedOver": {"title": "Sprint Issues (Carried Over)","icon": "DefaultProperty","type": "number","target": "jiraIssue","query": {"combinator": "and","rules": [{"property": "sprintState","operator": "=","value": "active"},{"property": "carriedOver","operator": "=","value": true}]},"calculationSpec": {"func": "count","calculationBy": "entities"}},"sprintStoryPointsTotal": {"title": "Sprint Story Points (Total)","icon": "DefaultProperty","type": "number","target": "jiraIssue","query": {"combinator": "and","rules": [{"property": "sprintState","operator": "=","value": "active"}]},"calculationSpec": {"func": "sum","calculationBy": "property","property": "storyPoints"}},"sprintStoryPointsDone": {"title": "Sprint Story Points (Done)","icon": "DefaultProperty","type": "number","target": "jiraIssue","query": {"combinator": "and","rules": [{"property": "sprintState","operator": "=","value": "active"},{"property": "status","operator": "=","value": "Done"}]},"calculationSpec": {"func": "sum","calculationBy": "property","property": "storyPoints"}} -
Click
Save.
Add calculation properties for percentages
Aggregation properties give us the raw counts. To turn them into percentages, add calculation properties to the _team blueprint:
-
In the
Teamblueprint JSON, click on the...button in the top right corner, and choose{...} Edit JSON. Then add the following to thecalculationPropertiesobject:Sprint health calculation properties (click to expand)
"sprintCompletionRate": {"title": "Sprint Completion Rate (%)","icon": "Star","type": "number","calculation": "if .properties.sprintIssuesTotal > 0 then ((.properties.sprintIssuesDone / .properties.sprintIssuesTotal) * 100 | floor) else null end"},"sprintScopeChangePercent": {"title": "Sprint Scope Change (%)","icon": "Alert","type": "number","calculation": "if .properties.sprintIssuesTotal > 0 then ((.properties.sprintIssuesAddedMidSprint / .properties.sprintIssuesTotal) * 100 | floor) else null end"},"sprintCarryoverRate": {"title": "Sprint Carryover Rate (%)","icon": "Clock","type": "number","calculation": "if .properties.sprintIssuesTotal > 0 then ((.properties.sprintIssuesCarriedOver / .properties.sprintIssuesTotal) * 100 | floor) else null end"} -
Click
Save.
Set up data source mapping
Update your Jira integration mapping to populate the new sprint health fields. The mapping uses the Jira sprint custom field to extract sprint name, state, and derived flags for mid-sprint additions and carryover.
-
Go to your Data Sources page.
-
Select your Jira integration.
-
Update the
issueresource mapping to include the sprint health properties:Issue mapping with sprint health fields (click to expand)
- kind: issueselector:query: "true"jql: "sprint is not EMPTY AND ((statusCategory != Done) OR (updated >= -4w))"port:entity:mappings:identifier: .keytitle: .fields.summaryblueprint: '"jiraIssue"'properties:url: (.self | split("/") | .[:3] | join("/")) + "/browse/" + .keystatus: .fields.status.nameissueType: .fields.issuetype.namecomponents: .fields.componentscreator: .fields.creator.emailAddresspriority: .fields.priority.namelabels: .fields.labelscreated: .fields.createdupdated: .fields.updatedsprint: .fields.customfield_XXXXX[-1].name // ""sprintState: .fields.customfield_XXXXX[-1].state // nullstoryPoints: .fields.customfield_YYYYY // nulladdedMidSprint: >-((.fields.customfield_XXXXX[-1].startDate // null) as $start |if $start != null then((.fields.created[0:19] + "Z" | fromdateiso8601) > ($start[0:19] + "Z" | fromdateiso8601))else false end)carriedOver: >-((.fields.customfield_XXXXX | length) as $count |if $count > 1 then(.fields.customfield_XXXXX[-2].state == "closed"and (.fields.status.statusCategory.key != "done"))else false end)relations:project: .fields.project.keyparentIssue: .fields.parent.keysubtasks: .fields.subtasks | map(.key)team: .fields.customfield_ZZZZZ.value // nullReplace custom field IDs- Replace
customfield_XXXXXwith your Sprint field ID. - Replace
customfield_YYYYYwith your Story Points field ID. - Replace
customfield_ZZZZZwith the field you use to assign teams (e.g. a custom "Team" field, or derive it from the assignee). Adjust the jq expression to match your Jira schema.
- Replace
-
Click
Save & Resync.
After the resync completes, each team entity will display its sprint health metrics automatically.
Set up scorecard
Before building the dashboard, we will create a scorecard on the _team blueprint to assign maturity levels based on sprint health metrics. Setting this up first lets us include scorecard results in the dashboard widgets.
The levels reflect increasing discipline in sprint planning and execution:
| Level | Criteria |
|---|---|
| Basic | Default level for all teams (no rules passed yet). |
| Bronze | Team has sprint data and completion rate > 60%. |
| Silver | Completion rate > 75% and scope change < 20%. |
| Gold | Completion rate > 90% and scope change < 10%. |
-
Go to your Builder page.
-
Search for the
Team(_team) blueprint and select it. -
Click on the Scorecards tab.
-
Click on
+ New Scorecard. -
Click on the
...button in the top right corner, and choose{...} Edit JSONand paste this JSON configuration:Sprint health scorecard (click to expand)
{"identifier": "sprintHealth","title": "Sprint Health","levels": [{"color": "paleBlue","title": "Basic"},{"color": "bronze","title": "Bronze"},{"color": "silver","title": "Silver"},{"color": "gold","title": "Gold"}],"rules": [{"identifier": "hasSprintData","title": "Has sprint data","description": "The team has at least one issue associated with an active sprint","level": "Bronze","query": {"combinator": "and","conditions": [{"property": "sprintIssuesTotal","operator": ">","value": 0}]}},{"identifier": "completionAbove60","title": "Completion rate above 60%","description": "At least 60% of sprint issues are completed","level": "Bronze","query": {"combinator": "and","conditions": [{"property": "sprintCompletionRate","operator": ">","value": 60}]}},{"identifier": "completionAbove75","title": "Completion rate above 75%","description": "At least 75% of sprint issues are completed","level": "Silver","query": {"combinator": "and","conditions": [{"property": "sprintCompletionRate","operator": ">","value": 75}]}},{"identifier": "scopeChangeBelow20","title": "Scope change below 20%","description": "Fewer than 20% of sprint issues were added after the sprint started","level": "Silver","query": {"combinator": "and","conditions": [{"property": "sprintScopeChangePercent","operator": "<","value": 20}]}},{"identifier": "completionAbove90","title": "Completion rate above 90%","description": "At least 90% of sprint issues are completed","level": "Gold","query": {"combinator": "and","conditions": [{"property": "sprintCompletionRate","operator": ">","value": 90}]}},{"identifier": "scopeChangeBelow10","title": "Scope change below 10%","description": "Fewer than 10% of sprint issues were added after the sprint started","level": "Gold","query": {"combinator": "and","conditions": [{"property": "sprintScopeChangePercent","operator": "<","value": 10}]}}]} -
Click
Save.
After the scorecard evaluates, each team entity will display its sprint health maturity level. Teams can view their level in the Scorecards tab on their entity page and track progress toward higher levels.
Visualize sprint metrics
With sprint metrics and scorecard levels in place, let's build a team-level dashboard that surfaces the three core sprint health indicators i.e. completion rate, scope change %, and carryover rate alongside scorecard maturity levels.
Create the dashboard
- Navigate to the Catalog page.
- Click on the
+button in the left sidebar. - Select New dashboard.
- Name the dashboard Sprint Health.
- Set the description to
Track sprint delivery metrics across teams. - Select the
Jiraicon. - Click
Create.
Add widgets
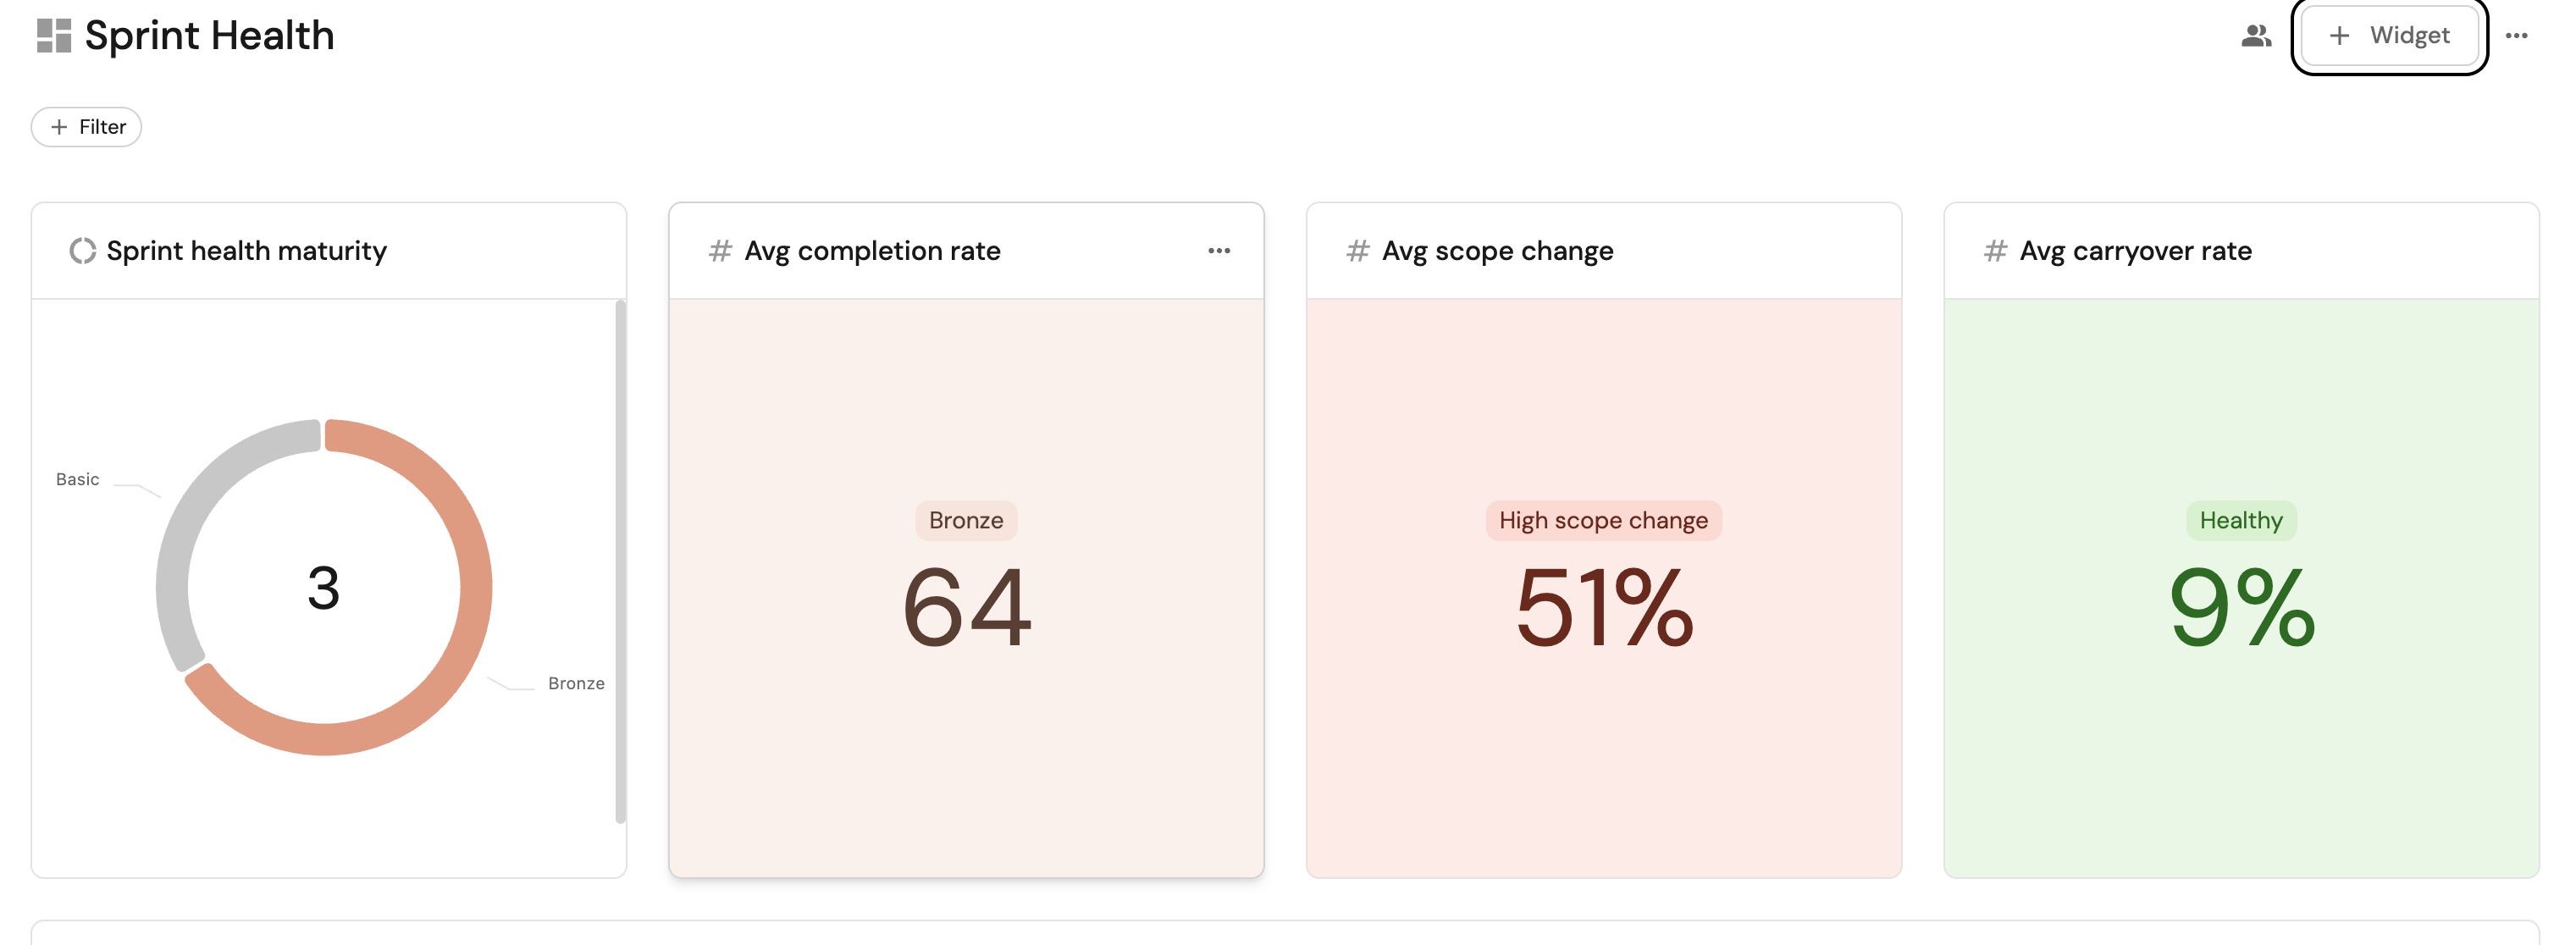
Add high-level summary widgets
These widgets give a high-level picture of where teams stand right now.
Scorecard maturity distribution (click to expand)
Shows how many teams are at each maturity level (Basic, Bronze, Silver, Gold).
- Click
+ Widgetand select Pie Chart. - Title:
Sprint health maturity. - Choose the Team (
_team) blueprint. - Under
Breakdown by property, select the Sprint Health scorecard level. - Click
Save.
Average completion rate (click to expand)
A single number showing the organization-wide average sprint completion rate, with color thresholds aligned to the scorecard levels.
- Click
+ Widgetand select Number Chart. - Title:
Avg completion rate. - Select
Aggregate by propertyas the chart type. - Choose the Team (
_team) blueprint. - Select
Sprint Completion Rate (%)for the Property. - Set the Function to
average. - Select
totalfor Average of. - Select
Roundfor Display formatting. - Select
customas the Unit and input%as the custom unit. - Add a condition: operator
>=, value90, colorgreen, messageGold. - Add a condition: operator
>=, value75, colorblue, messageSilver. - Add a condition: operator
>=, value60, colororange, messageBronze. - Add a condition: operator
<, value60, colorred, messageBelow target. - Click
Save.
Average scope change (click to expand)
A single number showing the organization-wide average mid-sprint scope change.
- Click
+ Widgetand select Number Chart. - Title:
Avg scope change. - Select
Aggregate by propertyas the chart type. - Choose the Team (
_team) blueprint. - Select
Sprint Scope Change (%)for the Property. - Set the Function to
average. - Select
totalfor Average of. - Select
Roundfor Display formatting. - Select
customas the Unit and input%as the custom unit. - Add a condition: operator
<, value10, colorgreen, messageGold. - Add a condition: operator
<, value20, colorblue, messageSilver. - Add a condition: operator
>=, value20, colorred, messageHigh scope change. - Click
Save.
Average carryover rate (click to expand)
A single number showing how much unfinished work is carried between sprints.
- Click
+ Widgetand select Number Chart. - Title:
Avg carryover rate. - Select
Aggregate by propertyas the chart type. - Choose the Team (
_team) blueprint. - Select
Sprint Carryover Rate (%)for the Property. - Set the Function to
average. - Select
totalfor Average of. - Select
Roundfor Display formatting. - Select
customas the Unit and input%as the custom unit. - Add a condition: operator
<=, value10, colorgreen, messageHealthy. - Add a condition: operator
>, value20, colorred, messageHigh carryover. - Click
Save.
Add per-sprint trend widgets
These line charts track how each metric evolves over time, making it easy to spot regressions or improvements sprint over sprint.
Completion rate trend (click to expand)
Tracks the completion rate for all teams over successive sprints.
- Click
+ Widgetand select Line Chart. - Title:
Completion rate trend. - Set X axis:
- Title:
Sprint. - Time interval:
Week(or match your sprint cadence). - Time range:
Last 180 days.
- Title:
- Set Y axis title:
Completion rate (%). - Click + Line and configure:
- Title:
Completion Rate. - Chart type:
Aggregate by property. - Blueprint:
Team(_team). - Function:
Average. - Measure time by:
$updatedAt.
- Title:
- Click
Save.
Scope change trend (click to expand)
Shows how mid-sprint scope change evolves across all teams over time.
- Click
+ Widgetand select Line Chart. - Title:
Scope change trend. - Set X axis:
- Title:
Time. - Time interval:
Week. - Time range:
Last 3 months.
- Title:
- Set Y axis title:
Scope change (%). - Click + Line and configure:
- Title:
Scope Change. - Chart type:
Aggregate by property. - Blueprint:
Team(_team). - Property:
Sprint Scope Change (%). - Function:
Average. - Measure time by:
$updatedAt.
- Title:
- Click
Save.
Carryover rate trend (click to expand)
Shows whether carryover is improving or worsening across teams over time.
- Click
+ Widgetand select Line Chart. - Title:
Carryover rate trend. - Set X axis:
- Title:
Time. - Time interval:
Week. - Time range:
Last 3 months.
- Title:
- Set Y axis title:
Carryover rate (%). - Click + Line and configure:
- Title:
Carryover Rate. - Chart type:
Aggregate by property. - Blueprint:
Team(_team). - Property:
Sprint Carryover Rate (%). - Function:
Average. - Measure time by:
$updatedAt.
- Title:
- Click
Save.
Add team comparison widgets
These widgets let you compare teams side by side and drill into the active sprint.
Sprint issues by status (click to expand)
A breakdown of all active sprint issues by their current status, showing how much work is done, in progress, or not yet started.
- Click
+ Widgetand select Pie Chart. - Title:
Sprint issue status. - Choose the Jira Issue blueprint.
- Under
Breakdown by property, select Status. - Add this filter to scope to the active sprint:
[{"combinator": "and","rules": [{"property": "sprintState","operator": "=","value": "active"}]}]
- Click
Save.
Team sprint health table (click to expand)
A comparison table showing every team's scorecard level and all three sprint health metrics in one view.
- Click
+ Widgetand select Table. - Title:
Team sprint health. - Choose the Team (
_team) blueprint. - Click
Save, then click the...button on the widget and select Customize table. - Click
Manage Propertiesand add:- Sprint Health (scorecard level).
- Sprint Completion Rate (%).
- Sprint Scope Change (%).
- Sprint Carryover Rate (%).
- Sprint Issues (Total).
- Sprint Issues (Done).
- Sprint Story Points (Total).
- Sprint Story Points (Done).
- Click the save icon to persist the table layout.
Next steps
- Set up automations: Use Port automations to send Slack notifications when a team's sprint health drops below a threshold.
- Compare across teams: Use the dashboard table widget with sorting and grouping to benchmark teams against each other.
- Track story points alongside issue counts: Use the story point aggregation properties already configured to create a parallel set of story-point-based completion metrics for teams that estimate with points.