Measure delivery reliability and stability
Measuring delivery reliability and stability provides visibility into how consistently software changes move from commit to production, and where breakdowns disrupt engineering flow. By making failures, delays, and recovery patterns observable, teams can distinguish isolated issues from systemic instability that affects delivery outcomes.
Without this visibility, workflow failures and CI/CD friction are treated as one-off incidents rather than recurring signals, making it difficult to prioritize improvements, reduce delivery risk, and sustain predictable throughput as the organization scales.
This guide helps engineering managers, platform engineers, and product leaders answer questions such as:
- Workflow failures: How often do CI/CD workflows fail, and where do failures concentrate?
- Bottlenecks: Which workflows or services have the highest failure rates?
- Impact on delivery: How frequently do failing workflows block pull requests and slow down delivery?
By the end of this guide, you'll have a working dashboard that tracks key reliability and stability metrics, enabling you to identify unstable workflows, measure the impact of failures on delivery, and prioritize improvements to your CI/CD infrastructure.
This guide includes configuration for a Reliability Agent that provides AI-powered insights into your system reliability and resilience. Ask natural language questions like "What needs attention right now?" or "What are the top 3 actions we should take to improve MTTR?" and receive data-driven recommendations that connect delivery behavior to production outcomes.
Common use cases
- Track workflow failure rates to identify unstable CI/CD pipelines.
- Monitor PRs blocked by failing CI/CD to understand delivery bottlenecks.
- Identify services and workflows with the highest failure rates.
- Understand where instability concentrates across services and teams.
Prerequisites
This guide assumes the following:
- You have a Port account and have completed the onboarding process.
- One of the following integrations is installed in your account:
- GitHub
- Azure DevOps
- Port's GitHub integration or Port's GitHub Ocean integration is installed in your account.
- Port's Azure DevOps integration is installed in your account.
This guide focuses on measuring reliability and stability using source control management (SCM) data, including repositories, pull requests, and workflows. This guide supports GitHub and Azure DevOps, with GitLab support coming soon. This is the first iteration of reliability and stability measurement and will expand in future versions to include additional metrics and data sources such as monitoring tools, and other operational signals.
Key metrics overview
We will track three key metrics to measure reliability and stability:
| Metric | What it measures | Why it matters |
|---|---|---|
| Workflow failure rate | How often CI/CD workflows fail and where failures occur | Identifies unstable workflows and services that need attention, helping prioritize infrastructure improvements |
| PRs blocked by failing CI/CD | Number of pull requests blocked by failed workflow runs | Shows the direct impact of CI/CD failures on delivery velocity and helps quantify the cost of instability |
| CI/CD failure concentration | Distribution of CI/CD failures across workflows, services, or repos | Helps to identify recurring failure patterns and prioritise the most important issues to fix |
Set up data model
We will create blueprints to model your workflow data. The githubPullRequest and githubRepository blueprints should already exist from the GitHub integration installation, or the azureDevopsPullRequest and azureDevopsRepository blueprints should already exist from the Azure DevOps integration installation.
- GitHub
- Azure DevOps
Create the GitHub workflow blueprint
-
Go to the Builder page of your portal.
-
Click on
+ Blueprint. -
Click on the
{...}button in the top right corner, and chooseEdit JSON. -
Add this JSON schema:
GitHub workflow blueprint (click to expand)
{"identifier": "githubWorkflow","title": "Workflow","icon": "Github","schema": {"properties": {"path": {"title": "Path","type": "string"},"status": {"title": "Status","type": "string","enum": ["active","deleted","disabled_fork","disabled_inactivity","disabled_manually"],"enumColors": {"active": "green","deleted": "red"}},"createdAt": {"title": "Created At","type": "string","format": "date-time"},"updatedAt": {"title": "Updated At","type": "string","format": "date-time"},"deletedAt": {"title": "Deleted At","type": "string","format": "date-time"},"link": {"title": "Link","type": "string","format": "url"}},"required": []},"mirrorProperties": {},"calculationProperties": {},"aggregationProperties": {},"relations": {"repository": {"title": "Repository","target": "githubRepository","required": false,"many": false}}} -
Click
Saveto create the blueprint.
Create the GitHub workflow run blueprint
-
Go to the Builder page of your portal.
-
Click on
+ Blueprint. -
Click on the
{...}button in the top right corner, and chooseEdit JSON. -
Add this JSON schema:
GitHub workflow run blueprint (click to expand)
{"identifier": "githubWorkflowRun","title": "Workflow Run","icon": "Github","schema": {"properties": {"name": {"title": "Name","type": "string"},"triggeringActor": {"title": "Triggering Actor","type": "string"},"status": {"title": "Status","type": "string","enum": ["completed","action_required","cancelled","startup_failure","failure","neutral","skipped","stale","success","timed_out","in_progress","queued","requested","waiting"],"enumColors": {"queued": "yellow","in_progress": "yellow","success": "green","failure": "red"}},"conclusion": {"title": "Conclusion","type": "string","enum": ["completed","action_required","cancelled","startup_failure","failure","neutral","skipped","stale","success","timed_out","in_progress","queued","requested","waiting"],"enumColors": {"queued": "yellow","in_progress": "yellow","success": "green","failure": "red"}},"createdAt": {"title": "Created At","type": "string","format": "date-time"},"runStartedAt": {"title": "Run Started At","type": "string","format": "date-time"},"updatedAt": {"title": "Updated At","type": "string","format": "date-time"},"runNumber": {"title": "Run Number","type": "number"},"runAttempt": {"title": "Run Attempts","type": "number"},"link": {"title": "Link","type": "string","format": "url"},"headBranch": {"title": "Head Branch","description": "The branch that triggered the workflow run","type": "string"}},"required": []},"mirrorProperties": {"repository": {"title": "Repository","path": "workflow.repository.$title"}},"calculationProperties": {},"aggregationProperties": {},"relations": {"pullRequests": {"title": "Pull Requests","target": "githubPullRequest","required": false,"many": true},"workflow": {"target": "githubWorkflow","required": true,"many": false}}} -
Click
Saveto create the blueprint.
Create the workflow state blueprint
-
Go to the Builder page of your portal.
-
Click on
+ Blueprint. -
Click on the
{...}button in the top right corner, and chooseEdit JSON. -
Add this JSON schema:
Workflow state blueprint (click to expand)
{"identifier": "workflow_state","description": "Tracks the current status of the last triggered workflow","title": "Workflow State","icon": "Pipeline","schema": {"properties": {"status": {"type": "string","title": "Status"},"result": {"type": "string","title": "Result"},"last_triggered_at": {"type": "string","title": "Last Triggered At","format": "date-time"},"scim": {"type": "string","title": "SCIM","description": "Source of the workflow such as GitHub, Azure Devops, GitLab"},"link": {"type": "string","title": "Link","format": "url"}},"required": []},"mirrorProperties": {},"calculationProperties": {},"aggregationProperties": {},"relations": {}} -
Click
Saveto create the blueprint.
Create the Azure DevOps project blueprint
-
Go to the Builder page of your portal.
-
Click on
+ Blueprint. -
Click on the
{...}button in the top right corner, and chooseEdit JSON. -
Add this JSON schema:
Azure DevOps project blueprint (click to expand)
{"identifier": "azureDevopsProject","title": "Project","icon": "AzureDevops","schema": {"properties": {"state": {"title": "State","type": "string","icon": "AzureDevops","description": "The current lifecycle state of the project."},"revision": {"title": "Revision","type": "string","icon": "AzureDevops","description": "The revision number, indicating how many times the project configuration has been updated."},"visibility": {"title": "Visibility","type": "string","icon": "AzureDevops","description": "Indicates whether the project is private or public"},"defaultTeam": {"title": "Default Team","type": "string","icon": "Team","description": "Default Team of the project"},"link": {"title": "Link","type": "string","format": "url","icon": "AzureDevops","description": "Link to azure devops project"}},"required": []},"mirrorProperties": {},"calculationProperties": {},"aggregationProperties": {},"relations": {}} -
Click
Saveto create the blueprint.
Create the Azure DevOps repository blueprint
-
Go to the Builder page of your portal.
-
Click on
+ Blueprint. -
Click on the
{...}button in the top right corner, and chooseEdit JSON. -
Add this JSON schema:
Azure DevOps repository blueprint (click to expand)
{"identifier": "azureDevopsRepository","title": "Repository","icon": "AzureDevops","ownership": {"type": "Direct"},"schema": {"properties": {"url": {"title": "URL","format": "url","type": "string","icon": "Link"},"readme": {"title": "README","type": "string","format": "markdown","icon": "Book"},"id": {"type": "string","title": "ID"},"last_activity": {"type": "string","title": "Last Activity","format": "date-time"},"minimumApproverCount": {"type": "number","title": "Minimum Approver Count"},"workItemLinking": {"title": "Work Item Linking","type": "boolean","default": false},"repository_policy_enabled": {"type": "boolean","title": "Repository Policy Enabled"},"visibility": {"type": "string","title": "Visibility"}},"required": []},"mirrorProperties": {},"calculationProperties": {},"aggregationProperties": {"total_pipeline": {"title": "Total Pipeline","type": "number","target": "azureDevopsBuild","calculationSpec": {"func": "count","calculationBy": "entities"}},"has_pr_template": {"title": "Has PR Template","type": "number","target": "pr_template","calculationSpec": {"func": "count","calculationBy": "entities"}}},"relations": {"project": {"title": "Project","target": "azureDevopsProject","required": true,"many": false}}} -
Click
Saveto create the blueprint.
Create the Azure DevOps build blueprint
-
Go to the Builder page of your portal.
-
Click on
+ Blueprint. -
Click on the
{...}button in the top right corner, and chooseEdit JSON. -
Add this JSON schema:
Azure DevOps build blueprint (click to expand)
{"identifier": "azureDevopsBuild","title": "Azure Devops Build","icon": "AzureDevops","schema": {"properties": {"status": {"type": "string","title": "Status"},"result": {"type": "string","title": "Result"},"queueTime": {"type": "string","format": "date-time","title": "Queue Time"},"startTime": {"type": "string","format": "date-time","title": "Start Time"},"finishTime": {"type": "string","format": "date-time","title": "Finish Time"},"definitionName": {"type": "string","title": "Definition Name"},"requestedFor": {"type": "string","title": "Requested For"},"link": {"type": "string","format": "url","title": "Link"},"reason": {"type": "string","title": "Reason"}},"required": []},"mirrorProperties": {"repository": {"title": "Repository","path": "repository.$title"}},"calculationProperties": {},"aggregationProperties": {},"relations": {"project": {"title": "Project","target": "azureDevopsProject","required": true,"many": false},"repository": {"title": "Repository","target": "azureDevopsRepository","required": false,"many": false},"pull_request": {"title": "Pull Request","target": "azureDevopsPullRequest","required": false,"many": true}}} -
Click
Saveto create the blueprint.
Create the workflow state blueprint
-
Go to the Builder page of your portal.
-
Click on
+ Blueprint. -
Click on the
{...}button in the top right corner, and chooseEdit JSON. -
Add this JSON schema:
Workflow state blueprint (click to expand)
{"identifier": "workflow_state","description": "Tracks the current status of the last triggered workflow","title": "Workflow State","icon": "Pipeline","schema": {"properties": {"status": {"type": "string","title": "Status"},"result": {"type": "string","title": "Result"},"last_triggered_at": {"type": "string","title": "Last Triggered At","format": "date-time"},"scim": {"type": "string","title": "SCIM","description": "Source of the workflow such as GitHub, Azure Devops, GitLab"},"link": {"type": "string","title": "Link","format": "url"}},"required": []},"mirrorProperties": {},"calculationProperties": {},"aggregationProperties": {},"relations": {}} -
Click
Saveto create the blueprint.
Update integration mapping
- GitHub
- Azure DevOps
Now we'll configure the GitHub integration to ingest workflow and workflow run data into your catalog. If you already have existing mappings for repositories and pull requests, make sure to include the workflow and workflow-run kinds.
For the workflow run to pull request relation to work correctly, ensure your githubPullRequest blueprint has a branch property. If it doesn't exist, add it to the blueprint schema as a string property. The mapping below includes the branch property in the pull request mapping.
- Go to your Data Source page.
- Select the GitHub integration.
- Add or update the following YAML block in the editor to ingest data from GitHub:
- GitHub (Ocean)
- GitHub (Sunset)
GitHub Ocean integration configuration (click to expand)
resources:
  - kind: repository
    selector:
      query: 'true'
      teams: true
    port:
      entity:
        mappings:
          identifier: .full_name
          title: .name
          blueprint: '"githubRepository"'
          properties:
            readme: file://README.md
            url: .html_url
            defaultBranch: .default_branch
            last_push: .pushed_at
  - kind: pull-request
    selector:
      query: 'true'
      closedPullRequests: false
    port:
      entity:
        mappings:
          identifier: .id|tostring
          title: .title
          blueprint: '"githubPullRequest"'
          properties:
            status: .state
            closedAt: .closed_at
            updatedAt: .updated_at
            mergedAt: .merged_at
            createdAt: .created_at
            link: .html_url
            branch: .head.ref
            leadTimeHours: >-
              (.created_at as $createdAt | .merged_at as $mergedAt | ($createdAt
              | sub("\\..*Z$"; "Z") | strptime("%Y-%m-%dT%H:%M:%SZ") | mktime)
              as $createdTimestamp | ($mergedAt | if . == null then null else
              sub("\\..*Z$"; "Z") | strptime("%Y-%m-%dT%H:%M:%SZ") | mktime end)
              as $mergedTimestamp | if $mergedTimestamp == null then null else
              (((($mergedTimestamp - $createdTimestamp) / 3600) * 100 | floor) /
              100) end)
            pr_age: >-
              ((now - (.created_at | sub("\\.[0-9]+Z$"; "Z") | fromdateiso8601))
              / 86400) | round
            pr_age_label: >-
              ((now - (.created_at | sub("\\.[0-9]+Z$"; "Z") | fromdateiso8601))
              / 86400 | round) as $age | if $age <= 3 then "0-3 days" elif $age
              <= 7 then "3-7 days" else ">7 days" end
            cycle_time: >-
              if .merged_at then (((.merged_at   | sub("\\.[0-9]+Z$"; "Z") |
              fromdateiso8601) - (.created_at | sub("\\.[0-9]+Z$"; "Z") |
              fromdateiso8601)) / 86400 | round) else null end
          relations:
            repository: .__repository
  - kind: workflow
    selector:
      query: 'true'
    port:
      entity:
        mappings:
          identifier: .__repository + (.id|tostring)
          title: .name
          blueprint: '"githubWorkflow"'
          properties:
            path: .path
            status: .state
            createdAt: .created_at
            updatedAt: .updated_at
            link: .html_url
          relations:
            repository: .__repository
  - kind: workflow-run
    selector:
      query: 'true'
    port:
      entity:
        mappings:
          identifier: .__repository + (.id|tostring)
          title: .display_title
          blueprint: '"githubWorkflowRun"'
          properties:
            name: .name
            triggeringActor: .triggering_actor.login
            status: .status
            conclusion: .conclusion
            createdAt: .created_at
            runStartedAt: .run_started_at
            updatedAt: .updated_at
            runNumber: .run_number
            runAttempt: .run_attempt
            link: .html_url
            headBranch: .head_branch
          relations:
            workflow: .__repository + (.workflow_id|tostring)
            pullRequests: if (.pull_requests | length) > 0 then (.pull_requests | map(.id)) else null end
  - kind: workflow-run
    selector:
      query: 'true'
    port:
      entity:
        mappings:
          identifier: .__repository + (.workflow_id|tostring)
          title: .__repository + (.workflow_id|tostring)
          blueprint: '"workflow_state"'
          properties:
            status: .status
            result: .conclusion
            last_triggered_at: .run_started_at
            scim: '"GitHub"'
            link: .html_url
For GitHub Ocean, use .__repository for the repository relation. See the GitHub Ocean migration guide for details.
GitHub integration configuration (click to expand)
resources:
  - kind: repository
    selector:
      query: 'true'
      teams: true
    port:
      entity:
        mappings:
          identifier: .full_name
          title: .name
          blueprint: '"githubRepository"'
          properties:
            readme: file://README.md
            url: .html_url
            defaultBranch: .default_branch
            last_push: .pushed_at
  - kind: pull-request
    selector:
      query: 'true'
      closedPullRequests: false
    port:
      entity:
        mappings:
          identifier: .id|tostring
          title: .title
          blueprint: '"githubPullRequest"'
          properties:
            status: .status
            closedAt: .closed_at
            updatedAt: .updated_at
            mergedAt: .merged_at
            createdAt: .created_at
            link: .html_url
            branch: .head.ref
            leadTimeHours: >-
              (.created_at as $createdAt | .merged_at as $mergedAt | ($createdAt
              | sub("\\..*Z$"; "Z") | strptime("%Y-%m-%dT%H:%M:%SZ") | mktime)
              as $createdTimestamp | ($mergedAt | if . == null then null else
              sub("\\..*Z$"; "Z") | strptime("%Y-%m-%dT%H:%M:%SZ") | mktime end)
              as $mergedTimestamp | if $mergedTimestamp == null then null else
              (((($mergedTimestamp - $createdTimestamp) / 3600) * 100 | floor) /
              100) end)
            pr_age: >-
              ((now - (.created_at | sub("\\.[0-9]+Z$"; "Z") | fromdateiso8601))
              / 86400) | round
            pr_age_label: >-
              ((now - (.created_at | sub("\\.[0-9]+Z$"; "Z") | fromdateiso8601))
              / 86400 | round) as $age | if $age <= 3 then "0-3 days" elif $age
              <= 7 then "3-7 days" else ">7 days" end
            cycle_time: >-
              if .merged_at then (((.merged_at   | sub("\\.[0-9]+Z$"; "Z") |
              fromdateiso8601) - (.created_at | sub("\\.[0-9]+Z$"; "Z") |
              fromdateiso8601)) / 86400 | round) else null end
          relations:
            repository: .head.repo.full_name
  - kind: workflow
    selector:
      query: 'true'
    port:
      entity:
        mappings:
          identifier: >-
            (.url | capture("repos/(?<repo>[^/]+/[^/]+)/") | .repo) +
            (.id|tostring)
          title: .name
          blueprint: '"githubWorkflow"'
          properties:
            path: .path
            status: .state
            createdAt: .created_at
            updatedAt: .updated_at
            link: .html_url
          relations:
            repository: (.url | capture("repos/(?<repo>[^/]+/[^/]+)/") | .repo)
  - kind: workflow-run
    selector:
      query: 'true'
    port:
      entity:
        mappings:
          identifier: .repository.full_name + (.id|tostring)
          title: .display_title
          blueprint: '"githubWorkflowRun"'
          properties:
            name: .name
            triggeringActor: .triggering_actor.login
            status: .status
            conclusion: .conclusion
            createdAt: .created_at
            runStartedAt: .run_started_at
            updatedAt: .updated_at
            runNumber: .run_number
            runAttempt: .run_attempt
            link: .html_url
            headBranch: .head_branch
          relations:
            workflow: .repository.full_name + (.workflow_id|tostring)
            pullRequests: if (.pull_requests | length) > 0 then (.pull_requests | map(.id)) else null end
  - kind: workflow-run
    selector:
      query: 'true'
    port:
      entity:
        mappings:
          identifier: .repository.full_name + (.workflow_id|tostring)
          title: .repository.full_name + (.workflow_id|tostring)
          blueprint: '"workflow_state"'
          properties:
            status: .status
            result: .conclusion
            last_triggered_at: .run_started_at
            scim: '"GitHub"'
            link: .html_url
If you already have mappings for repositories and pull requests, make sure to add the workflow and workflow-run kinds to your existing configuration. The mapping above includes all required kinds for this guide.
- Click
Save & Resyncto apply the mapping.
Now we'll configure the Azure DevOps integration to ingest build and deployment data into your catalog. If you already have existing mappings for repositories and pull requests, make sure to include the build kind.
-
Go to your Data Source page.
-
Select the Azure DevOps integration.
-
Add the following YAML blocks to your existing mapping configuration:
Azure DevOps integration configuration additions (click to expand)
resources:- kind: projectselector:query: 'true'defaultTeam: 'true'port:entity:mappings:identifier: .id | gsub(" "; "")blueprint: '"azureDevopsProject"'title: .nameproperties:state: .staterevision: .revisionvisibility: .visibilitydefaultTeam: .defaultTeam.namelink: .url | gsub("_apis/projects/"; "")- kind: repositoryselector:query: 'true'port:entity:mappings:identifier: .idtitle: .nameblueprint: '"azureDevopsRepository"'properties:url: .remoteUrlreadme: file://README.mdid: .idlast_activity: .project.lastUpdateTimerelations:project: .project.id | gsub(" "; "")- kind: repository-policyselector:query: .type.displayName=="Minimum number of reviewers"port:entity:mappings:identifier: .__repository.idblueprint: '"azureDevopsRepository"'properties:minimumApproverCount: .settings.minimumApproverCountrepository_policy_enabled: .isEnabled- kind: repository-policyselector:query: .type.displayName=="Work item linking"port:entity:mappings:identifier: .__repository.idblueprint: '"azureDevopsRepository"'properties:workItemLinking: .isEnabled and .isBlocking- kind: userselector:query: 'true'port:entity:mappings:identifier: .idtitle: .user.displayNameblueprint: '"azureDevopsUser"'properties:url: .user.urlemail: .user.mailAddress- kind: pull-requestselector:query: 'true'port:entity:mappings:identifier: .repository.id + "/" + (.pullRequestId | tostring)title: .titleblueprint: '"azureDevopsPullRequest"'properties:status: .statuscreatedAt: .creationDateclosedDate: .closedDatedescription: .descriptionsource_branch: .sourceRefNamesource_commit_sha: .lastMergeSourceCommit.commitIdleadTimeHours: >-(.creationDate as $createdAt | .status as $status | .closedDate as$closedAt | ($createdAt | sub("\\..*Z$"; "Z") |strptime("%Y-%m-%dT%H:%M:%SZ") | mktime) as $createdTimestamp |($closedAt | if . == null then null else sub("\\..*Z$"; "Z") |strptime("%Y-%m-%dT%H:%M:%SZ") | mktime end) as $closedTimestamp |if $status == "completed" and $closedTimestamp != null then(((($closedTimestamp - $createdTimestamp) / 3600) * 100 | floor) /100) else null end)link: .urlpr_age_label: >-((now - (.creationDate | sub("\\.[0-9]+Z$"; "Z") |fromdateiso8601)) / 86400 | round) as $age | if $age <= 3 then"0-3 days" elif $age <= 7 then "3-7 days" else ">7 days" endcycle_time: >-if .closedDate then (((.closedDate | sub("\\.[0-9]+Z$"; "Z") |fromdateiso8601) - (.creationDate | sub("\\.[0-9]+Z$"; "Z") |fromdateiso8601)) / 86400 | round) else null endrelations:repository: .repository.idservice:combinator: '"and"'rules:- operator: '"="'property: '"ado_repository_id"'value: .repository.idcreator:combinator: '"and"'rules:- operator: '"="'property: '"$identifier"'value: .createdBy.idreviewers:combinator: '"and"'rules:- operator: '"in"'property: '"$identifier"'value: '[.reviewers[].id]'azure_devops_reviewers: '[.reviewers[].id]'azure_devops_creator: .createdBy.id- kind: buildselector:query: 'true'port:entity:mappings:identifier: .__project.id + "/" + (.id | tostring) | gsub(" "; "")title: .buildNumberblueprint: '"azureDevopsBuild"'properties:status: .statusresult: .resultqueueTime: .queueTimestartTime: .startTimefinishTime: .finishTimereason: .reasondefinitionName: .definition.namerequestedFor: .requestedFor.displayNamelink: ._links.web.hrefrelations:project: .__project.id | gsub(" "; "")repository: .repository.idpull_request:combinator: '"and"'rules:- operator: '"="'property: '"source_commit_sha"'value: .sourceVersion- kind: buildselector:query: 'true'port:entity:mappings:identifier: .repository.name + "/" + (.definition.id | tostring) | gsub(" "; "")title: .repository.name + "/" + (.definition.id | tostring) | gsub(" "; "")blueprint: '"workflow_state"'properties:status: .statusresult: .resultlast_triggered_at: .startTimescim: '"Azure Devops"'link: .definition.urlExisting mappingsIf you already have mappings for repositories and pull requests, make sure to add the
buildkind to your existing configuration. The mapping above includes all required kinds for this guide. -
Click
Save & Resyncto apply the mapping.
Configure AI agent
To help Platform Engineering teams understand, assess, and improve the reliability and resilience of software systems using operational and delivery signals stored in Port's Context Lake, we'll configure an AI agent that provides objective insights and prioritized, actionable recommendations.
-
Go to the AI Agents page of your portal.
-
Click on
+ AI Agent. -
Toggle
Json modeon. -
Copy and paste the following JSON configuration:
Reliability Agent configuration (click to expand)
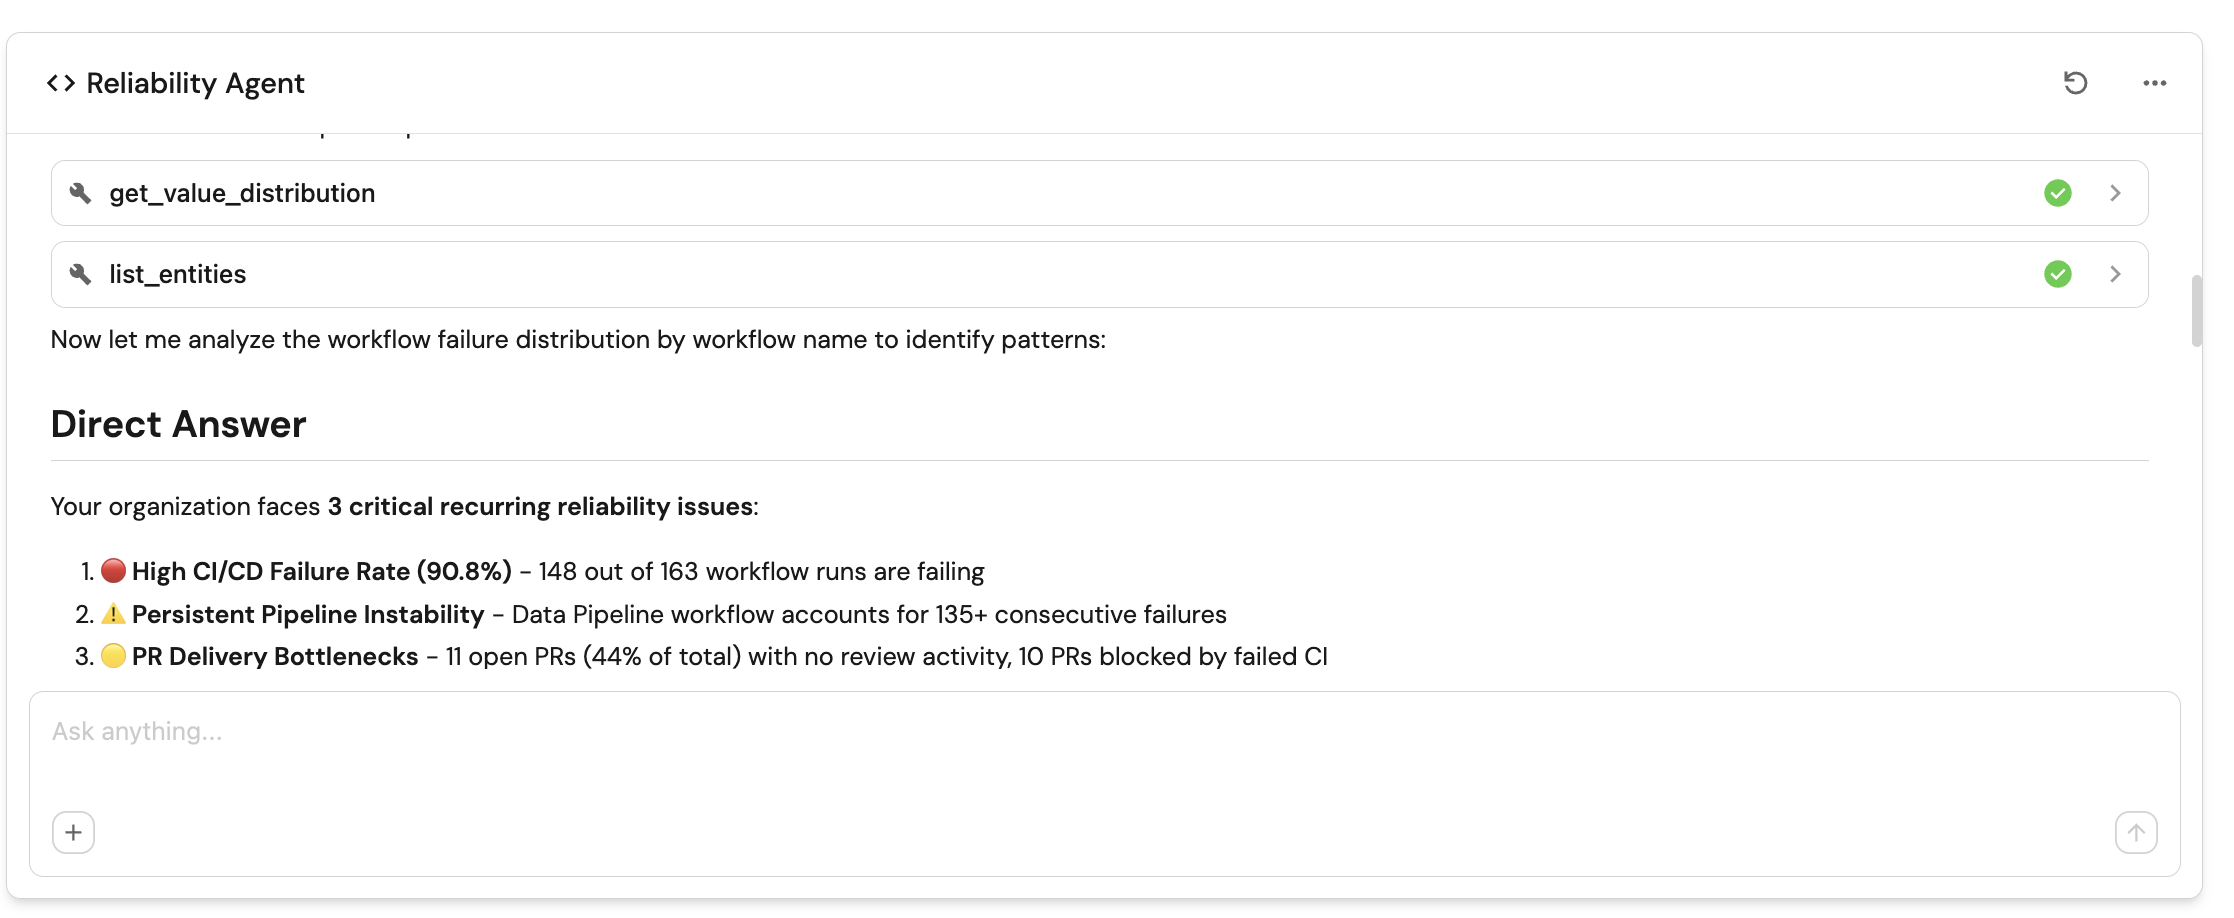
{"identifier": "reliability_agent","title": "Reliability Agent","icon": "Details","team": [],"properties": {"description": "AI agent to provide insights about workflow reliability","status": "active","tools": ["^(list|search|track|describe)_.*"],"prompt": "You are the Reliability Insights Agent.\n\nYour purpose is to help Platform Engineering understand, assess, and improve the reliability and resilience of software systems using operational and delivery signals stored in Port's Context Lake. You provide objective insights and prioritised, actionable recommendations that reduce risk, improve stability, and increase confidence in production systems.\n\nAvailable Data\n\nUse any relevant blueprints and properties available in the Context Lake (for example: Services, Repositories, Deployments, Workflow Runs, Incidents, Alerts, Environments, SLOs, Error Rates, and future reliability signals).\nDo not assume a fixed schema. Use only available data.\n\nYour Task\n\nInterpret the user's question and determine scope (service, domain, environment, or organisation).\n\nAnalyse reliability signals such as:\n\nDeployment success and rollback rates\n\nChange failure rate and incident correlation\n\nMTTR, incident frequency, and recovery patterns\n\nCI/CD reliability, flaky workflows, and failed checks\n\nError trends, availability, and SLO/SLA adherence\n\nSurface risk patterns, regressions, and systemic weaknesses.\n\nWhen improvement opportunities exist, include recommendations in a structured table.\n\nHow to Think\n\nBe data-driven and risk-aware.\n\nPrefer systemic patterns over one-off incidents.\n\nConnect delivery behaviour to production outcomes.\n\nAvoid speculation; rely only on available signals.\n\nIf the question is unclear, ask one targeted follow-up.\n\nOutput Format\n\nDirect Answer\nShort, factual response focused on reliability or risk.\n\nSupporting Insights\nKey patterns, trends, or correlations explaining the reliability posture.\n\nRecommendations (Table)\nInclude when relevant:\n\nRecommendation\tPriority\tExpected Impact\tImplementation Complexity\tRelated Entities\nActionable reliability improvement\tHigh / Medium / Low\tReduced failures, faster recovery, higher stability\tLow / Medium / High\tURLs to relevant entities if available (otherwise N/A)\n\nRelevant Port Guides (Optional)\nWhen applicable, reference Port guides that help implement the recommendation (for example: scorecards, reliability dashboards, automation, or guardrails).\nInclude only guides that are directly actionable; omit if none apply.\n\nBe concise, accurate, and aligned with Engineering Intelligence principles: reliability, risk visibility, platform guardrails, and actionable clarity.","execution_mode": "Approval Required","conversation_starters": ["What needs attention right now?","What are the top 3 actions we should take to improve MTTR?","What are the top recurring reliability issues?","What single improvement will give us the biggest reliability gain?"]},"relations": {}} -
Click on
Createto save the agent.
The AI agent uses MCP (Model Context Protocol) enhanced capabilities to automatically discover important and relevant blueprint entities via its tools. The ^(list|search|track|describe)_.* pattern is the standard data-access pattern in the tools list (used directly when working in Advanced mode (regex)), and allows the agent to access and analyze related entities in your software catalog for richer contextual understanding.
Visualize metrics
Once the data is synced, we can create a dedicated dashboard in Port to monitor and analyze reliability and stability metrics using customizable widgets.
Create a dashboard
- Navigate to your software catalog.
- Click on the
+button in the left sidebar. - Select New dashboard.
- Name the dashboard Reliability.
- Click
Create.
We now have a blank dashboard where we can start adding widgets to visualize reliability and stability metrics.
Add widgets
- GitHub
- Azure DevOps
In the new dashboard, create the following widgets: Click Title: Description: Select Select Add this JSON to the Dataset filter editor: Select Click Click Title: Description: Set X axis: Set Y axis title: Click + Line and configure: Title: Chart type: Blueprint: Function: Measure time by: Add this JSON to the Additional filters editor: Click Click Title: Description: Choose the Workflow Run blueprint. Under Add this JSON to the Additional filters editor: Click Click Title: Description: Choose the Workflow Run blueprint. Under Add this JSON to the Additional filters editor: Click Click Title: Select Select Add this JSON to the Dataset filter editor: Select Click Click Title the widget Workflow States. Choose the Workflow State blueprint. Add this JSON to the Initial filters editor: Click Click on the In the top right corner of the table, click on Click on the save icon in the top right corner of the widget to save the customized table.Reliability Agent (click to expand)
+ Widget and select AI Agent.Reliability Agent.Workflow failure rate (last 7 days) (click to expand)
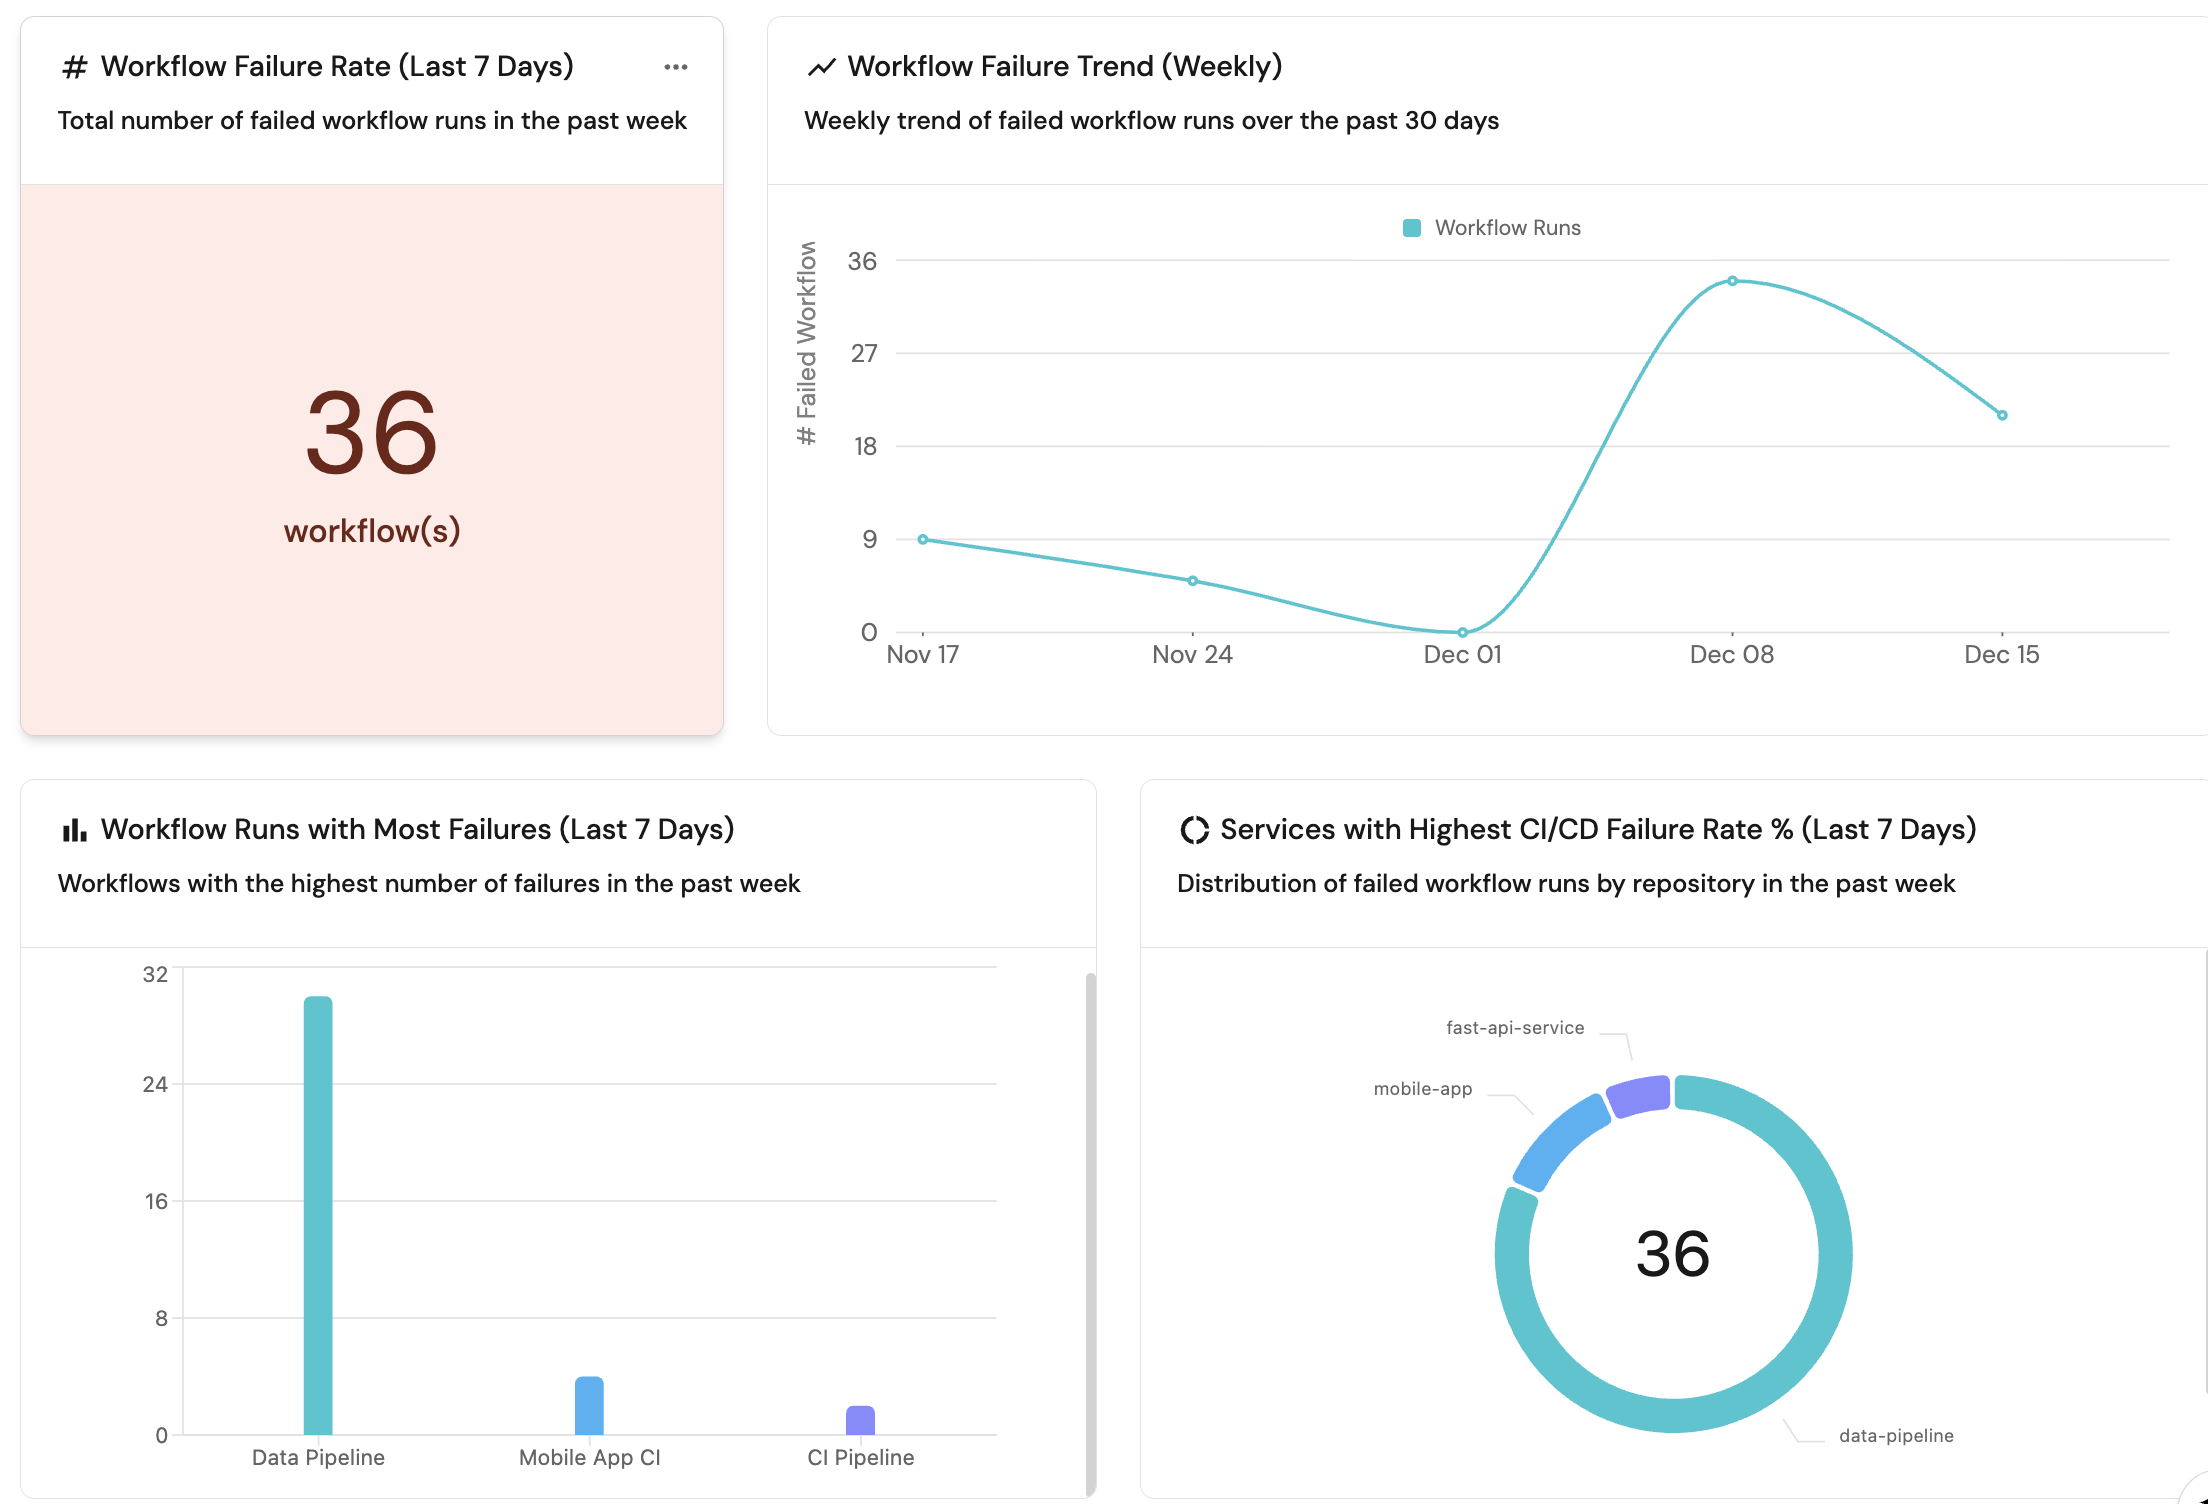
+ Widget and select Number Chart.Workflow Failure Rate (Last 7 Days).Total number of failed workflow runs in the past week.Count entities Chart type and choose Workflow Run as the Blueprint.count for the Function.custom as the Unit and input workflow(s) as the Custom unit.Save.Workflow failure trend (weekly) (click to expand)
+ Widget and select Line Chart.Workflow Failure Trend (Weekly).Weekly trend of failed workflow runs over the past 30 days.
Date.Week.In the past 30 days.# Failed Workflows.
Failed workflows.Count entities.Workflow Run.Count.runStartedAt.Save.Workflow runs with most failures (last 7 days) (click to expand)
+ Widget and select Bar Chart.Workflow Runs with Most Failures (Last 7 Days).Workflows with the highest number of failures in the past week.Breakdown by property, select the Name property.Save.Services with highest CI/CD failure rate % (last 7 days) (click to expand)
+ Widget and select Pie chart.Services with Highest CI/CD Failure Rate % (Last 7 Days).Distribution of failed workflow runs by repository in the past week.Breakdown by property, select the Repository property (this is a mirror property from the workflow relation).Save.Number of PRs blocked by failing CI/CD (click to expand)
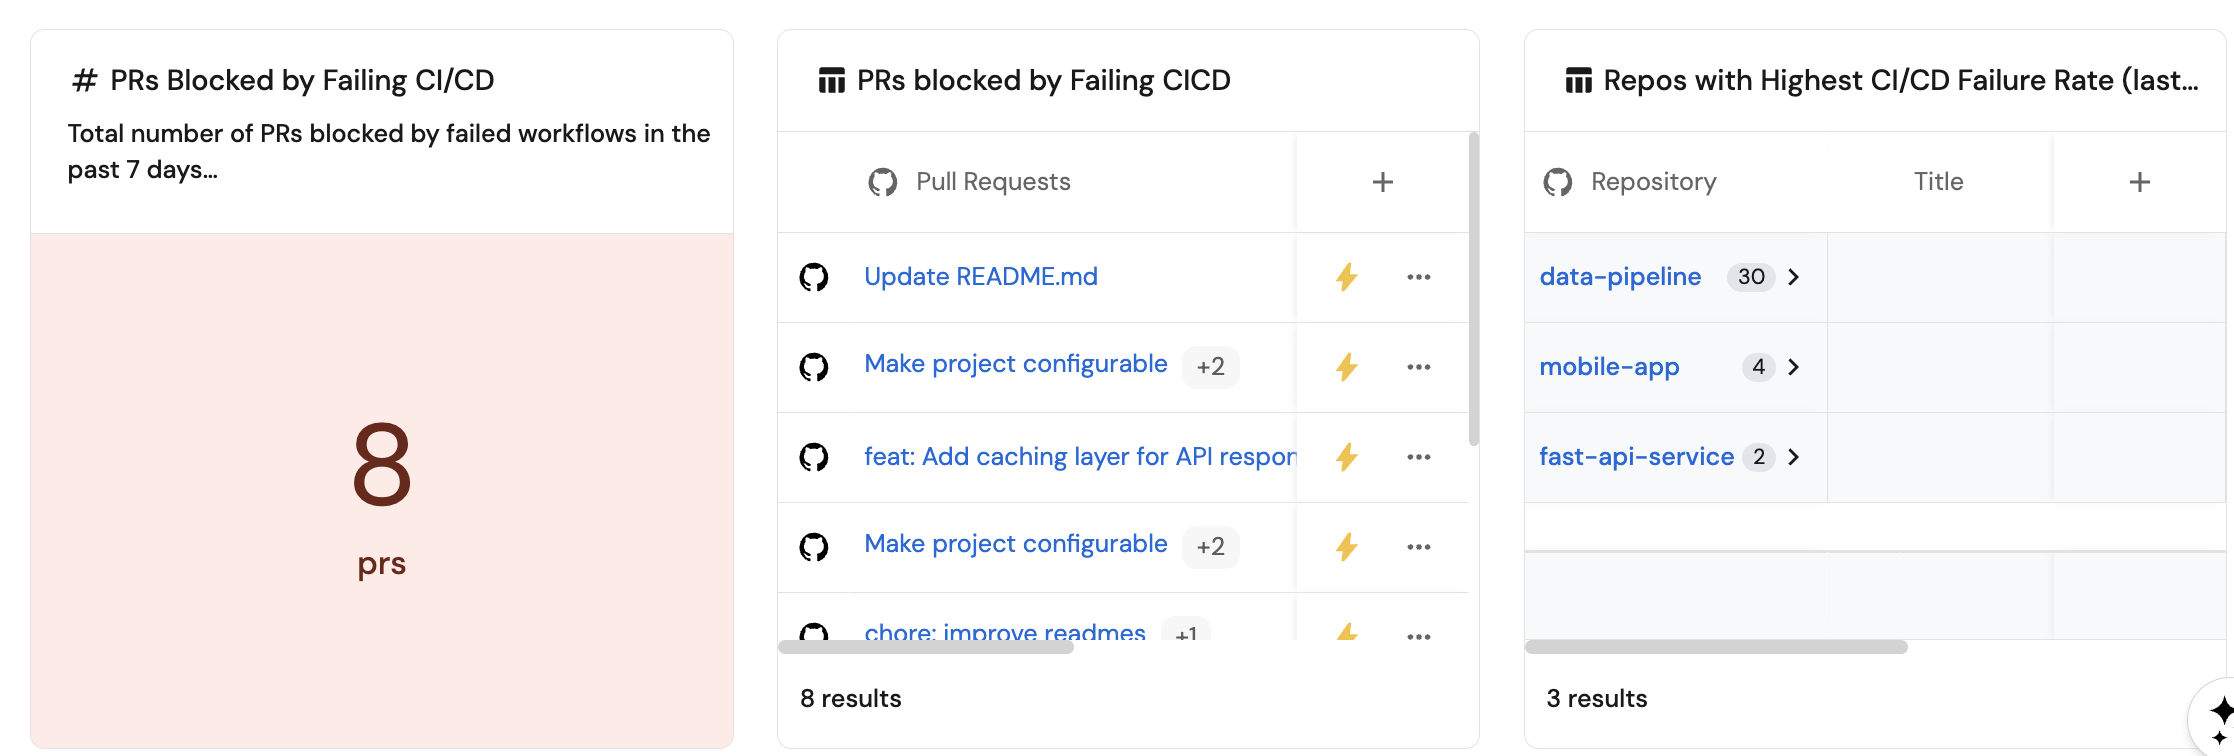
+ Widget and select Number Chart.PRs Blocked by Failing CI/CD.Count entities Chart type and choose Pull Request as the Blueprint.count for the Function.custom as the Unit and input prs as the Custom unit.Save.Workflow states (click to expand)
+ Widget and select Table.Save to add the widget to the dashboard.... button in the top right corner of the table and select Customize table.Manage Properties and add the following properties:
In the new dashboard, create the following widgets: Click Title: Description: Select Select Add this JSON to the Dataset filter editor: Select Click Click Title: Description: Set X axis: Set Y axis title: Click + Line and configure: Title: Chart type: Blueprint: Function: Measure time by: Add this JSON to the Additional filters editor: Click Click Title: Description: Choose the Azure Devops Build blueprint. Under Add this JSON to the Additional filters editor: Click Click Title: Description: Choose the Azure Devops Build blueprint. Under Add this JSON to the Additional filters editor: Click Click Title: Select Select Add this JSON to the Dataset filter editor: Select Click Click Title the widget Workflow States. Choose the Workflow State blueprint. Add this JSON to the Initial filters editor: Click Click on the In the top right corner of the table, click on Click on the save icon in the top right corner of the widget to save the customized table.Reliability Agent (click to expand)
+ Widget and select AI Agent.Reliability Agent.Workflow failure rate (last 7 days) (click to expand)
+ Widget and select Number Chart.Workflow Failure Rate (Last 7 Days).Total number of failed builds in the past week.Count entities Chart type and choose Azure Devops Build as the Blueprint.count for the Function.custom as the Unit and input workflow(s) as the Custom unit.Save.Workflow failure trend (weekly) (click to expand)
+ Widget and select Line Chart.Workflow Failure Trend (Weekly).Weekly trend of failed builds over the past 30 days.
Date.Week.In the past 30 days.# Failed Workflows.
Failed workflows.Count entities.Azure Devops Build.Count.startTime.Save.Workflow runs with most failures (last 7 days) (click to expand)
+ Widget and select Bar Chart.Workflow Runs with Most Failures (Last 7 Days).Build definitions with the highest number of failures in the past week.Breakdown by property, select the Definition Name property.Save.Services with highest CI/CD failure rate % (last 7 days) (click to expand)
+ Widget and select Pie chart.Services with Highest CI/CD Failure Rate % (Last 7 Days).Distribution of failed builds by repository in the past week.Breakdown by property, select the Repository property (this is a mirror property from the build relation).Save.Number of PRs blocked by failing CI/CD (click to expand)
+ Widget and select Number Chart.PRs Blocked by Failing CI/CD.Count entities Chart type and choose Pull Request as the Blueprint.count for the Function.custom as the Unit and input prs as the Custom unit.Save.Workflow states (click to expand)
+ Widget and select Table.Save to add the widget to the dashboard.... button in the top right corner of the table and select Customize table.Manage Properties and add the following properties: