Measure PR delivery metrics
Send this guide to your coding agent.
Prerequisite: Install Port MCP
Open plan mode. Implement this Port guide in my org via MCP:

https://docs.port.io/guides/all/measure-pr-delivery-metrics

Goal: get the guide's core flow working end-to-end in my org; adapting it to fit my existing setup takes priority over matching the guide 1:1.

Plan:
1. Confirm MCP is connected, in the right org, with sufficient permissions.
2. Diff the guide's data model (blueprints, properties, relations, actions, agents, automations, integrations, secrets) against mine.
3. Propose adaptations for gaps, reusing existing blueprints/relations over guide-named duplicates.
4. Flag what needs a UI click, credential, or secret from me, testing MCP capability empirically before ruling anything out.
5. Stop on any blocker and give me options. Approving this plan authorizes the writes it lists; pause only for writes beyond what's listed.

Build:
- Extend blueprint schema additively when upserting; don't remove or overwrite existing properties, and treat type conflicts as a blocker, not an auto-fix.
- List any mock data in the plan, minimal and labeled mock; once approved, seed it without re-asking, and tell me what you seeded.
- For anything the guide writes downstream (e.g. a webhook target), use a real entity, not a mock.
- For pages/widgets, use the real page identifier from the app URL, not a guessed slug.
- When you hit a UI step confirmed (not assumed) unsupported via MCP, pause, give exact clicks, then resume via MCP.
- Validate and give links after each meaningful step (only a tool-returned URL, no guessed paths); don't proceed if the last run wasn't a success.

Done:
- Confirm the guide's expected output exists and runs in Port.
- Summarize adaptations, seeded data, what was mocked or skipped, remaining UI steps, and how to verify.
If you signed up for Port on or after May 1, 2026, this dashboard is already set up in your portal. You can follow this guide to customize it to fit your organization's needs.
This guide supports GitHub (Ocean), GitLab, and Azure DevOps. Select the tab that matches your integration below.
Understanding how pull requests flow through your engineering organization is essential for identifying delivery bottlenecks, measuring team efficiency, and driving continuous improvement. Without PR-level visibility, engineering leaders lack the data needed to spot stale reviews, unbalanced workloads, or degrading cycle times before they impact delivery.
This guide walks you through building a comprehensive PR delivery metrics dashboard in Port that answers critical questions at both the service level and team level:
- Throughput: How many PRs are being merged weekly and monthly?
- Cycle time: How long does it take from PR creation to merge?
- Staleness: Which PRs have been open for more than 7 days, and what share do they represent?
- Quality indicators: Do open PRs have reviewers and assignees assigned?
By the end of this guide, you will have a dashboard that provides full visibility into PR delivery health across services and teams, helping you identify improvement areas and track progress over time.
Common use cases
- Track PR cycle time trends to identify slowdowns in code review and CI processes.
- Monitor PR throughput to understand team delivery capacity and detect regressions.
- Surface stale PRs that have been open longer than 7 days to unblock delivery.
- Identify PRs without assigned reviewers or assignees to improve process compliance.
- Compare delivery metrics across teams to understand organizational performance.
Prerequisites
This guide assumes the following:
- You have a Port account and have completed the onboarding process.
- You have completed the Create foundational Engineering Intelligence data model guide, which provisions the core Organization, Team, and Service blueprints (with team ownership on services) for GitHub, GitLab, and Azure DevOps.
- GitHub (Ocean)
- GitLab
- Azure DevOps
- Port's GitHub Ocean integration is installed in your account.
- The
githubPullRequest,githubRepository,githubUser, andgithubTeamblueprints already exist (these are created automatically when you install the GitHub Ocean integration).
- Port's GitLab integration is installed in your account.
- The
gitlabMergeRequestandgitlabRepositoryblueprints already exist (these are created automatically when you install the GitLab integration).
- Port's Azure DevOps integration is installed in your account.
- The
azureDevopsPullRequestandazureDevopsRepositoryblueprints already exist (these are created automatically when you install the Azure DevOps integration).
Key metrics overview
This dashboard tracks PR delivery metrics across two levels - individual services and teams:
| Metric | What it measures | Why it matters |
|---|---|---|
| Open PRs | Total number of currently open PRs | Shows current work in progress and potential bottleneck signals |
| PR throughput | Number of PRs merged per week/month | Indicates delivery flow and team output capacity |
| Throughput trend | Weekly vs. monthly throughput direction | Reveals whether delivery velocity is improving or degrading |
| Stale PRs | PRs open longer than 7 days | Highlights blocked work, unclear ownership, or review delays |
| Stale PR share (%) | Percentage of open PRs that are stale | Quantifies the severity of staleness across the portfolio |
| Cycle time | Hours from PR creation to merge (weekly/monthly avg) | Exposes friction in reviews, CI, and approval processes |
| Cycle time trend | Weekly vs. monthly cycle time direction | Shows whether review and merge speed is improving over time |
| Reviewer coverage | Whether open PRs have reviewers assigned | Signals process compliance and review readiness |
| Assignee coverage | Whether open PRs have assignees assigned | Indicates ownership clarity for open work |
Set up data model
- GitHub (Ocean)
- GitLab
- Azure DevOps
The GitHub Ocean integration automatically creates the githubPullRequest, githubRepository, githubUser, and githubTeam blueprints with default properties. The pull request blueprint comes with status, createdAt, mergedAt, closedAt, prNumber, link, branch, and lead_time_hours out of the box, along with relations for repository, git_hub_creator, git_hub_assignees, git_hub_reviewers, and a dynamic service relation.
lead_time_hours is a schema property that exists on the blueprint but is not populated by the default GitHub Ocean mapping. The actively mapped lead time metric is cycle_time_hours, which all aggregations in this guide reference.
We need to extend these default blueprints with additional properties for cycle time, staleness tracking, and quality indicators, then add aggregation and calculation properties to the service and Team blueprints to surface metrics at those levels.
Update the GitHub pull request blueprint
Add properties for cycle time measurement, quality indicators, and staleness tracking to the existing githubPullRequest blueprint.
-
Go to the Builder page of your portal.
-
Find the GitHub Pull Request blueprint and click on it.
-
Click on the
{...}button in the top right corner, and choose Edit JSON. -
Add the following properties to the
propertiessection of theschemaobject (alongside the existing default properties):Additional PR properties (click to expand)
"cycle_time_hours": {"title": "PR Cycle Time (Hours)","type": "number","description": "Time from PR creation to merge in hours"},"has_assignees": {"title": "Has Assignees","type": "boolean","description": "Whether the PR has at least one assignee"},"has_reviewers": {"title": "Has Reviewers","type": "boolean","description": "Whether the PR has at least one reviewer assigned"},"reviewDecision": {"title": "Review Decision","type": "string"}reviewDecision populationreviewDecisionexists as a schema property on the blueprint but is not populated by the default GitHub Ocean mapping. You must add a custom mapping entry to populate it if needed. -
Add the following entry to the
mirrorPropertiessection of the blueprint. This resolves the owning team of each reviewer so you can filter or group PRs by reviewer team:PR mirror property (click to expand)
"reviewer_teams": {"title": "Reviewer Teams","path": "reviewers.$team"} -
Add the following entries to the existing
calculationPropertiessection:PR calculation properties (click to expand)
"days_old": {"title": "Days Old","type": "number","calculation": "(now / 86400) - (.properties.createdAt | capture(\"(?<date>\\\\d{4}-\\\\d{2}-\\\\d{2})\") | .date | strptime(\"%Y-%m-%d\") | mktime / 86400) | floor"},"is_stale": {"title": "Is Stale (7d+)","type": "boolean","calculation": "if .properties.status == \"open\" then ((now - (.properties.createdAt | sub(\"\\\\.[0-9]+Z$\"; \"Z\") | fromdateiso8601)) / 86400) > 7 else false end"},"pr_age_label": {"title": "PR Age Label","type": "string","calculation": "((now - (.properties.createdAt | sub(\"\\\\.[0-9]+Z$\"; \"Z\") | fromdateiso8601)) / 86400 | round) as $age | if $age <= 3 then \"0-3 days\" elif $age <= 7 then \"3-7 days\" elif $age <= 30 then \"7-30 days\" else \">30 days\" end","colorized": true,"colors": {"0-3 days": "green","3-7 days": "orange","7-30 days": "red",">30 days": "red"}}Existing relationsThe default
githubPullRequestblueprint already includes relations forrepository,git_hub_creator,git_hub_assignees,git_hub_reviewers, and a dynamicservicerelation. No changes to relations are needed. -
Click Save to update the blueprint.
Update the service blueprint
Add aggregation and calculation properties to the service blueprint so that each service displays its own PR delivery metrics.
-
Go to your Builder page.
-
Find the Service blueprint and click on it.
-
Click on the
{...}button in the top right corner, and choose Edit JSON. -
Add the following entries to the
aggregationPropertiessection of the blueprint:Service aggregation properties (click to expand)
"github_open_prs": {"title": "Open PRs","type": "number","target": "githubPullRequest","query": {"combinator": "and","rules": [{"property": "status","operator": "=","value": "open"}]},"calculationSpec": {"func": "count","calculationBy": "entities"}},"github_stale_prs_7d": {"title": "Stale PRs (7d)","type": "number","target": "githubPullRequest","query": {"combinator": "and","rules": [{"property": "status","operator": "=","value": "open"},{"property": "createdAt","operator": "notBetween","value": {"preset": "lastWeek"}}]},"calculationSpec": {"func": "count","calculationBy": "entities"}},"github_merged_prs_last_week": {"title": "Merged PRs (Last Week)","type": "number","target": "githubPullRequest","query": {"combinator": "and","rules": [{"property": "mergedAt","operator": "between","value": {"preset": "lastWeek"}}]},"calculationSpec": {"func": "count","calculationBy": "entities"}},"github_merged_prs_last_month": {"title": "Merged PRs (Last Month)","type": "number","target": "githubPullRequest","query": {"combinator": "and","rules": [{"property": "mergedAt","operator": "between","value": {"preset": "lastMonth"}}]},"calculationSpec": {"func": "count","calculationBy": "entities"}},"github_pr_cycle_time": {"title": "Monthly PR Cycle Time","type": "number","target": "githubPullRequest","query": {"combinator": "and","rules": [{"property": "mergedAt","operator": "between","value": {"preset": "lastMonth"}}]},"calculationSpec": {"func": "average","calculationBy": "property","property": "cycle_time_hours"}},"github_pr_cycle_time_weekly": {"title": "Weekly PR Cycle Time","type": "number","target": "githubPullRequest","query": {"combinator": "and","rules": [{"property": "mergedAt","operator": "between","value": {"preset": "lastWeek"}}]},"calculationSpec": {"func": "average","calculationBy": "property","property": "cycle_time_hours"}} -
Add the following entries to the
calculationPropertiessection of the blueprint:Service calculation properties (click to expand)
"github_stale_pr_share_percent": {"title": "Stale PR Share (%)","type": "number","calculation": "if (.properties.github_open_prs != null and .properties.github_open_prs != 0) then (.properties.github_stale_prs_7d / .properties.github_open_prs) * 100 else 0 end"},"github_cycle_time_trend": {"title": "Cycle Time Trend","type": "string","colorized": true,"colors": {"Improving": "green","Degrading": "red","Stable": "blue"},"calculation": "((.properties.github_pr_cycle_time // 0) - (.properties.github_pr_cycle_time_weekly // 0)) as $diff | if $diff > 0 then \"Improving\" elif $diff < 0 then \"Degrading\" else \"Stable\" end"},"github_throughput_trend": {"title": "Throughput Trend","type": "string","colorized": true,"colors": {"Improving": "green","Degrading": "red","Stable": "blue"},"calculation": "((.properties.github_merged_prs_last_week // 0) * 30 - (.properties.github_merged_prs_last_month // 0) * 7) as $diff | if $diff > 0 then \"Improving\" elif $diff < 0 then \"Degrading\" else \"Stable\" end"} -
Click Save to update the blueprint.
Update the team blueprint
Add relations, mirror properties, and aggregation properties to the Team blueprint to aggregate delivery metrics across all services owned by each team. The aggregations use pathFilter to traverse the PR → service → _team relation chain and compute metrics directly from pull request data.
-
Go to your Builder page.
-
Find the Team blueprint and click on it.
-
Click on the
{...}button in the top right corner, and choose Edit JSON. -
Add the following entry to the
relationssection of the blueprint. This self-relation allows teams to be organized into a hierarchy (e.g., a "Frontend" team under an "Engineering" parent), which the dashboard uses to group team metrics by parent team:Team parent relation (click to expand)
"parent_team": {"title": "Parent Team","target": "_team","required": false,"many": false} -
Add the following entry to the
mirrorPropertiessection of the blueprint. This mirror resolves the parent team's name so the "Team Performance" table can group rows by parent team:Team mirror property (click to expand)
"parent_team_name": {"title": "Parent Team","path": "parent_team.$title"} -
Add the following entries to the
aggregationPropertiessection of the blueprint:Team aggregation properties (click to expand)
"services_count": {"title": "Services Count","type": "number","target": "service","calculationSpec": {"func": "count","calculationBy": "entities"},"pathFilter": [{"fromBlueprint": "service","path": ["_team"]}]},"github_open_prs": {"title": "Open PRs","type": "number","target": "githubPullRequest","query": {"combinator": "and","rules": [{"property": "status","operator": "=","value": "open"}]},"calculationSpec": {"func": "count","calculationBy": "entities"},"pathFilter": [{"fromBlueprint": "githubPullRequest","path": ["service", "_team"]}]},"github_stale_prs_7d": {"title": "Stale PRs (7d)","type": "number","target": "githubPullRequest","query": {"combinator": "and","rules": [{"property": "status","operator": "=","value": "open"},{"property": "createdAt","operator": "notBetween","value": {"preset": "lastWeek"}}]},"calculationSpec": {"func": "count","calculationBy": "entities"},"pathFilter": [{"fromBlueprint": "githubPullRequest","path": ["service", "_team"]}]},"github_merged_prs_last_week": {"title": "Merged PRs (Last Week)","type": "number","target": "githubPullRequest","query": {"combinator": "and","rules": [{"property": "mergedAt","operator": "between","value": {"preset": "lastWeek"}}]},"calculationSpec": {"func": "count","calculationBy": "entities"},"pathFilter": [{"fromBlueprint": "githubPullRequest","path": ["service", "_team"]}]},"github_merged_prs_last_month": {"title": "Merged PRs (Last Month)","type": "number","target": "githubPullRequest","query": {"combinator": "and","rules": [{"property": "mergedAt","operator": "between","value": {"preset": "lastMonth"}}]},"calculationSpec": {"func": "count","calculationBy": "entities"},"pathFilter": [{"fromBlueprint": "githubPullRequest","path": ["service", "_team"]}]},"github_pr_cycle_time_weekly": {"title": "Weekly PR Cycle Time","type": "number","target": "githubPullRequest","query": {"combinator": "and","rules": [{"property": "mergedAt","operator": "between","value": {"preset": "lastWeek"}}]},"calculationSpec": {"func": "average","calculationBy": "property","property": "cycle_time_hours"},"pathFilter": [{"fromBlueprint": "githubPullRequest","path": ["service", "_team"]}]},"github_pr_cycle_time": {"title": "Monthly PR Cycle Time","type": "number","target": "githubPullRequest","query": {"combinator": "and","rules": [{"property": "mergedAt","operator": "between","value": {"preset": "lastMonth"}}]},"calculationSpec": {"func": "average","calculationBy": "property","property": "cycle_time_hours"},"pathFilter": [{"fromBlueprint": "githubPullRequest","path": ["service", "_team"]}]} -
Add the following entries to the
calculationPropertiessection of the blueprint:Team calculation properties (click to expand)
"github_stale_pr_share_percent": {"title": "Stale PR Share (%)","type": "number","calculation": "if (.properties.github_open_prs != null and .properties.github_open_prs != 0) then (.properties.github_stale_prs_7d / .properties.github_open_prs) * 100 else 0 end"},"github_cycle_time_trend": {"title": "Cycle Time Trend","type": "string","colorized": true,"colors": {"Improving": "green","Degrading": "red","Stable": "blue"},"calculation": "((.properties.github_pr_cycle_time // 0) - (.properties.github_pr_cycle_time_weekly // 0)) as $diff | if $diff > 0 then \"Improving\" elif $diff < 0 then \"Degrading\" else \"Stable\" end"},"github_throughput_trend": {"title": "Throughput Trend","type": "string","colorized": true,"colors": {"Improving": "green","Degrading": "red","Stable": "blue"},"calculation": "((.properties.github_merged_prs_last_week // 0) * 30 - (.properties.github_merged_prs_last_month // 0) * 7) as $diff | if $diff > 0 then \"Improving\" elif $diff < 0 then \"Degrading\" else \"Stable\" end"},"github_merged_prs_per_service_last_month": {"title": "Merged PRs per Service (Monthly)","type": "number","calculation": "if (.properties.services_count != null and .properties.services_count != 0) then (.properties.github_merged_prs_last_month / .properties.services_count) else 0 end"},"github_open_prs_per_service": {"title": "Open PRs per Service","type": "number","calculation": "if (.properties.services_count != null and .properties.services_count != 0) then (.properties.github_open_prs / .properties.services_count) else 0 end"},"github_stale_prs_per_service_7d": {"title": "Stale PRs per Service (7d)","type": "number","calculation": "if (.properties.services_count != null and .properties.services_count != 0) then (.properties.github_stale_prs_7d / .properties.services_count) else 0 end"} -
Click Save to update the blueprint.
The aggregation properties on the Team blueprint use a pathFilter that traverses the relation chain PR → service → _team. For team-level metrics to populate, each service must have its Port team ownership ($team) set to the appropriate team.
The GitLab integration automatically creates the gitlabMergeRequest and gitlabRepository blueprints. The merge request blueprint comes with status, createdAt, updatedAt, mergedAt, link, leadTimeHours, cycle_time_hours, has_reviewers, and has_assignees out of the box (populated by the integration mapping), along with relations for repository, service, assignees_git_lab, reviewers_git_lab, and creator_git_lab.
The GitLab integration maps both cycle_time_hours and leadTimeHours using identical calculations. cycle_time_hours is the property that all aggregations in this guide reference. leadTimeHours is retained for backwards compatibility only.
We need to add calculation properties for staleness and age tracking to the gitlabMergeRequest blueprint, then add aggregation and calculation properties to the service and Team blueprints to surface metrics at those levels.
Update the GitLab merge request blueprint
The cycle_time_hours, has_assignees, and has_reviewers properties are populated automatically by the GitLab integration. Add the following calculation properties for staleness and age tracking:
-
Go to the Builder page of your portal.
-
Find the GitLab Merge Request blueprint and click on it.
-
Click on the
{...}button in the top right corner, and choose Edit JSON. -
Add the following entries to the
calculationPropertiessection of the blueprint:MR calculation properties (click to expand)
"days_old": {"title": "Days Old","type": "number","calculation": "(now / 86400) - (.properties.createdAt | capture(\"(?<date>\\\\d{4}-\\\\d{2}-\\\\d{2})\") | .date | strptime(\"%Y-%m-%d\") | mktime / 86400) | floor"},"is_stale": {"title": "Is Stale (7d+)","type": "boolean","calculation": "if .properties.status == \"opened\" then ((now - (.properties.createdAt | sub(\"\\\\.[0-9]+Z$\"; \"Z\") | fromdateiso8601)) / 86400) > 7 else false end"},"pr_age_label": {"title": "MR Age Label","type": "string","calculation": "((now - (.properties.createdAt | sub(\"\\\\.[0-9]+Z$\"; \"Z\") | fromdateiso8601)) / 86400 | round) as $age | if $age <= 3 then \"0-3 days\" elif $age <= 7 then \"3-7 days\" elif $age <= 30 then \"7-30 days\" else \">30 days\" end","colorized": true,"colors": {"0-3 days": "green","3-7 days": "orange","7-30 days": "red",">30 days": "red"}}Existing relationsThe default
gitlabMergeRequestblueprint already includes relations forrepository,service,assignees_git_lab,reviewers_git_lab, andcreator_git_lab. No changes to relations are needed. -
Add the following entry to the
mirrorPropertiessection of the blueprint. This resolves the owning team of each reviewer so you can filter or group MRs by reviewer team:MR mirror property (click to expand)
"reviewer_teams": {"title": "Reviewer Teams","path": "reviewers.$team"} -
Click Save to update the blueprint.
Update the service blueprint
Add aggregation and calculation properties to the service blueprint so that each service displays its own MR delivery metrics.
-
Go to your Builder page.
-
Find the Service blueprint and click on it.
-
Click on the
{...}button in the top right corner, and choose Edit JSON. -
Add the following entries to the
aggregationPropertiessection of the blueprint:Service aggregation properties (click to expand)
"gitlab_open_mrs": {"title": "Open MRs","type": "number","target": "gitlabMergeRequest","query": {"combinator": "and","rules": [{"property": "status","operator": "=","value": "opened"}]},"calculationSpec": {"func": "count","calculationBy": "entities"}},"gitlab_stale_mrs_7d": {"title": "Stale MRs (7d)","type": "number","target": "gitlabMergeRequest","query": {"combinator": "and","rules": [{"property": "status","operator": "=","value": "opened"},{"property": "createdAt","operator": "notBetween","value": {"preset": "lastWeek"}}]},"calculationSpec": {"func": "count","calculationBy": "entities"}},"gitlab_merged_mrs_last_week": {"title": "Merged MRs (Last Week)","type": "number","target": "gitlabMergeRequest","query": {"combinator": "and","rules": [{"property": "mergedAt","operator": "between","value": {"preset": "lastWeek"}}]},"calculationSpec": {"func": "count","calculationBy": "entities"}},"gitlab_merged_mrs_last_month": {"title": "Merged MRs (Last Month)","type": "number","target": "gitlabMergeRequest","query": {"combinator": "and","rules": [{"property": "mergedAt","operator": "between","value": {"preset": "lastMonth"}}]},"calculationSpec": {"func": "count","calculationBy": "entities"}},"gitlab_mr_cycle_time": {"title": "Monthly MR Cycle Time","type": "number","target": "gitlabMergeRequest","query": {"combinator": "and","rules": [{"property": "mergedAt","operator": "between","value": {"preset": "lastMonth"}}]},"calculationSpec": {"func": "average","calculationBy": "property","property": "cycle_time_hours"}},"gitlab_mr_cycle_time_weekly": {"title": "Weekly MR Cycle Time","type": "number","target": "gitlabMergeRequest","query": {"combinator": "and","rules": [{"property": "mergedAt","operator": "between","value": {"preset": "lastWeek"}}]},"calculationSpec": {"func": "average","calculationBy": "property","property": "cycle_time_hours"}} -
Add the following entries to the
calculationPropertiessection of the blueprint:Service calculation properties (click to expand)
"gitlab_stale_mr_share_percent": {"title": "Stale MR Share (%)","type": "number","calculation": "if (.properties.gitlab_open_mrs != null and .properties.gitlab_open_mrs != 0) then (.properties.gitlab_stale_mrs_7d / .properties.gitlab_open_mrs) * 100 else 0 end"},"gitlab_cycle_time_trend": {"title": "Cycle Time Trend","type": "string","colorized": true,"colors": {"Improving": "green","Degrading": "red","Stable": "blue"},"calculation": "((.properties.gitlab_mr_cycle_time // 0) - (.properties.gitlab_mr_cycle_time_weekly // 0)) as $diff | if $diff > 0 then \"Improving\" elif $diff < 0 then \"Degrading\" else \"Stable\" end"},"gitlab_throughput_trend": {"title": "Throughput Trend","type": "string","colorized": true,"colors": {"Improving": "green","Degrading": "red","Stable": "blue"},"calculation": "((.properties.gitlab_merged_mrs_last_week // 0) * 30 - (.properties.gitlab_merged_mrs_last_month // 0) * 7) as $diff | if $diff > 0 then \"Improving\" elif $diff < 0 then \"Degrading\" else \"Stable\" end"} -
Click Save to update the blueprint.
Update the team blueprint
Add aggregation and calculation properties to the Team blueprint to aggregate MR delivery metrics across all services owned by each team.
-
Go to your Builder page.
-
Find the Team blueprint and click on it.
-
Click on the
{...}button in the top right corner, and choose Edit JSON. -
Add the following entry to the
relationssection of the blueprint (if it does not already exist). This self-relation allows teams to be organized into a hierarchy:Team parent relation (click to expand)
"parent_team": {"title": "Parent Team","target": "_team","required": false,"many": false} -
Add the following entries to the
aggregationPropertiessection of the blueprint:Team aggregation properties (click to expand)
"services_count": {"title": "Services Count","type": "number","target": "service","calculationSpec": {"func": "count","calculationBy": "entities"}},"gitlab_open_mrs": {"title": "Open MRs","type": "number","target": "gitlabMergeRequest","query": {"combinator": "and","rules": [{"property": "status","operator": "=","value": "opened"}]},"calculationSpec": {"func": "count","calculationBy": "entities"}},"gitlab_stale_mrs_7d": {"title": "Stale MRs (7d)","type": "number","target": "gitlabMergeRequest","query": {"combinator": "and","rules": [{"property": "status","operator": "=","value": "opened"},{"property": "createdAt","operator": "notBetween","value": {"preset": "lastWeek"}}]},"calculationSpec": {"func": "count","calculationBy": "entities"}},"gitlab_merged_mrs_last_week": {"title": "Merged MRs (Last Week)","type": "number","target": "gitlabMergeRequest","query": {"combinator": "and","rules": [{"property": "mergedAt","operator": "between","value": {"preset": "lastWeek"}}]},"calculationSpec": {"func": "count","calculationBy": "entities"}},"gitlab_merged_mrs_last_month": {"title": "Merged MRs (Last Month)","type": "number","target": "gitlabMergeRequest","query": {"combinator": "and","rules": [{"property": "mergedAt","operator": "between","value": {"preset": "lastMonth"}}]},"calculationSpec": {"func": "count","calculationBy": "entities"}},"gitlab_mr_cycle_time_weekly": {"title": "Weekly MR Cycle Time","type": "number","target": "gitlabMergeRequest","query": {"combinator": "and","rules": [{"property": "mergedAt","operator": "between","value": {"preset": "lastWeek"}}]},"calculationSpec": {"func": "average","calculationBy": "property","property": "cycle_time_hours"}},"gitlab_mr_cycle_time": {"title": "Monthly MR Cycle Time","type": "number","target": "gitlabMergeRequest","query": {"combinator": "and","rules": [{"property": "mergedAt","operator": "between","value": {"preset": "lastMonth"}}]},"calculationSpec": {"func": "average","calculationBy": "property","property": "cycle_time_hours"}} -
Add the following entries to the
calculationPropertiessection of the blueprint:Team calculation properties (click to expand)
"gitlab_stale_mr_share_percent": {"title": "Stale MR Share (%)","type": "number","calculation": "if (.properties.gitlab_open_mrs != null and .properties.gitlab_open_mrs != 0) then (.properties.gitlab_stale_mrs_7d / .properties.gitlab_open_mrs) * 100 else 0 end"},"gitlab_cycle_time_trend": {"title": "Cycle Time Trend","type": "string","colorized": true,"colors": {"Improving": "green","Degrading": "red","Stable": "blue"},"calculation": "((.properties.gitlab_mr_cycle_time // 0) - (.properties.gitlab_mr_cycle_time_weekly // 0)) as $diff | if $diff > 0 then \"Improving\" elif $diff < 0 then \"Degrading\" else \"Stable\" end"},"gitlab_throughput_trend": {"title": "Throughput Trend","type": "string","colorized": true,"colors": {"Improving": "green","Degrading": "red","Stable": "blue"},"calculation": "((.properties.gitlab_merged_mrs_last_week // 0) * 30 - (.properties.gitlab_merged_mrs_last_month // 0) * 7) as $diff | if $diff > 0 then \"Improving\" elif $diff < 0 then \"Degrading\" else \"Stable\" end"},"gitlab_merged_mrs_per_service_last_month": {"title": "Merged MRs per Service (Monthly)","type": "number","calculation": "if (.properties.services_count != null and .properties.services_count != 0) then (.properties.gitlab_merged_mrs_last_month / .properties.services_count) else 0 end"},"gitlab_open_mrs_per_service": {"title": "Open MRs per Service","type": "number","calculation": "if (.properties.services_count != null and .properties.services_count != 0) then (.properties.gitlab_open_mrs / .properties.services_count) else 0 end"},"gitlab_stale_mrs_per_service_7d": {"title": "Stale MRs per Service (7d)","type": "number","calculation": "if (.properties.services_count != null and .properties.services_count != 0) then (.properties.gitlab_stale_mrs_7d / .properties.services_count) else 0 end"} -
Click Save to update the blueprint.
The GitLab aggregation properties on the Team blueprint use native team ownership - Port resolves which MRs belong to each team via the service → _team relation without a pathFilter. For team-level metrics to populate, each service must have its Port team ownership ($team) set to the appropriate team.
The Azure DevOps integration automatically creates the azureDevopsPullRequest and azureDevopsRepository blueprints. The pull request blueprint comes with status, createdAt, link, cycle_time_hours, and has_reviewers out of the box, along with calculation properties days_old, is_stale, and pr_age_label, and relations for repository, service, reviewers, azure_devops_reviewers, creator, and azure_devops_creator.
The azureDevopsPullRequest blueprint has has_reviewers but does not have a has_assignees property. ADO pull requests track reviewer coverage only.
We need to add a reviewer_teams mirror property and aggregation and calculation properties to the service and Team blueprints to surface metrics at those levels.
The cycle_time_hours, has_reviewers, days_old, is_stale, and pr_age_label properties are populated automatically by the Azure DevOps integration. The service relation is set by the integration mapping.
To add the reviewer_teams mirror property to the azureDevopsPullRequest blueprint:
-
Go to the Builder page of your portal.
-
Find the Azure DevOps Pull Request blueprint and click on it.
-
Click on the
{...}button in the top right corner, and choose Edit JSON. -
Add the following entry to the
mirrorPropertiessection:ADO PR mirror property (click to expand)
"reviewer_teams": {"title": "Reviewer Teams","path": "reviewers.$team"} -
Click Save to update the blueprint.
Update the service blueprint
Add aggregation and calculation properties to the service blueprint so that each service displays its own PR delivery metrics.
-
Go to your Builder page.
-
Find the Service blueprint and click on it.
-
Click on the
{...}button in the top right corner, and choose Edit JSON. -
Add the following entries to the
aggregationPropertiessection of the blueprint:Service aggregation properties (click to expand)
"ado_open_prs": {"title": "Open PRs","type": "number","target": "azureDevopsPullRequest","query": {"combinator": "and","rules": [{"operator": "=","property": "status","value": "active"}]},"calculationSpec": {"calculationBy": "entities","func": "count"},"pathFilter": [{"fromBlueprint": "azureDevopsPullRequest","path": ["service"]}]},"ado_stale_prs_7d": {"title": "Stale PRs (7d+)","type": "number","target": "azureDevopsPullRequest","query": {"combinator": "and","rules": [{"operator": "=","property": "status","value": "active"},{"operator": "notBetween","property": "createdAt","value": {"preset": "lastWeek"}}]},"calculationSpec": {"calculationBy": "entities","func": "count"},"pathFilter": [{"fromBlueprint": "azureDevopsPullRequest","path": ["service"]}]},"ado_merged_prs_last_week": {"title": "Weekly PR Throughput","type": "number","target": "azureDevopsPullRequest","query": {"combinator": "and","rules": [{"operator": "=","property": "status","value": "completed"},{"operator": "between","property": "$createdAt","value": {"preset": "lastWeek"}}]},"calculationSpec": {"calculationBy": "entities","func": "count"},"pathFilter": [{"fromBlueprint": "azureDevopsPullRequest","path": ["service"]}]},"ado_merged_prs_last_month": {"title": "Monthly PR Throughput","type": "number","target": "azureDevopsPullRequest","query": {"combinator": "and","rules": [{"operator": "=","property": "status","value": "completed"},{"operator": "between","property": "$createdAt","value": {"preset": "lastMonth"}}]},"calculationSpec": {"calculationBy": "entities","func": "count"},"pathFilter": [{"fromBlueprint": "azureDevopsPullRequest","path": ["service"]}]},"ado_pr_cycle_time": {"title": "Monthly PR Cycle Time","type": "number","target": "azureDevopsPullRequest","query": {"combinator": "and","rules": [{"operator": "=","property": "status","value": "completed"},{"operator": "between","property": "$createdAt","value": {"preset": "lastMonth"}}]},"calculationSpec": {"calculationBy": "property","func": "average","property": "cycle_time_hours"},"pathFilter": [{"fromBlueprint": "azureDevopsPullRequest","path": ["service"]}]},"ado_pr_cycle_time_weekly": {"title": "Weekly PR Cycle Time","type": "number","target": "azureDevopsPullRequest","query": {"combinator": "and","rules": [{"operator": "=","property": "status","value": "completed"},{"operator": "between","property": "$createdAt","value": {"preset": "lastWeek"}}]},"calculationSpec": {"calculationBy": "property","func": "average","property": "cycle_time_hours"},"pathFilter": [{"fromBlueprint": "azureDevopsPullRequest","path": ["service"]}]} -
Add the following entries to the
calculationPropertiessection of the blueprint:Service calculation properties (click to expand)
"ado_stale_pr_share_percent": {"title": "Stale PR Share (%)","type": "number","calculation": "if (.properties.ado_open_prs != null and .properties.ado_open_prs != 0) then (.properties.ado_stale_prs_7d / .properties.ado_open_prs) * 100 else 0 end"},"ado_cycle_time_trend": {"title": "PR Cycle Time Trend","type": "string","colorized": true,"colors": {"Improving": "green","Stable": "blue","Degrading": "red"},"calculation": "((.properties.ado_pr_cycle_time // 0) - (.properties.ado_pr_cycle_time_weekly // 0)) as $diff | if $diff > 0 then \"Improving\" elif $diff < 0 then \"Degrading\" else \"Stable\" end"},"ado_throughput_trend": {"title": "PR Throughput Trend","type": "string","colorized": true,"colors": {"Improving": "green","Stable": "blue","Degrading": "red"},"calculation": "((.properties.ado_merged_prs_last_week // 0) * 30 - (.properties.ado_merged_prs_last_month // 0) * 7) as $diff | if $diff > 0 then \"Improving\" elif $diff < 0 then \"Degrading\" else \"Stable\" end"} -
Click Save to update the blueprint.
Update the team blueprint
Add aggregation and calculation properties to the Team blueprint to aggregate PR delivery metrics across all services owned by each team.
-
Go to your Builder page.
-
Find the Team blueprint and click on it.
-
Click on the
{...}button in the top right corner, and choose Edit JSON. -
Add the following entry to the
relationssection of the blueprint (if it does not already exist). This self-relation allows teams to be organized into a hierarchy:Team parent relation (click to expand)
"parent_team": {"title": "Parent Team","target": "_team","required": false,"many": false} -
Add the following entry to the
mirrorPropertiessection of the blueprint (if it does not already exist):Team mirror property (click to expand)
"parent_team_name": {"title": "Parent Team","path": "parent_team.$title"} -
Add the following entries to the
aggregationPropertiessection of the blueprint:Team aggregation properties (click to expand)
"services_count": {"title": "Number of Services","type": "number","target": "service","calculationSpec": {"func": "count","calculationBy": "entities"}},"ado_open_prs": {"title": "Open PRs","type": "number","target": "azureDevopsPullRequest","query": {"combinator": "and","rules": [{"operator": "=","property": "status","value": "active"}]},"calculationSpec": {"calculationBy": "entities","func": "count"}},"ado_stale_prs_7d": {"title": "Stale PRs (7d+)","type": "number","target": "azureDevopsPullRequest","query": {"combinator": "and","rules": [{"operator": "=","property": "status","value": "active"},{"operator": "notBetween","property": "createdAt","value": {"preset": "lastWeek"}}]},"calculationSpec": {"calculationBy": "entities","func": "count"}},"ado_merged_prs_last_week": {"title": "Weekly PR Throughput","type": "number","target": "azureDevopsPullRequest","query": {"combinator": "and","rules": [{"operator": "=","property": "status","value": "completed"},{"operator": "between","property": "$createdAt","value": {"preset": "lastWeek"}}]},"calculationSpec": {"calculationBy": "entities","func": "count"}},"ado_merged_prs_last_month": {"title": "Monthly PR Throughput","type": "number","target": "azureDevopsPullRequest","query": {"combinator": "and","rules": [{"operator": "=","property": "status","value": "completed"},{"operator": "between","property": "$createdAt","value": {"preset": "lastMonth"}}]},"calculationSpec": {"calculationBy": "entities","func": "count"}},"ado_pr_cycle_time_weekly": {"title": "Weekly PR Cycle Time","type": "number","target": "azureDevopsPullRequest","query": {"combinator": "and","rules": [{"operator": "=","property": "status","value": "completed"},{"operator": "between","property": "$createdAt","value": {"preset": "lastWeek"}}]},"calculationSpec": {"calculationBy": "property","func": "average","property": "cycle_time_hours"}},"ado_pr_cycle_time": {"title": "Monthly PR Cycle Time","type": "number","target": "azureDevopsPullRequest","query": {"combinator": "and","rules": [{"operator": "=","property": "status","value": "completed"},{"operator": "between","property": "$createdAt","value": {"preset": "lastMonth"}}]},"calculationSpec": {"calculationBy": "property","func": "average","property": "cycle_time_hours"}} -
Add the following entries to the
calculationPropertiessection of the blueprint:Team calculation properties (click to expand)
"ado_stale_pr_share_percent": {"title": "Stale PR Share (%)","type": "number","calculation": "if (.properties.ado_open_prs != null and .properties.ado_open_prs != 0) then (.properties.ado_stale_prs_7d / .properties.ado_open_prs) * 100 else 0 end"},"ado_cycle_time_trend": {"title": "PR Cycle Time Trend","type": "string","colorized": true,"colors": {"Improving": "green","Stable": "blue","Degrading": "red"},"calculation": "((.properties.ado_pr_cycle_time // 0) - (.properties.ado_pr_cycle_time_weekly // 0)) as $diff | if $diff > 0 then \"Improving\" elif $diff < 0 then \"Degrading\" else \"Stable\" end"},"ado_throughput_trend": {"title": "PR Throughput Trend","type": "string","colorized": true,"colors": {"Improving": "green","Stable": "blue","Degrading": "red"},"calculation": "((.properties.ado_merged_prs_last_week // 0) * 30 - (.properties.ado_merged_prs_last_month // 0) * 7) as $diff | if $diff > 0 then \"Improving\" elif $diff < 0 then \"Degrading\" else \"Stable\" end"},"ado_merged_prs_per_service_last_month": {"title": "Monthly PR Throughput per Service","type": "number","calculation": "if (.properties.services_count != null and .properties.services_count != 0) then (.properties.ado_merged_prs_last_month / .properties.services_count) else 0 end"},"ado_open_prs_per_service": {"title": "Open PRs per Service","type": "number","calculation": "if (.properties.services_count != null and .properties.services_count != 0) then (.properties.ado_open_prs / .properties.services_count) else 0 end"},"ado_stale_prs_per_service_7d": {"title": "Stale PRs per Service","type": "number","calculation": "if (.properties.services_count != null and .properties.services_count != 0) then (.properties.ado_stale_prs_7d / .properties.services_count) else 0 end"} -
Click Save to update the blueprint.
The aggregation properties on the Team blueprint use Port's native team ownership. Pull requests inherit their owning team from the service they are linked to via the service relation. For team-level metrics to populate, each service must have its Port team ownership ($team) set to the appropriate team.
Update integration mapping
- GitHub (Ocean)
- GitLab
- Azure DevOps
Now we'll update the GitHub Ocean integration mapping to populate the new properties we added to the pull request blueprint. The default mapping already handles status, createdAt, mergedAt, closedAt, prNumber, link, branch, and all user/repository relations. The cycle_time_hours property is the actively mapped lead time metric and is what all aggregations in this guide reference. The lead_time_hours schema property exists on the blueprint but is not populated by default. We only need to add mappings for the new fields.
-
Go to your Data Source page.
-
Select the GitHub integration.
-
Find the first
pull-requestresource block in the mapping and add these additional property mappings alongside the existing ones:Additional pull request property mappings (click to expand)
# Add these properties to the first pull-request resource mapping# alongside the existing properties (status, closedAt, mergedAt, etc.)cycle_time_hours: >-(.created_at as $createdAt | .merged_at as $mergedAt |($createdAt | sub("\\..*Z$"; "Z") |strptime("%Y-%m-%dT%H:%M:%SZ") | mktime) as$createdTimestamp | ($mergedAt | if . == null then nullelse sub("\\..*Z$"; "Z") |strptime("%Y-%m-%dT%H:%M:%SZ") | mktime end) as$mergedTimestamp | if $mergedTimestamp == null then nullelse (((($mergedTimestamp - $createdTimestamp) / 3600) *100 | floor) / 100) end)has_assignees: .assignees | length > 0has_reviewers: .requested_reviewers | length > 0 -
In the first
pull-requestresource block, configure the selector to include closed PRs usingstates,maxResults, andsince. Ocean uses.__repositoryfor relations and.statefor the status property:- kind: pull-requestselector:query: "true"states: ["open", "closed"]maxResults: 100since: 90Ocean property mappingFor GitHub Ocean, map
statusfrom.statein your entity mappings, and use.__repositoryfor the repository relation. See the GitHub Ocean migration guide for details. -
Click Save & Resync to apply the mapping.
By default, the GitHub Ocean integration only fetches open pull requests. Setting states: ["open", "closed"] ensures that merged and closed PRs are ingested, which is required for cycle time and throughput calculations.
Set up GitHub service relations
The service relation on each githubPullRequest entity is set in two ways:
- At ingest - the integration mapping sets it via a search query on
github_repository_idto match the linked repository to a service. - On change - the
set_pull_request_relationsautomation fires whenever a service'sgithub_repositoryrelation changes and bulk-updates theservicerelation on allgithubPullRequestentities whoserepositoryrelation matches the updated repository.
Create the following automation so that changes to a service's linked repository propagate to all related pull requests:
- Go to the automations page.
- Click + Automation.
- Click the
{...} Edit JSONbutton. - Paste the following JSON and click Save:
Set Pull Request relations automation (click to expand)
{
  "identifier": "set_pull_request_relations",
  "title": "Set Pull Request relations",
  "trigger": {
    "type": "automation",
    "event": {"type": "ANY_ENTITY_CHANGE", "blueprintIdentifier": "service"},
    "condition": {
      "type": "JQ",
      "expressions": [
        ".diff.before.relations.github_repository != .diff.after.relations.github_repository",
        ".diff.after.relations.github_repository != null"
      ],
      "combinator": "and"
    }
  },
  "invocationMethod": {
    "type": "WEBHOOK",
    "url": "https://api.port.io/v1/migrations",
    "agent": false,
    "synchronized": true,
    "method": "POST",
    "headers": {"RUN_ID": "{{ .run.id }}", "Content-Type": "application/json"},
    "body": {
      "sourceBlueprint": "githubPullRequest",
      "mapping": {
        "blueprint": "githubPullRequest",
        "filter": ".relations.repository == \"{{ .event.diff.after.relations.github_repository }}\"",
        "entity": {
          "identifier": ".identifier",
          "relations": {"service": "\"{{ .event.context.entityIdentifier }}\""}
        }
      }
    }
  }
}
Set up GitHub user relations
Port-user relations (creator, reviewers, assignees) on githubPullRequest are kept in sync by the set_pull_request_user_relations automation. It fires whenever a _user entity's git_hub_user relation changes and bulk-updates the relevant Port-user relations on all matching pull request entities.
Create the following automation:
- Go to the automations page.
- Click + Automation.
- Click the
{...} Edit JSONbutton. - Paste the following JSON and click Save:
Set Pull Request user relations automation (click to expand)
{
  "identifier": "set_pull_request_user_relations",
  "title": "Set Pull Requests User Relations",
  "trigger": {
    "type": "automation",
    "event": {"type": "ANY_ENTITY_CHANGE", "blueprintIdentifier": "_user"},
    "condition": {
      "type": "JQ",
      "expressions": [
        ".diff.before.relations.git_hub_user != .diff.after.relations.git_hub_user",
        ".diff.after.relations.git_hub_user != null"
      ],
      "combinator": "and"
    }
  },
  "invocationMethod": {
    "type": "WEBHOOK",
    "url": "https://api.port.io/v1/migrations",
    "agent": false,
    "synchronized": true,
    "method": "POST",
    "headers": {"Content-Type": "application/json", "RUN_ID": "{{ .run.id }}"},
    "body": {
      "sourceBlueprint": "githubPullRequest",
      "mapping": {
        "blueprint": "githubPullRequest",
        "filter": "\"{{ .event.diff.after.relations.git_hub_user }}\" as $item | (.relations.git_hub_assignees | any(. == $item)) or ($item == .relations.git_hub_creator) or (.relations.git_hub_reviewers | any(. == $item))",
        "entity": {
          "identifier": ".identifier",
          "relations": {
            "creator": "if \"{{ .event.diff.after.relations.git_hub_user }}\" == .relations.git_hub_creator then \"{{ .event.context.entityIdentifier }}\" else .relations.creator end",
            "reviewers": "if (\"{{ .event.diff.after.relations.git_hub_user }}\" as $item | .relations.git_hub_reviewers | any(. == $item)) then ((.relations.reviewers // []) + [\"{{ .event.context.entityIdentifier }}\"] | unique) else .relations.reviewers end",
            "assignees": "if (\"{{ .event.diff.after.relations.git_hub_user }}\" as $item | .relations.git_hub_assignees | any(. == $item)) then ((.relations.assignees // []) + [\"{{ .event.context.entityIdentifier }}\"] | unique) else .relations.assignees end"
          }
        }
      }
    }
  }
}
The GitLab integration mapping already populates cycle_time_hours, has_reviewers, and has_assignees on the gitlabMergeRequest blueprint. You only need to ensure the merge-request selector includes both opened and merged MRs from the last 90 days.
The GitLab mapping populates both cycle_time_hours and leadTimeHours using identical calculations. cycle_time_hours is the property all aggregations in this guide reference. leadTimeHours is retained for backwards compatibility.
-
Go to your Data Source page.
-
Select the GitLab integration.
-
Find the
merge-requestresource block and verify or update it to match the following:Merging vs. replacingMerge this block with your existing
merge-requestmapping - don't replace it wholesale. The integration's default config already wires up Port-user relations (creator,reviewers,assignees) and their*_git_labcounterparts; the user-relations automation added later in this guide depends on those relations being present. The block below shows the full mapping (defaults plus theservicerelation this guide adds).- kind: merge-requestselector:query: 'true'states:- merged- openedupdatedAfter: 90includeOnlyActiveGroups: trueport:entity:mappings:identifier: .id | tostringtitle: .titleblueprint: '"gitlabMergeRequest"'properties:status: .statecreatedAt: .created_atupdatedAt: .updated_atmergedAt: .merged_atlink: .web_urlleadTimeHours: >-(.created_at as $createdAt | .merged_at as $mergedAt | ($createdAt | sub("\\.\\d+Z$"; "Z") |strptime("%Y-%m-%dT%H:%M:%SZ") | mktime) as $createdTimestamp | ($mergedAt | if . == null then null elsesub("\\.\\d+Z$"; "Z") | strptime("%Y-%m-%dT%H:%M:%SZ") | mktime end) as $mergedTimestamp | if$mergedTimestamp == null then null else (((($mergedTimestamp - $createdTimestamp) / 3600) * 100 | floor) /100) end)cycle_time_hours: >-(.created_at as $createdAt | .merged_at as $mergedAt | ($createdAt | sub("\\.\\d+Z$"; "Z") |strptime("%Y-%m-%dT%H:%M:%SZ") | mktime) as $createdTimestamp | ($mergedAt | if . == null then null elsesub("\\.\\d+Z$"; "Z") | strptime("%Y-%m-%dT%H:%M:%SZ") | mktime end) as $mergedTimestamp | if$mergedTimestamp == null then null else (((($mergedTimestamp - $createdTimestamp) / 3600) * 100 | floor) /100) end)has_reviewers: (.reviewers | length) > 0has_assignees: (.assignees | length) > 0relations:repository: .references.full // "" | gsub("!.+"; "")assignees_git_lab: .assignees | map(.username)reviewers_git_lab: .reviewers | map(.username)creator_git_lab: .author.usernamereviewers:combinator: '"and"'rules:- operator: '"in"'property: '"git_lab_username"'value: .reviewers | map(.username)assignees:combinator: '"and"'rules:- operator: '"in"'property: '"git_lab_username"'value: .assignees | map(.username)creator:combinator: '"and"'rules:- operator: '"="'property: '"git_lab_username"'value: .author.usernameservice:combinator: '"and"'rules:- property: '"gitlab_repository_identifier"'operator: '"="'value: .references.full // "" | gsub("!.+"; "") -
Click Save & Resync to apply the mapping.
The selector must include both merged and opened states. Without merged MRs, cycle time and throughput calculations will be empty. The updatedAfter: 90 setting ingests MRs updated within the last 90 days.
Set up GitLab service relations
The aggregation properties on the service blueprint count MR entities that have their service relation pointing to the correct service. Port sets this relation automatically via an automation that fires whenever a service's gitlab_repository relation is updated.
gitlab_repository relation on serviceThis automation requires the service blueprint to have a gitlab_repository relation pointing to gitlabRepository. If your service blueprint does not yet have this relation, add it:
-
Go to your Builder page.
-
Find the Service blueprint and click on it.
-
Click on the
{...}button in the top right corner, and choose Edit JSON. -
Add the following to the
relationssection:"gitlab_repository": {"title": "GitLab Repository","target": "gitlabRepository","required": false,"many": false} -
Click Save.
-
For each service entity, set the
gitlab_repositoryrelation to its correspondinggitlabRepositoryentity. The automation below will then populate theservicerelation on all matching MR entities.
Create the following automation so that whenever a service's gitlab_repository relation is set or changed, Port bulk-updates the service relation on all matching gitlabMergeRequest entities:
- Go to the automations page.
- Click + Automation.
- Click the
{...} Edit JSONbutton. - Paste the following JSON and click Save:
Set GitLab Merge Request relations automation (click to expand)
{
  "identifier": "set_gitlab_merge_request_relations",
  "title": "Set GitLab Merge Request relations",
  "trigger": {
    "type": "automation",
    "event": {"type": "ANY_ENTITY_CHANGE", "blueprintIdentifier": "service"},
    "condition": {
      "type": "JQ",
      "expressions": [
        ".diff.before.relations.gitlab_repository != .diff.after.relations.gitlab_repository",
        ".diff.after.relations.gitlab_repository != null"
      ],
      "combinator": "and"
    }
  },
  "invocationMethod": {
    "type": "WEBHOOK",
    "url": "https://api.port.io/v1/migrations",
    "agent": false,
    "synchronized": true,
    "method": "POST",
    "headers": {"Content-Type": "application/json", "RUN_ID": "{{ .run.id }}"},
    "body": {
      "sourceBlueprint": "gitlabMergeRequest",
      "mapping": {
        "blueprint": "gitlabMergeRequest",
        "filter": ".relations.repository == \"{{ .event.diff.after.relations.gitlab_repository }}\"",
        "entity": {
          "identifier": ".identifier",
          "relations": {"service": "\"{{ .event.context.entityIdentifier }}\""}
        }
      }
    }
  }
}
Set up GitLab user relations
Port-user relations (creator, reviewers, assignees) on gitlabMergeRequest are kept in sync by the set_gitlab_merge_request_user_relations automation. It fires whenever a _user entity's git_lab_user relation changes and bulk-updates the relevant Port-user relations on all matching merge request entities.
Create the following automation:
- Go to the automations page.
- Click + Automation.
- Click the
{...} Edit JSONbutton. - Paste the following JSON and click Save:
Set GitLab Merge Request user relations automation (click to expand)
{
  "identifier": "set_gitlab_merge_request_user_relations",
  "title": "Set GitLab Merge Requests user relations",
  "trigger": {
    "type": "automation",
    "event": {"type": "ANY_ENTITY_CHANGE", "blueprintIdentifier": "_user"},
    "condition": {
      "type": "JQ",
      "expressions": [
        ".diff.before.relations.git_lab_user != .diff.after.relations.git_lab_user",
        ".diff.after.relations.git_lab_user != null"
      ],
      "combinator": "and"
    }
  },
  "invocationMethod": {
    "type": "WEBHOOK",
    "url": "https://api.port.io/v1/migrations",
    "agent": false,
    "synchronized": true,
    "method": "POST",
    "headers": {"Content-Type": "application/json", "RUN_ID": "{{ .run.id }}"},
    "body": {
      "sourceBlueprint": "gitlabMergeRequest",
      "mapping": {
        "blueprint": "gitlabMergeRequest",
        "filter": "\"{{ .event.diff.after.relations.git_lab_user }}\" as $item | (.relations.assignees_git_lab | any(. == $item)) or ($item == .relations.creator_git_lab) or (.relations.reviewers_git_lab | any(. == $item))",
        "entity": {
          "identifier": ".identifier",
          "relations": {
            "creator": "if \"{{ .event.diff.after.relations.git_lab_user }}\" == .relations.creator_git_lab then \"{{ .event.context.entityIdentifier }}\" else .relations.creator end",
            "reviewers": "if (\"{{ .event.diff.after.relations.git_lab_user }}\" as $item | .relations.reviewers_git_lab | any(. == $item)) then ((.relations.reviewers // []) + [\"{{ .event.context.entityIdentifier }}\"] | unique) else .relations.reviewers end",
            "assignees": "if (\"{{ .event.diff.after.relations.git_lab_user }}\" as $item | .relations.assignees_git_lab | any(. == $item)) then ((.relations.assignees // []) + [\"{{ .event.context.entityIdentifier }}\"] | unique) else .relations.assignees end"
          }
        }
      }
    }
  }
}
The Azure DevOps integration mapping already populates cycle_time_hours, has_reviewers, days_old, is_stale, and pr_age_label on the azureDevopsPullRequest blueprint.
The service relation on each pull request is set in two ways:
- At ingest - the integration mapping sets it via a search query on
ado_repository_idto match the linked repository to a service. - On change - the
set_ado_pull_request_relationsautomation fires whenever a service'sazureDevopsRepositoryrelation changes and bulk-updates theservicerelation on allazureDevopsPullRequestentities whoserepositoryrelation matches.
You only need to ensure the pull request resource selector includes both active and completed pull requests so that throughput and cycle time calculations have sufficient data.
-
Go to your Data Source page.
-
Select the Azure DevOps integration.
-
Find the
pull-requestresource block in the mapping and verify or update the selector:- kind: pull-requestselector:query: ".status == \"active\" or .status == \"completed\"" -
Click Save & Resync to apply the mapping.
The selector must include both active and completed states. Without completed PRs, cycle time and throughput calculations will be empty.
Set up Azure DevOps service relations
Create the following automation so that changes to a service's linked Azure DevOps repository propagate to all related pull requests:
- Go to the automations page.
- Click + Automation.
- Click the
{...} Edit JSONbutton. - Paste the following JSON and click Save:
Set Azure DevOps Pull Request relations automation (click to expand)
{
  "identifier": "set_ado_pull_request_relations",
  "title": "Set Azure Devops Pull Request relations",
  "trigger": {
    "type": "automation",
    "event": {"type": "ANY_ENTITY_CHANGE", "blueprintIdentifier": "service"},
    "condition": {
      "type": "JQ",
      "expressions": [
        ".diff.before.relations.azureDevopsRepository != .diff.after.relations.azureDevopsRepository",
        ".diff.after.relations.azureDevopsRepository != null"
      ],
      "combinator": "and"
    }
  },
  "invocationMethod": {
    "type": "WEBHOOK",
    "url": "https://api.port.io/v1/migrations",
    "agent": false,
    "synchronized": true,
    "method": "POST",
    "headers": {"Content-Type": "application/json", "RUN_ID": "{{ .run.id }}"},
    "body": {
      "sourceBlueprint": "azureDevopsPullRequest",
      "mapping": {
        "blueprint": "azureDevopsPullRequest",
        "filter": ".relations.repository == \"{{ .event.diff.after.relations.azureDevopsRepository }}\"",
        "entity": {
          "identifier": ".identifier",
          "relations": {"service": "\"{{ .event.context.entityIdentifier }}\""}
        }
      }
    }
  }
}
Set up Azure DevOps user relations
Port-user relations (creator, reviewers) on azureDevopsPullRequest are kept in sync by the set_ado_pull_request_user_relations automation. It fires whenever a _user entity's azure_devops_user relation changes and bulk-updates the relevant Port-user relations on all matching pull request entities.
The azureDevopsPullRequest blueprint does not have an assignees relation - only creator and reviewers are updated by this automation.
Create the following automation:
- Go to the automations page.
- Click + Automation.
- Click the
{...} Edit JSONbutton. - Paste the following JSON and click Save:
Set Azure DevOps Pull Request user relations automation (click to expand)
{
  "identifier": "set_ado_pull_request_user_relations",
  "title": "Set Azure Devops Pull Request User relations",
  "trigger": {
    "type": "automation",
    "event": {"type": "ANY_ENTITY_CHANGE", "blueprintIdentifier": "_user"},
    "condition": {
      "type": "JQ",
      "expressions": [
        ".diff.before.relations.azure_devops_user != .diff.after.relations.azure_devops_user",
        ".diff.after.relations.azure_devops_user != null"
      ],
      "combinator": "and"
    }
  },
  "invocationMethod": {
    "type": "WEBHOOK",
    "url": "https://api.port.io/v1/migrations",
    "agent": false,
    "synchronized": true,
    "method": "POST",
    "headers": {"Content-Type": "application/json", "RUN_ID": "{{ .run.id }}"},
    "body": {
      "sourceBlueprint": "azureDevopsPullRequest",
      "mapping": {
        "blueprint": "azureDevopsPullRequest",
        "filter": "\"{{ .event.diff.after.relations.azure_devops_user }}\" as $item | ($item == .relations.azure_devops_creator) or (.relations.azure_devops_reviewers | any(. == $item))",
        "entity": {
          "identifier": ".identifier",
          "relations": {
            "creator": "if \"{{ .event.diff.after.relations.azure_devops_user }}\" == .relations.azure_devops_creator then \"{{ .event.context.entityIdentifier }}\" else .relations.creator end",
            "reviewers": "if (\"{{ .event.diff.after.relations.azure_devops_user }}\" as $item | .relations.azure_devops_reviewers | any(. == $item)) then ((.relations.reviewers // []) + [\"{{ .event.context.entityIdentifier }}\"] | unique) else .relations.reviewers end"
          }
        }
      }
    }
  }
}
Visualize metrics
We will create a dedicated dashboard to monitor PR delivery metrics using Port's customizable widgets. The dashboard is organized into sections covering high-level metrics, service performance, team performance, stale PR analysis, and PR quality indicators.
Create the dashboard
First, let's create an Engineering Intelligence folder to organize your dashboards, then add the Delivery Performance dashboard inside it:
- Navigate to your software catalog.
- Click on the
+ Newbutton in the left sidebar. - Select New folder.
- Name the folder Engineering Intelligence and click Create.
- Inside the Engineering Intelligence folder, click
+ Newagain. - Select New dashboard.
- Name the dashboard Delivery Performance and click Create.
Add widgets
- GitHub (Ocean)
- GitLab
- Azure DevOps
You can populate the dashboard using either an API script or by manually creating each widget through the UI.
- API script
- Manual setup
The fastest way to set up the dashboard is by using Port's API to create all widgets at once.
Get your Port API token
-
In your Port portal, click on your profile picture in the top right corner.
-
Select Credentials.
-
Click Generate API token.
-
Copy the generated token and store it as an environment variable:
export PORT_ACCESS_TOKEN="YOUR_GENERATED_TOKEN"
If your portal is hosted in the EU region, replace api.port.io with api.port-eu.io in the dashboard creation command below.
Create the dashboard with widgets
Save the following JSON to a file named dp_dashboard.json:Dashboard JSON payload (click to expand)
Then run the following command to create the dashboard with all widgets:
curl -s -X POST "https://api.port.io/v1/pages" \
  -H "Authorization: Bearer $PORT_ACCESS_TOKEN" \
  -H "Content-Type: application/json" \
  -d @dp_dashboard.json | python3 -m json.tool
The script assumes an engineering_intelligence folder already exists in your catalog. If you haven't created it yet, follow step 1-4 in the create the dashboard section first else you will run into an error when you run the script
High-level PR metrics
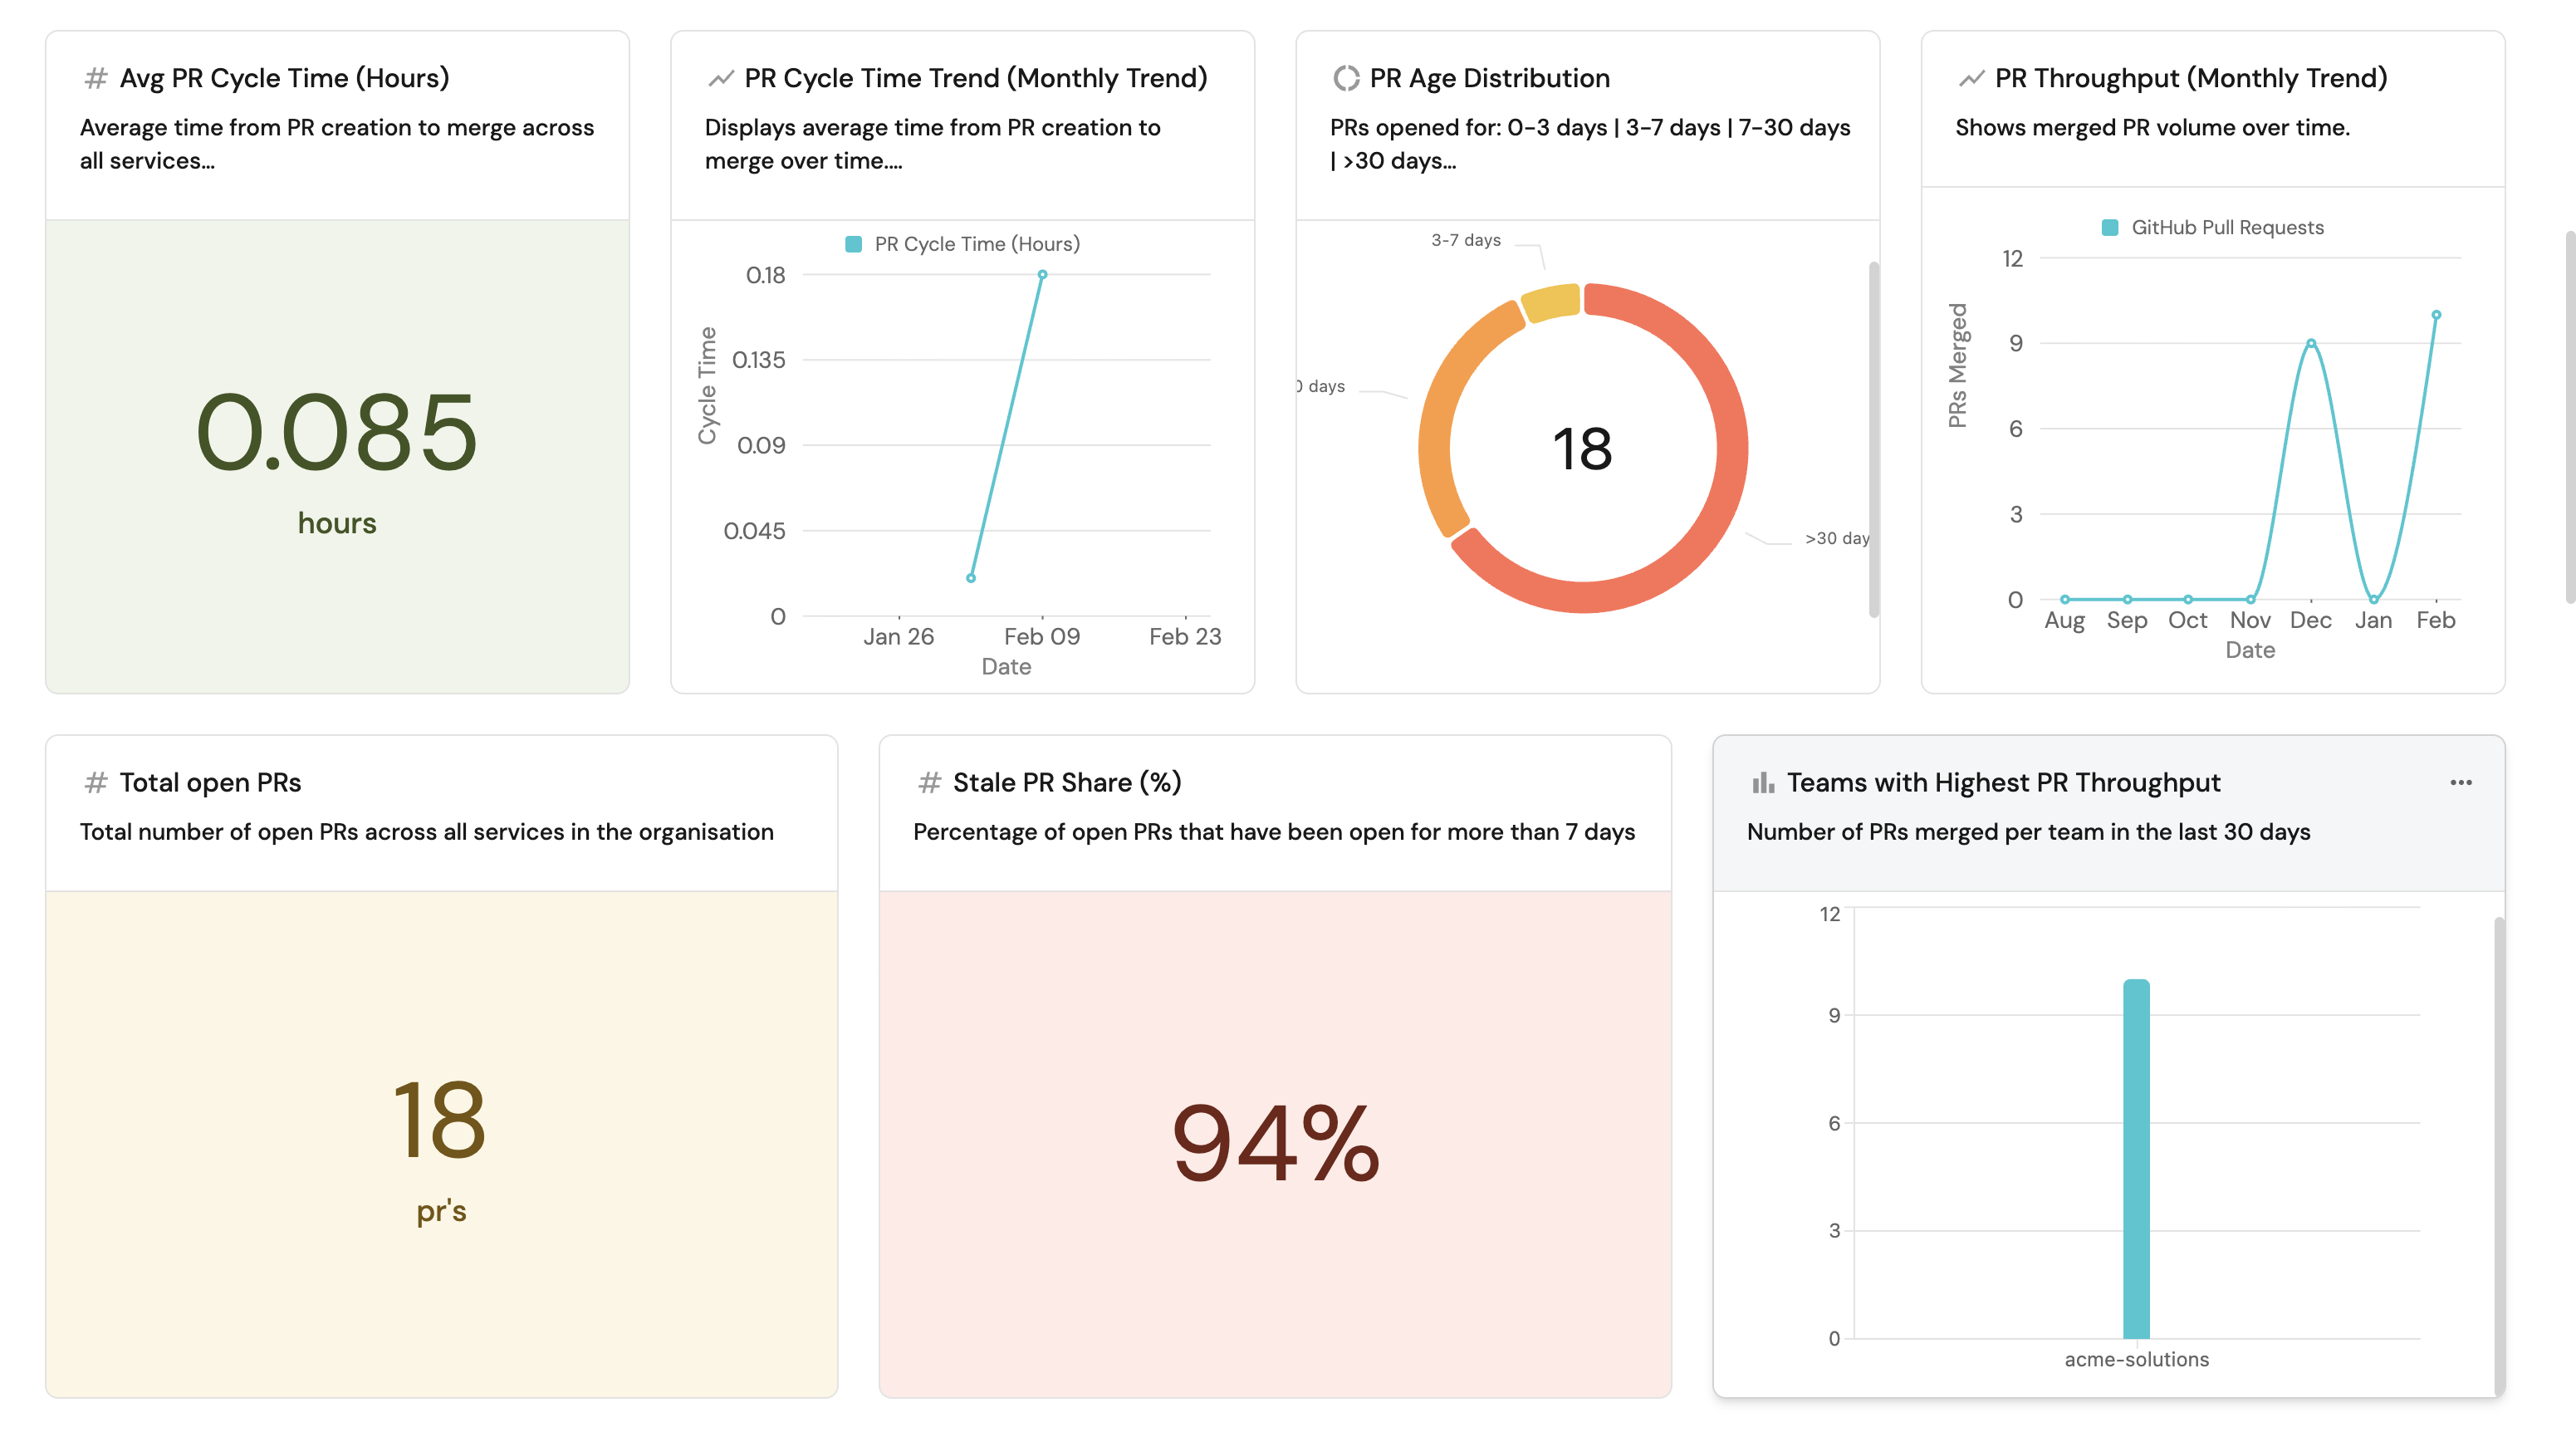
Start with summary widgets that give an at-a-glance view of PR delivery health. Click Title: Description: Select Select Select Select Add this JSON to the Additional filters editor: Click Save. Click Title: Description: Select Select Add this JSON to the Dataset filter editor: Click Save. Click Title: Description: Select GitHub Pull Request as the Blueprint. Select Add this JSON to the Additional filters editor: Click Save.Avg PR cycle time (hours) (click to expand)
+ Widget and select Number Chart.Avg PR Cycle Time (Hours).Average time from PR creation to merge across all services.Aggregate Property (All Entities) Chart type and choose GitHub Pull Request as the Blueprint.cycle_time_hours as the Property.average for the Function.total for Average of.PR cycle time trend (monthly) (click to expand)
+ Widget and select Line Chart.PR Cycle Time Trend (Monthly Trend). Description: Displays average time from PR creation to merge over time.
Date.Week.In the past 30 days.Cycle Time.
PR cycle time.Aggregate property values.GitHub Pull Request.average.PR cycle time (hours) (cycle_time_hours).mergedAt.PR throughput (monthly trend) (click to expand)
+ Widget and select Line Chart.PR Throughput (Monthly Trend). Description: Shows merged PR volume over time.
Date.month.In the past 180 days.PRs Merged.
Merged PRs.Count entities.GitHub Pull Request.count.mergedAt.Total open PRs (click to expand)
+ Widget and select Number Chart.Total open PRs.Total number of open PRs across all services in the organisation.Count entities Chart type and choose GitHub Pull Request as the Blueprint.count for the Function.Stale PR share (%) (click to expand)
+ Widget and select Number Chart.Stale PR Share (%).Percentage of open PRs that have been open for more than 7 days.Display Single Property Chart type and choose Organization as the Blueprint.default-org.GitHub Stale PR Share (%) (github_stale_pr_share_percent) as the Property.Teams with highest PR throughput (click to expand)
+ Widget and select Bar Chart.Teams with Highest PR Throughput.Number of PRs merged per team in the last 30 days.Team as the Breakdown by property.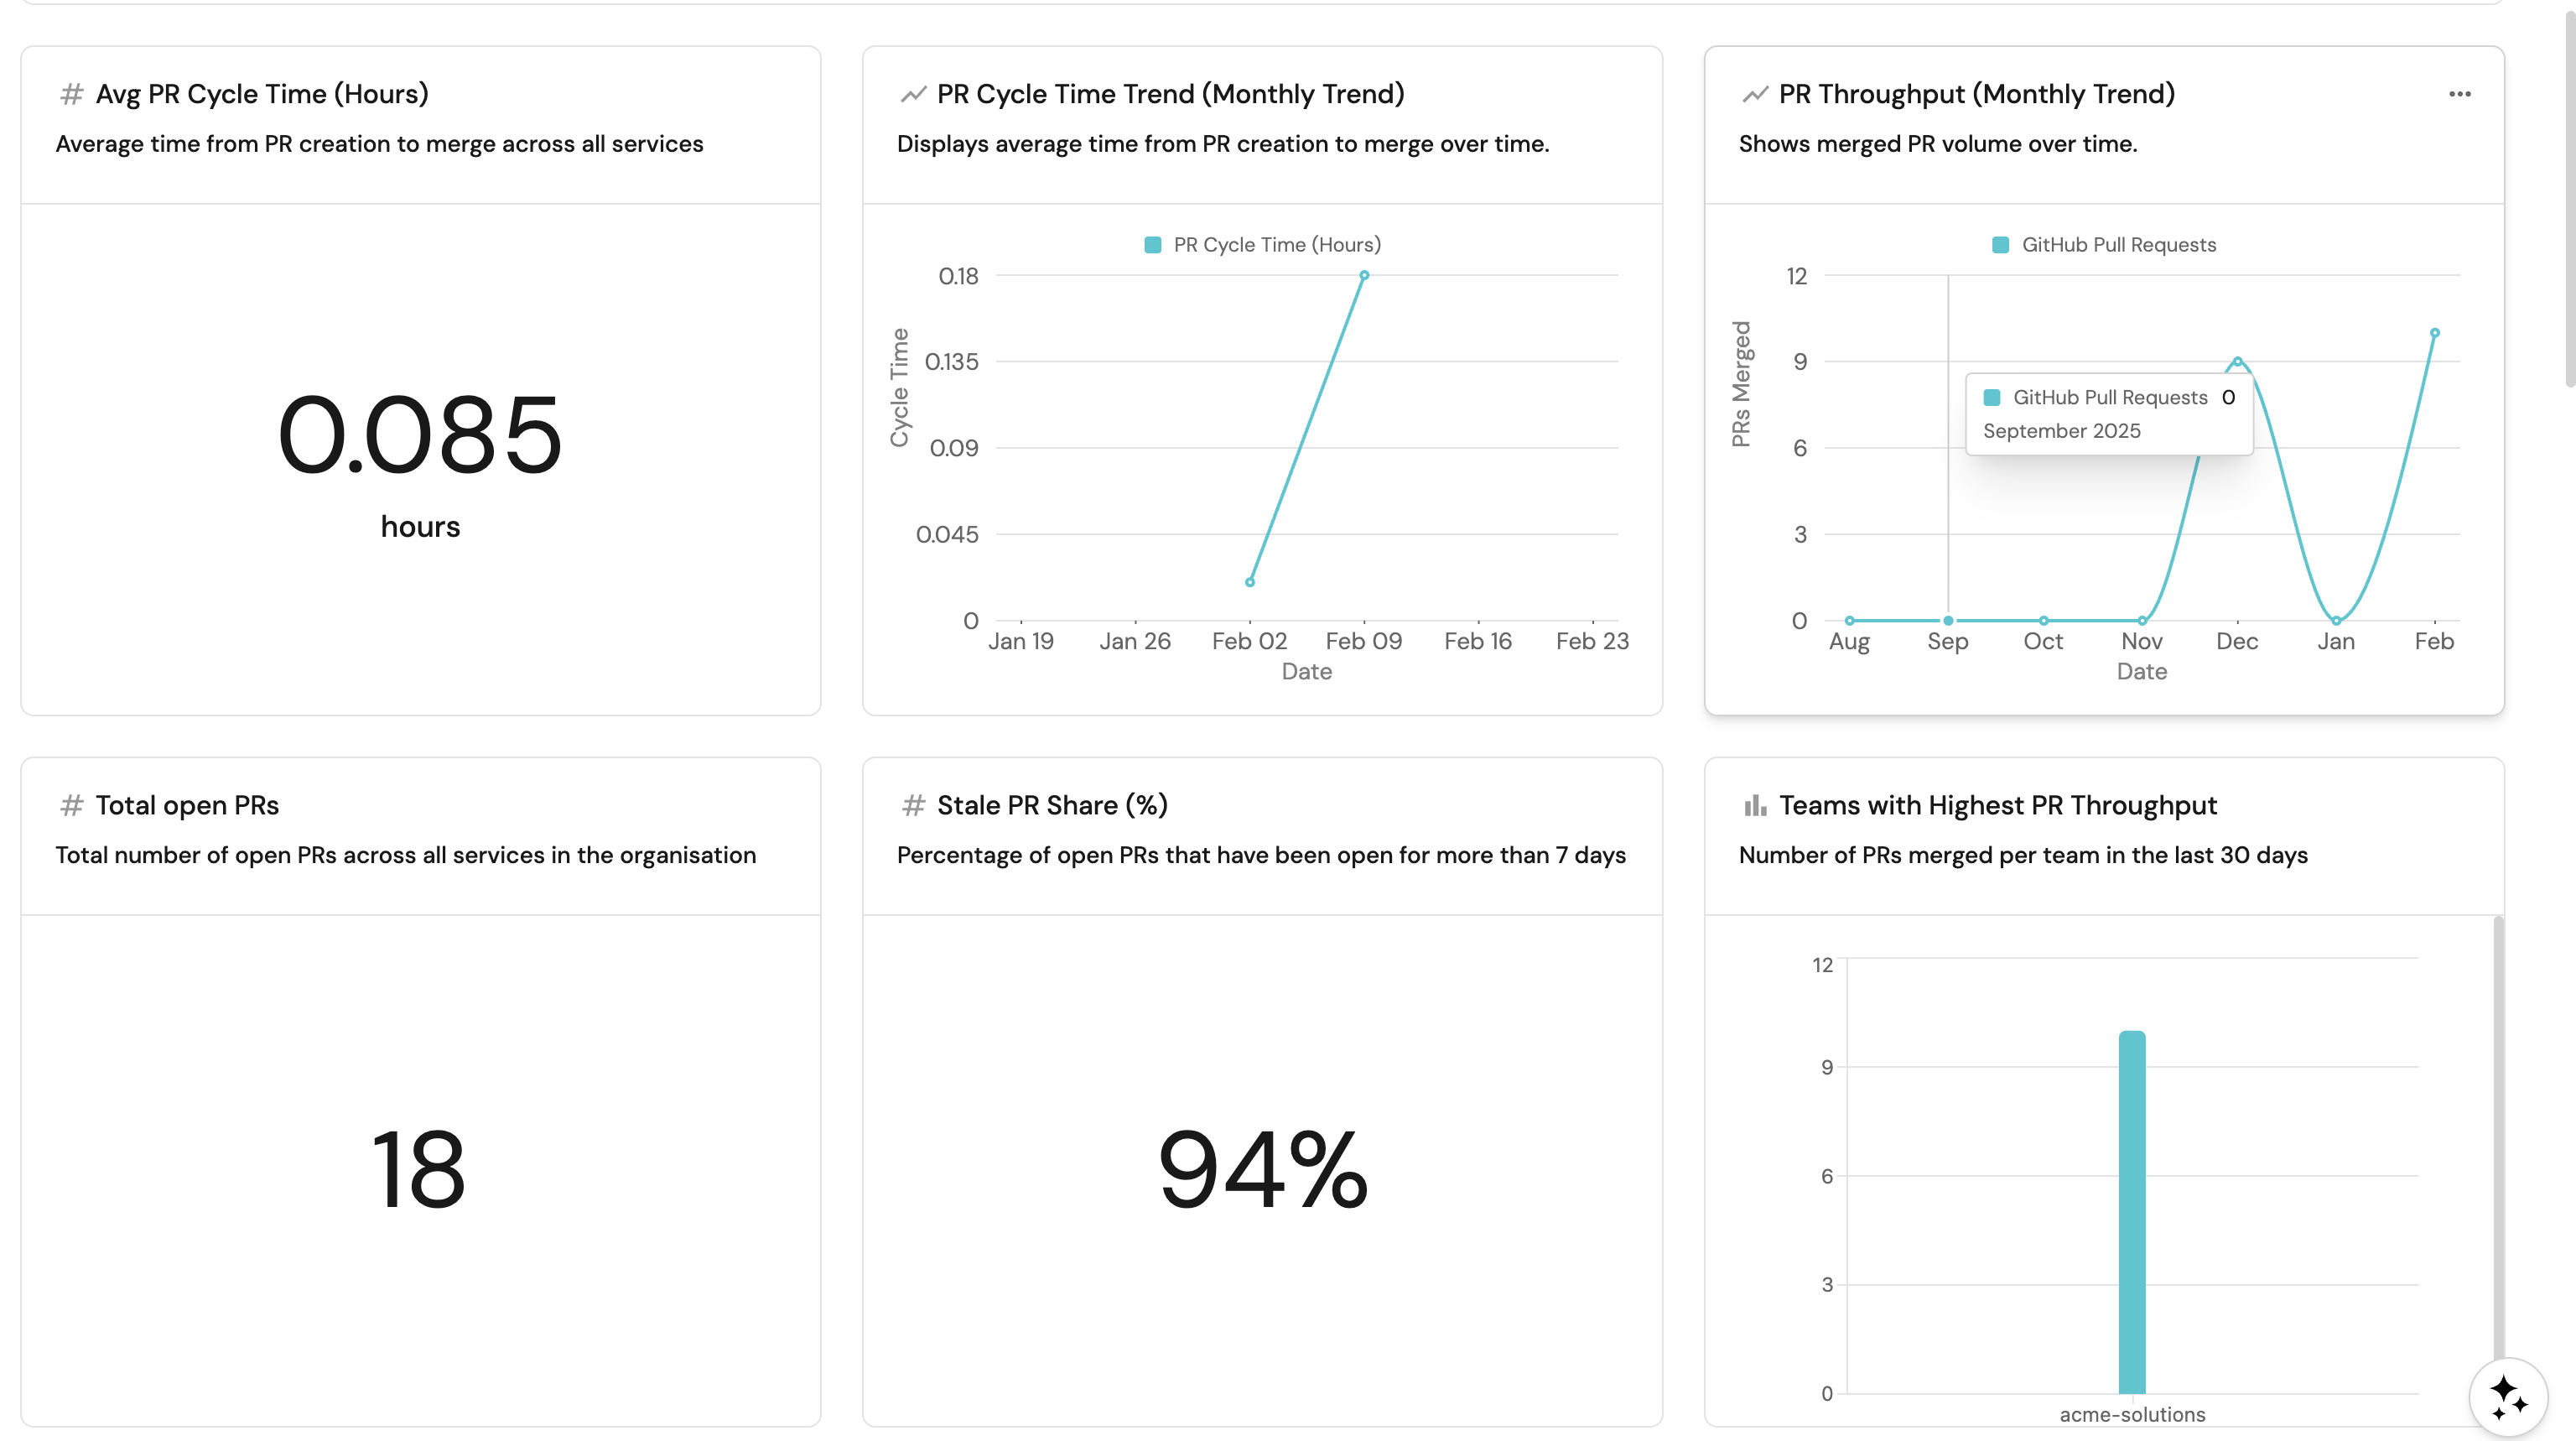
Service performance
Track delivery metrics at the individual service level using a table that aggregates key PR metrics per service.Service performance overview (click to expand)
+ Widget and select Table.Service Performance Overview.Delivery metrics across services.... button in the top right corner of the table and select Customize table.
team relation).github_pr_cycle_time): Average cycle time across PRs in the last month.github_cycle_time_trend): Sparkline showing cycle time direction.github_merged_prs_last_month): Number of PRs merged in the last 30 days.github_throughput_trend): Sparkline showing throughput direction.github_stale_pr_share_percent): Percentage of open PRs that are stale.github_open_prs): Number of currently open PRs.team as the Group by column.
Team and group performance
Aggregate delivery metrics at the team and group level to compare performance across your hierarchy. Click Title: Description: Choose the Team blueprint. Add this JSON to the Initial filters editor to show only teams (not groups): Click Save. Click on the In the top right corner of the table, click on Manage Properties and add the following columns: Click on the save icon in the top right corner of the widget to save the customized table. Click Title: Description: Choose the Team blueprint. Add this JSON to the Initial filters editor to show only groups: Click Save. Click on the Add the same columns as Team Performance above. Click on the save icon in the top right corner of the widget to save the customized table.Team performance (click to expand)
+ Widget and select Table.Team Performance.Delivery metrics aggregated per team.... button in the top right corner of the table and select Customize table.
github_stale_pr_share_percent): Percentage of open PRs that are stale.services_count): Number of services owned by the team.github_open_prs): Number of currently open PRs.github_stale_prs_7d): Number of PRs open longer than 7 days.github_merged_prs_last_month): Number of PRs merged in the last 30 days.github_throughput_trend): Whether throughput is improving, degrading, or stable.github_pr_cycle_time): Average PR cycle time for the last month.github_cycle_time_trend): Whether cycle time is improving, degrading, or stable.Group performance (click to expand)
+ Widget and select Table.Group Performance.Delivery metrics aggregated per group.... button in the top right corner of the table and select Customize table.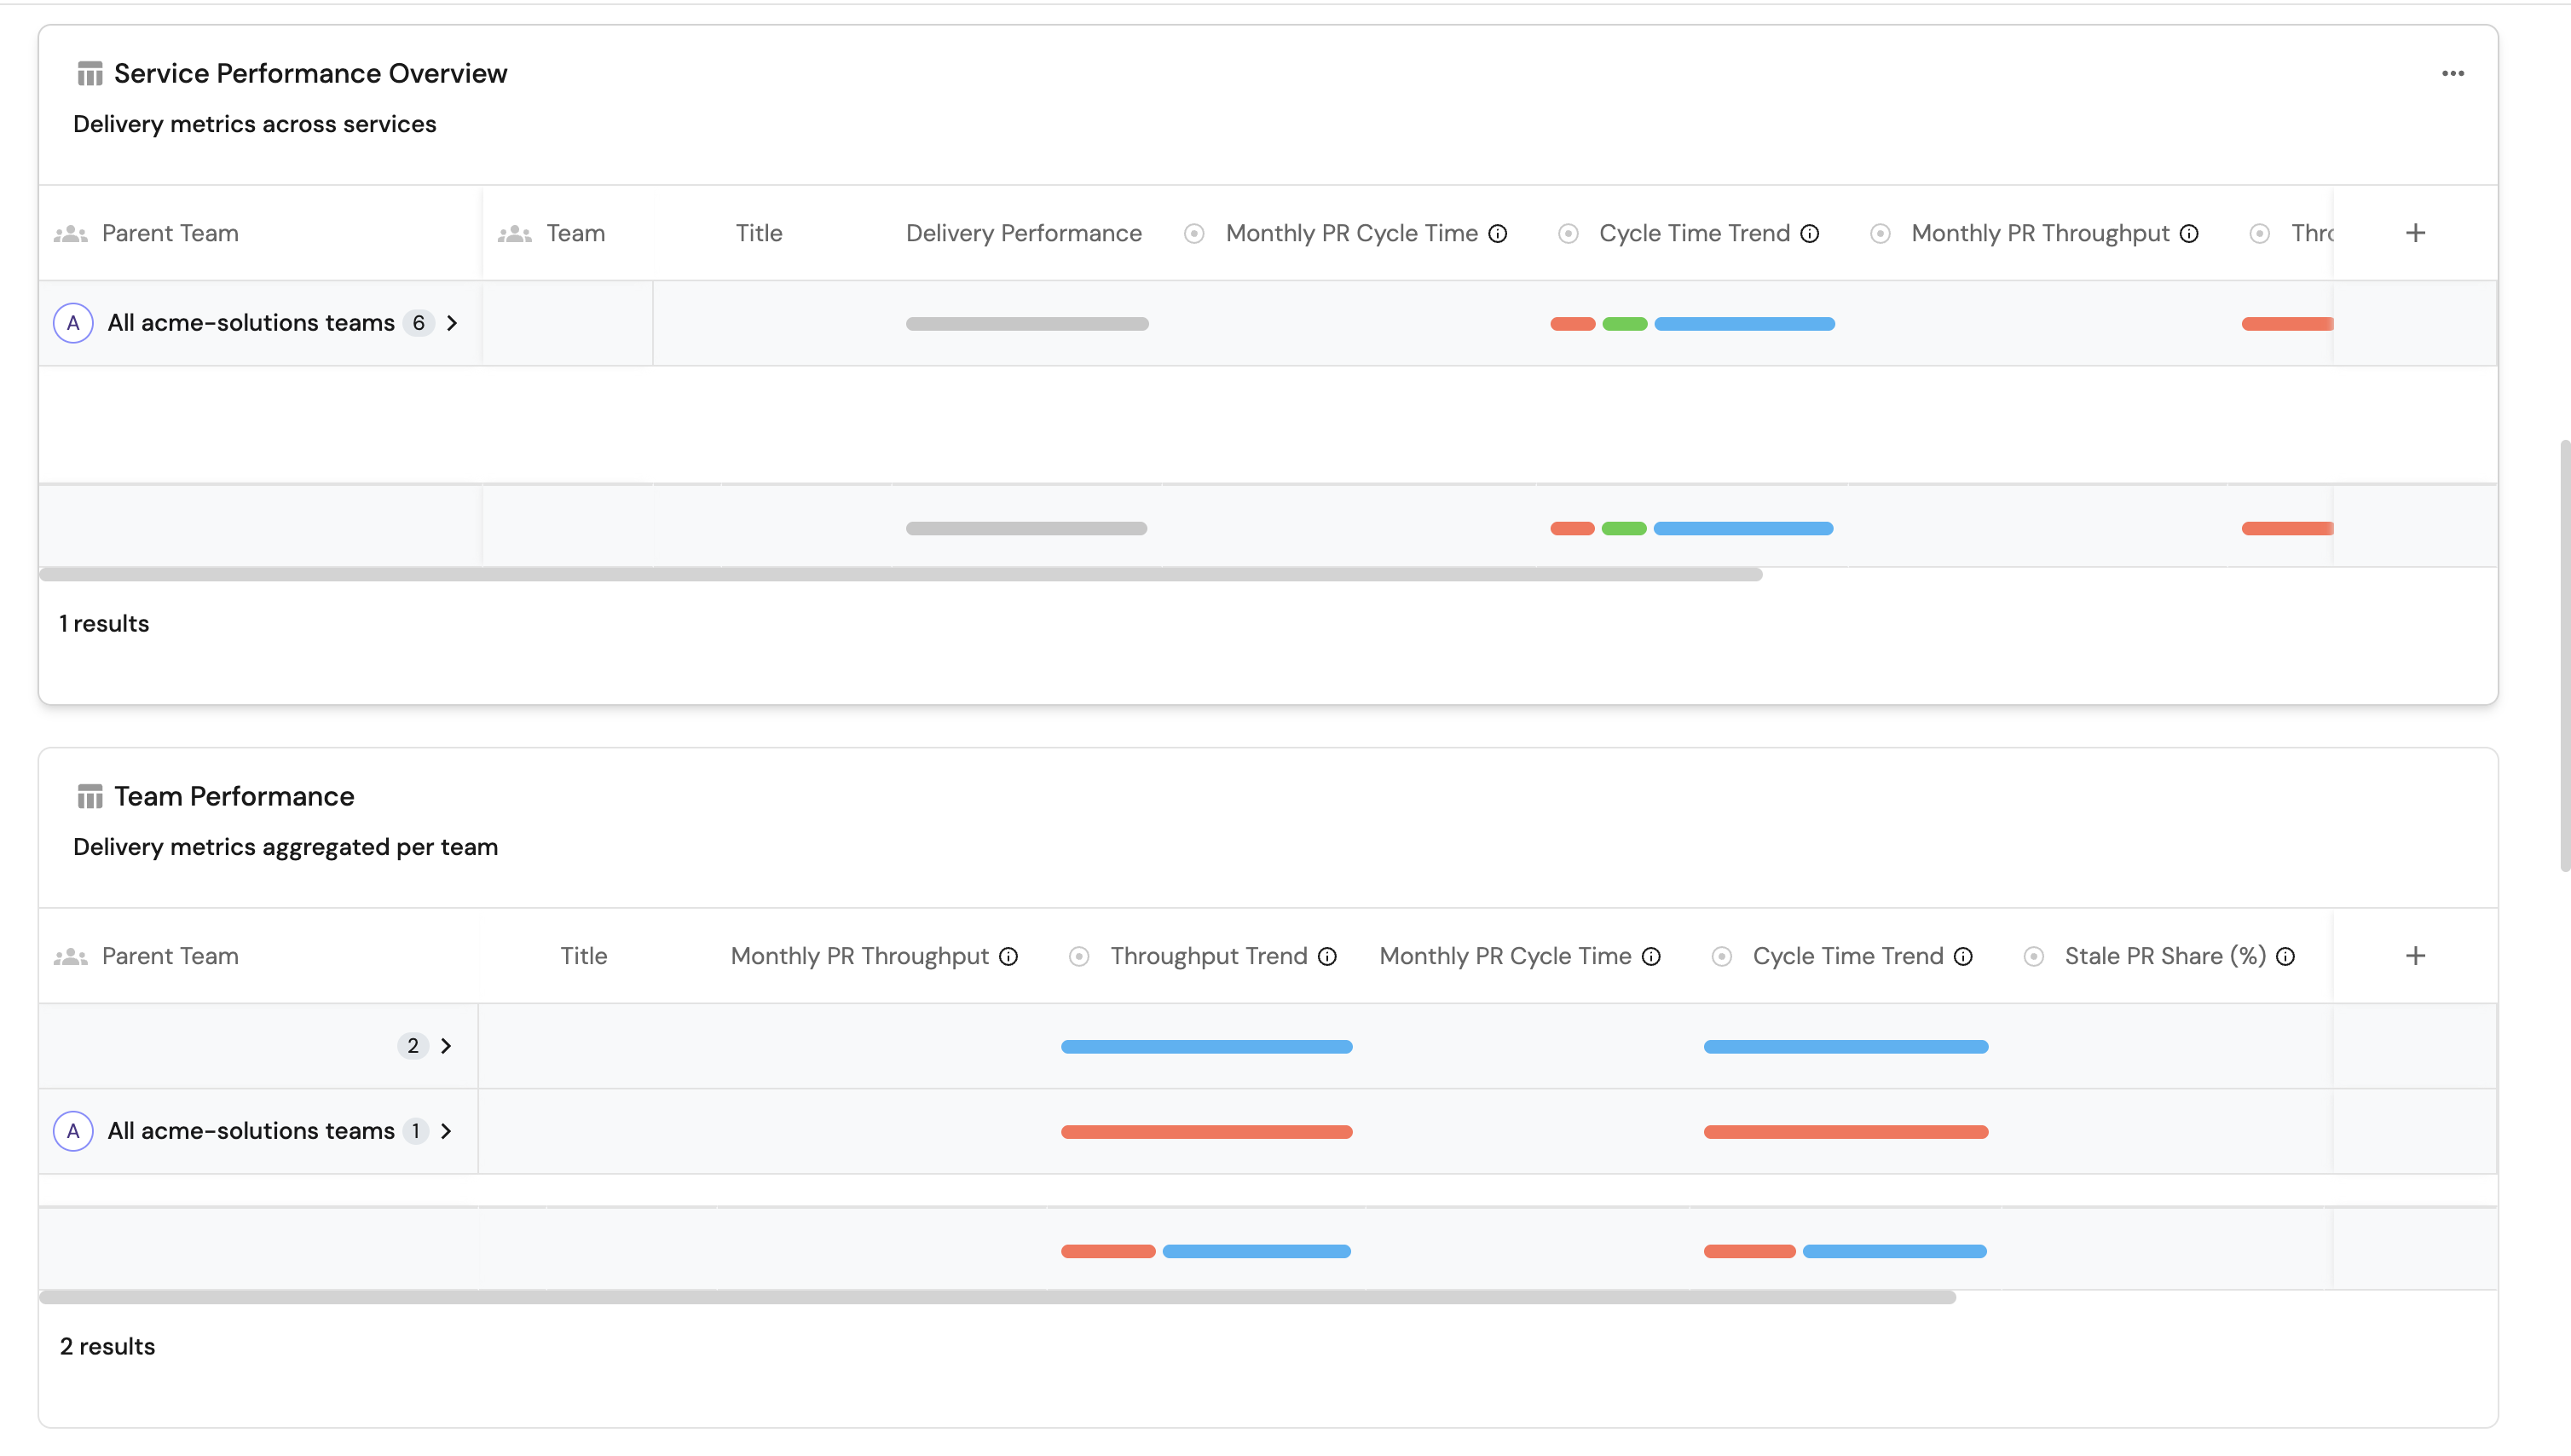
Stale PR analysis
Surface PRs that have been open too long and understand the age distribution across your organization. Click Title: Description: Choose the GitHub Pull Request blueprint. Under Breakdown by property, select the Add this JSON to the Additional filters editor: Click Save.Stale pull requests table (click to expand)
+ Widget and select Table.Stale Pull Requests.Pull requests that have been open for more than 7 days.... button in the top right corner of the table and select Customize table.
service as the Group by column.is_stale property and set the operator to = and the value to true.PR age distribution (click to expand)
+ Widget and select Pie chart.PR Age Distribution.PRs opened for: 0-3 days | 3-7 days | 7-30 days | >30 days.PR Age property.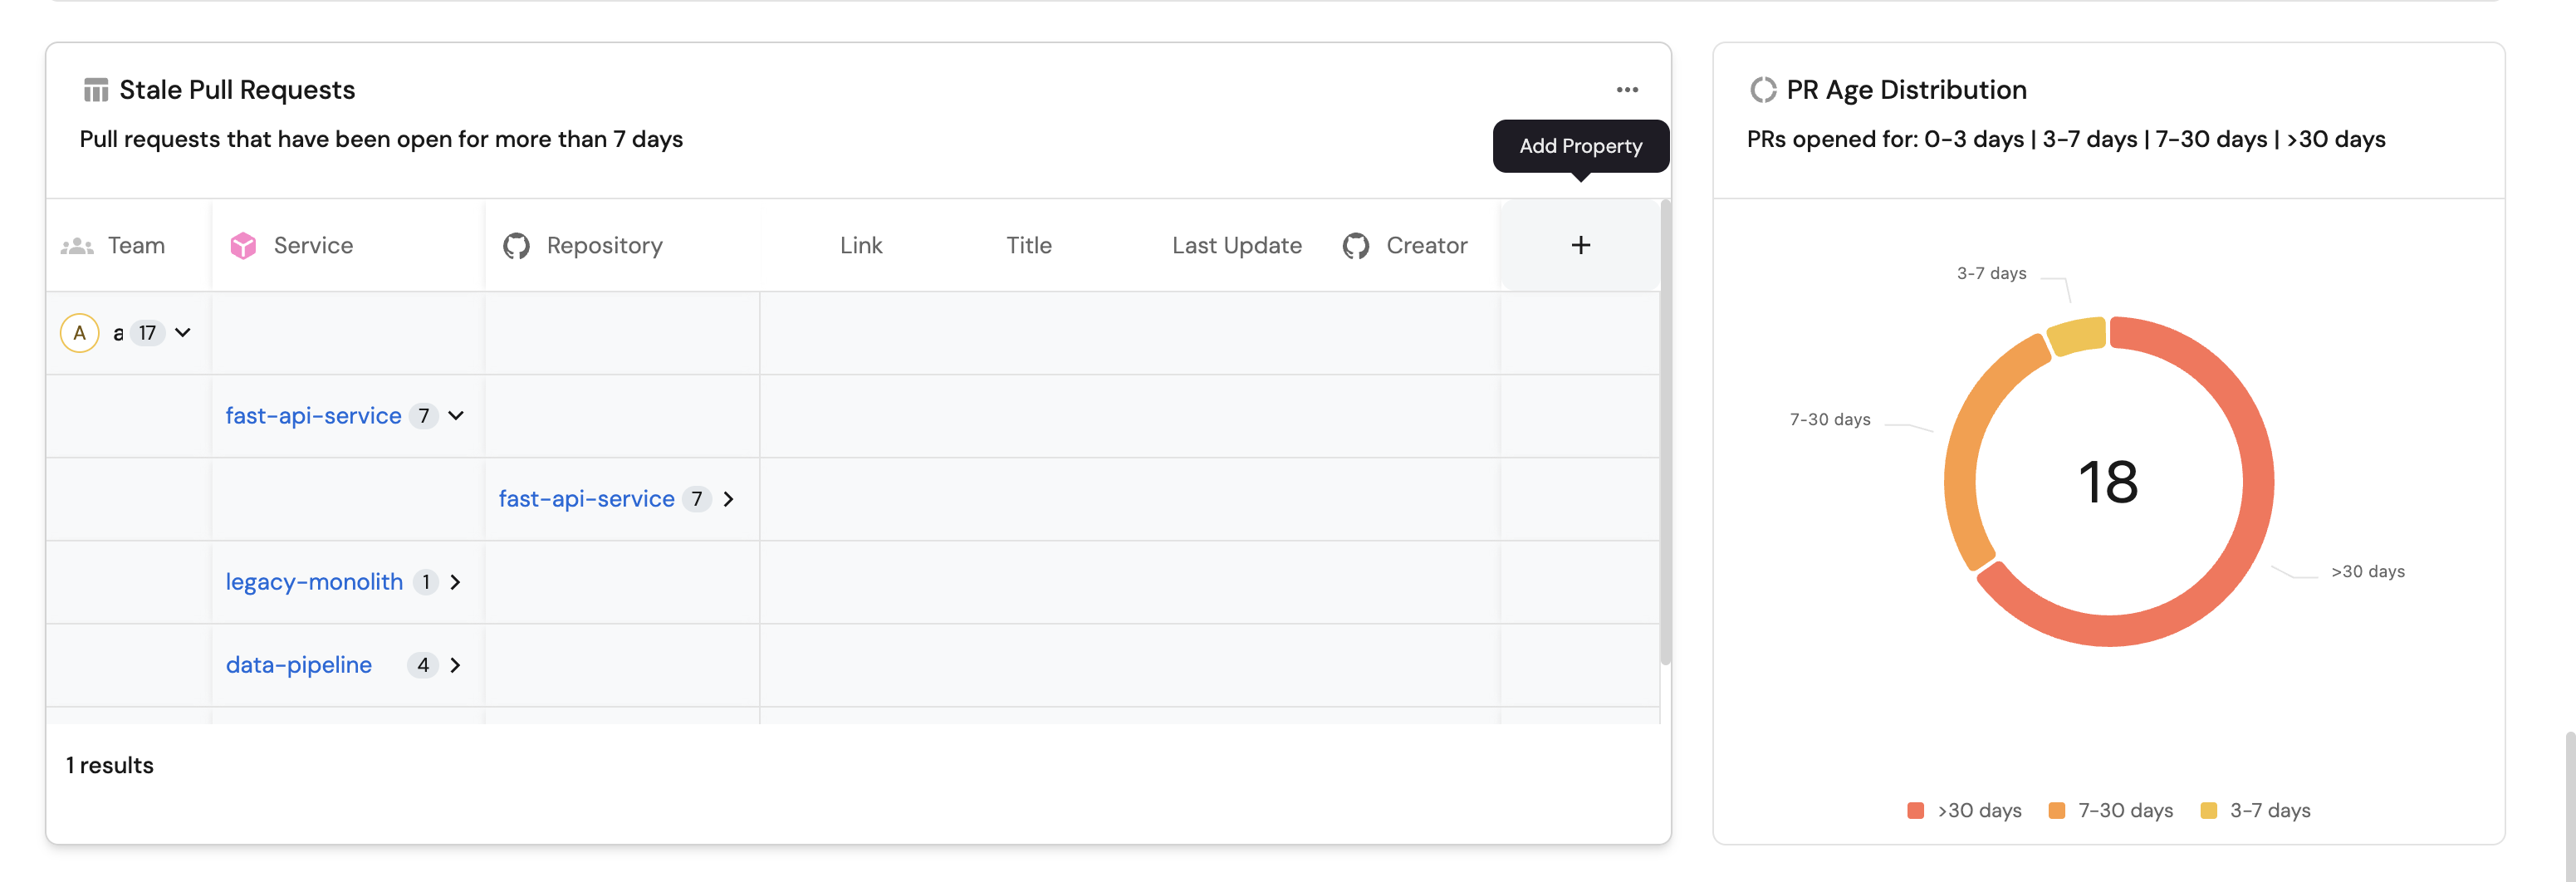
PR quality indicators
Track whether open PRs have proper reviewer and assignee coverage, which are key indicators of process health. Click Title: Description: Choose the GitHub Pull Request blueprint. Add this JSON to the Initial filters editor: Click Save. Click on the In the top right corner of the table, click on Manage Properties and add the following columns: Select Click on the save icon in the top right corner of the widget to save the customized table. Click Title: Description: Choose the GitHub Pull Request blueprint. Under Breakdown by property, select the Add this JSON to the Additional filters editor: Click Save. Click Title: Description: Choose the GitHub Pull Request blueprint. Add this JSON to the Initial filters editor: Click Save. Click on the In the top right corner of the table, click on Manage Properties and add the following columns: Select Click on the save icon in the top right corner of the widget to save the customized table. Click Title: Description: Choose the GitHub Pull Request blueprint. Under Breakdown by property, select the Add this JSON to the Additional filters editor: Click Save. Click Title: Description: Choose the GitHub Pull Request blueprint. Add this JSON to the Initial filters editor: Click Save. Click on the In the top right corner of the table, click on Manage Properties and add the following columns: Select Click on the save icon in the top right corner of the widget to save the customized table.PRs without assigned reviewers (click to expand)
+ Widget and select Table.PRs Without Assigned Reviewers.Lists pull requests that currently have no reviewers assigned.... button in the top right corner of the table and select Customize table.
service as the Group by column.Open PR reviewer coverage (click to expand)
+ Widget and select Pie chart.Open PR Reviewer Coverage.Shows Open PRs with and without assigned reviewers.has_reviewers property.PRs without assignees (click to expand)
+ Widget and select Table.PRs Without Assignees.Lists pull requests that currently have no assignees assigned.... button in the top right corner of the table and select Customize table.
service as the Group by column.Open PR assignment coverage (click to expand)
+ Widget and select Pie chart.Open PR Assignment Coverage.Shows open PRs with and without assigned owners.has_assignees property.All open pull requests (click to expand)
+ Widget and select Table.All Open Pull Requests.All currently open pull requests across repositories.... button in the top right corner of the table and select Customize table.
days_old): How many days the PR has been open.has_assignees): Whether the PR has assignees.has_reviewers): Whether the PR has reviewers.is_stale): Whether the PR has been open for more than 7 days.service as the Group by column.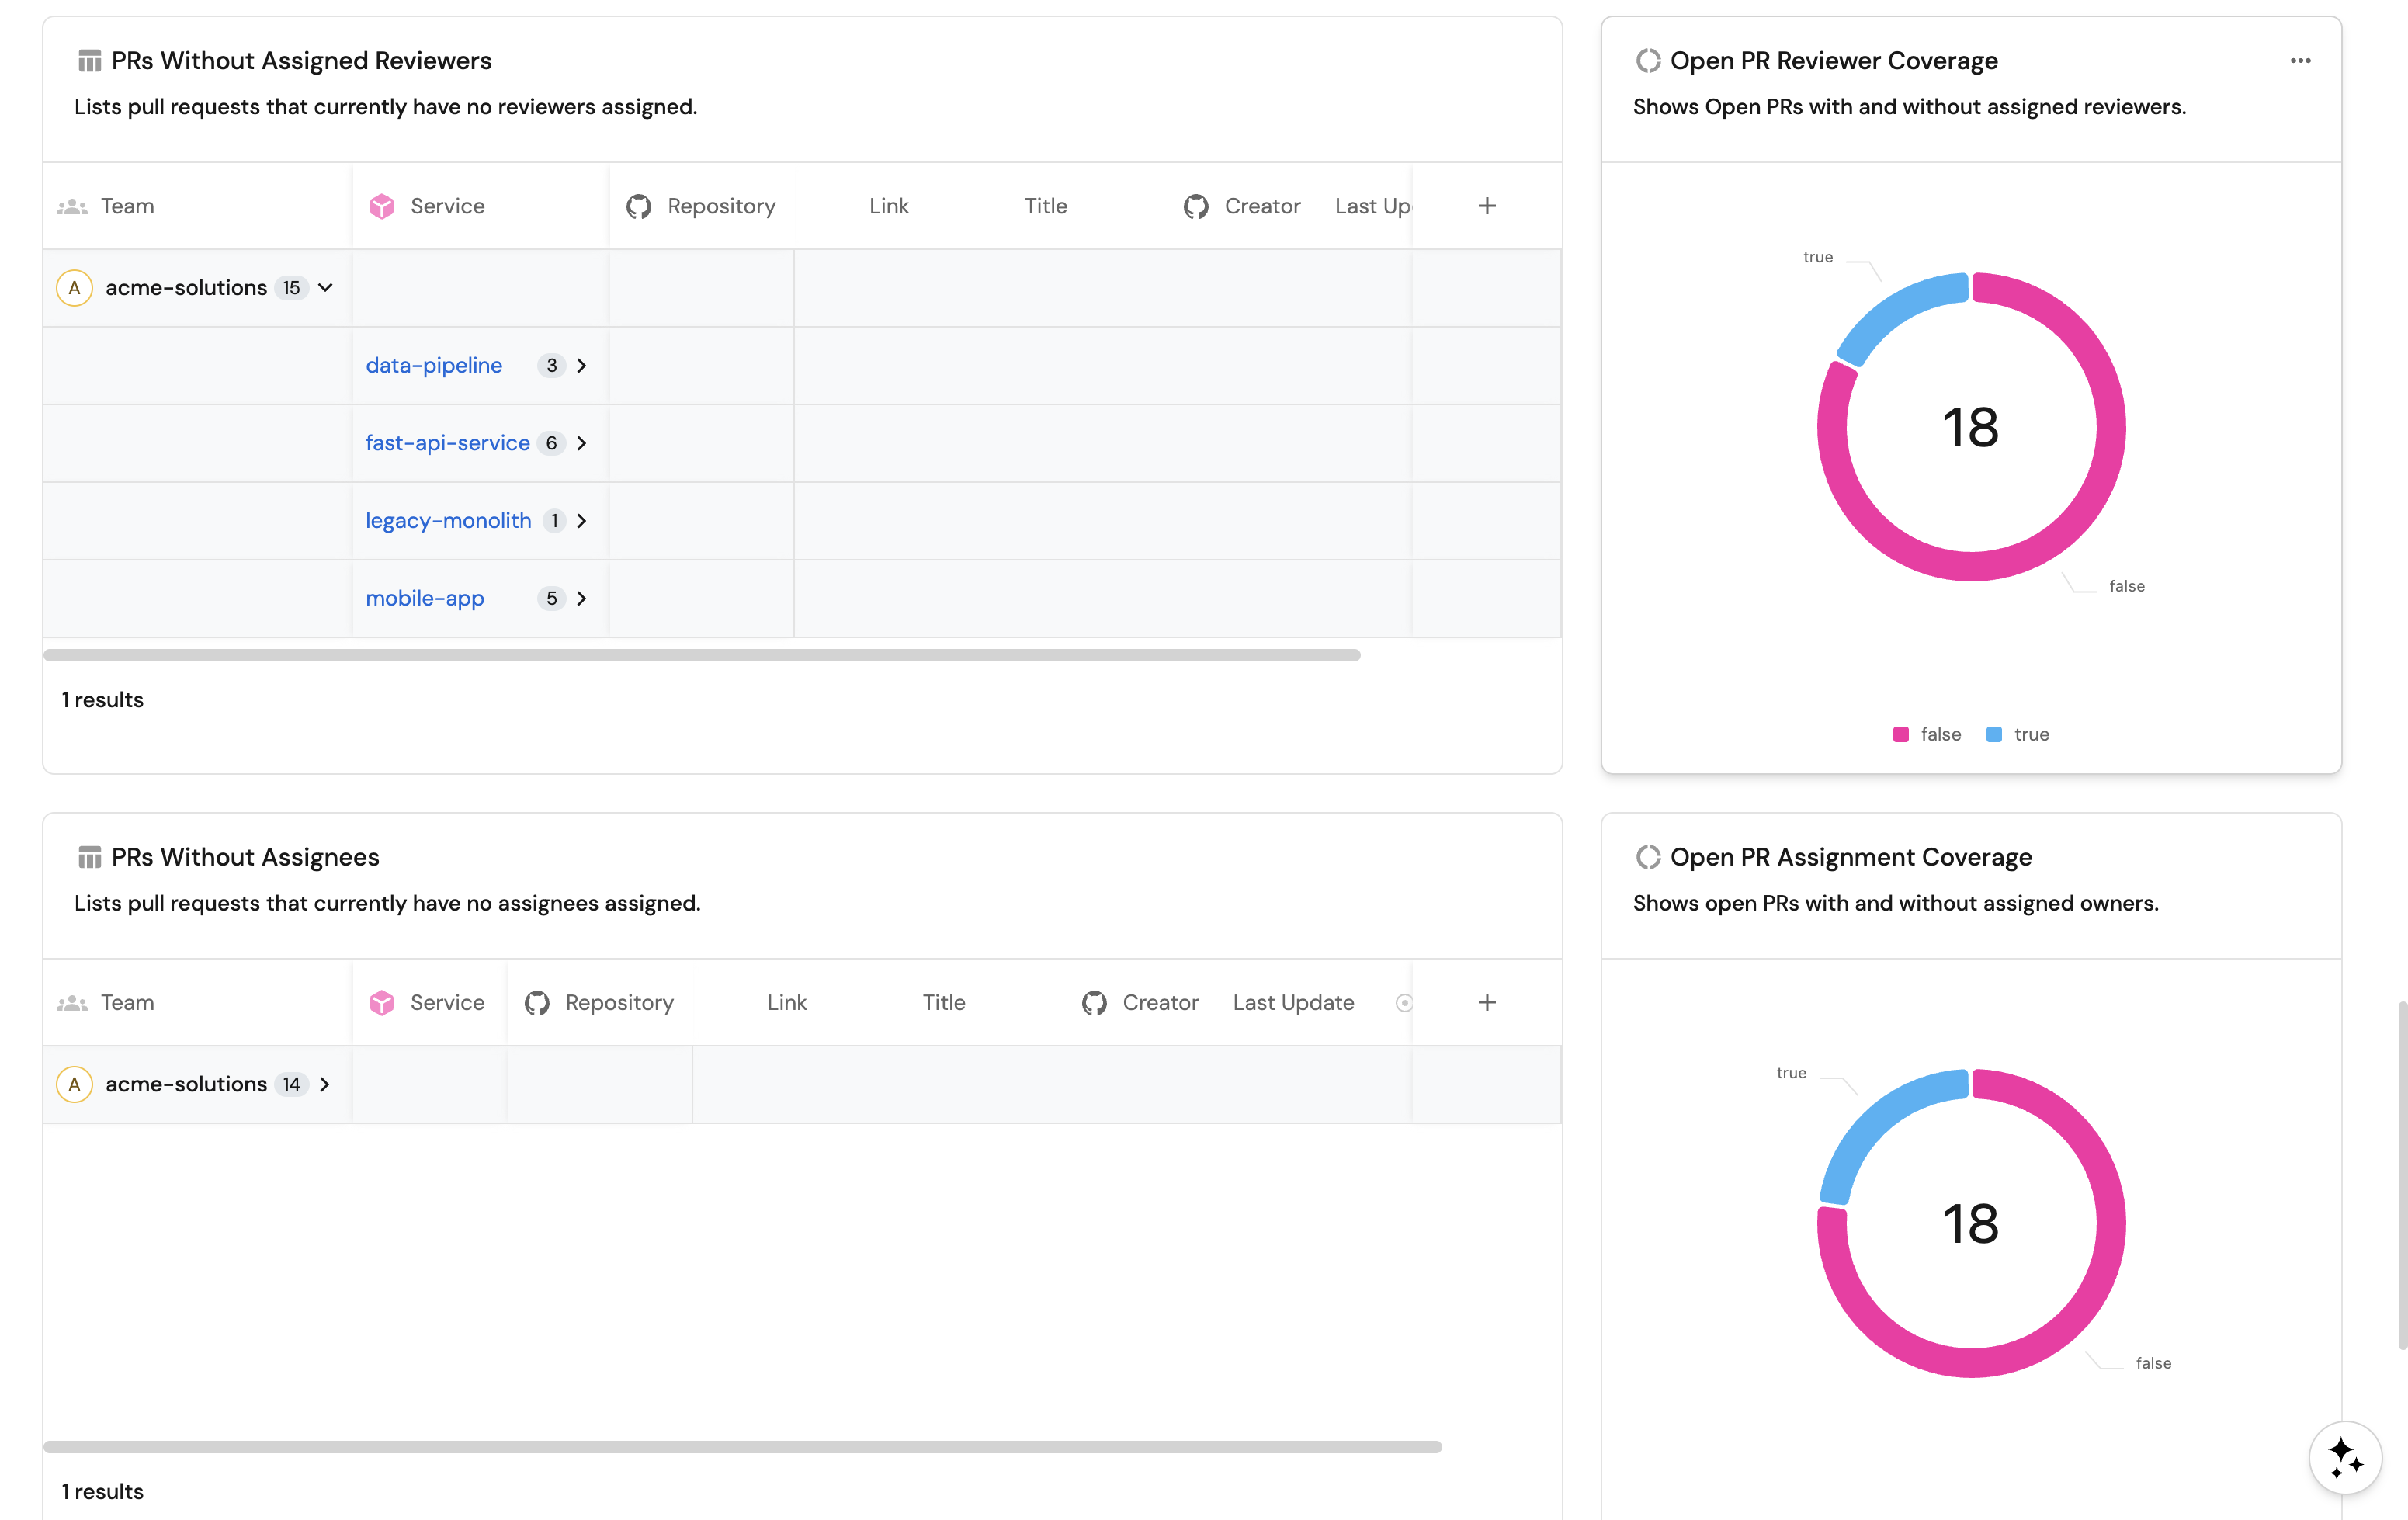
You can populate the dashboard using either an API script or by manually creating each widget through the UI.
- API script
- Manual setup
The fastest way to set up the dashboard is by using Port's API to create all widgets at once.
Get your Port API token
-
In your Port portal, click on your profile picture in the top right corner.
-
Select Credentials.
-
Click Generate API token.
-
Copy the generated token and store it as an environment variable:
export PORT_ACCESS_TOKEN="YOUR_GENERATED_TOKEN"
If your portal is hosted in the EU region, replace api.port.io with api.port-eu.io in the dashboard creation command below.
Create the dashboard with widgets
Save the following JSON to a file named dp_dashboard.json:Dashboard JSON payload (click to expand)
Then run the following command to create the dashboard with all widgets:
curl -s -X POST "https://api.port.io/v1/pages" \
  -H "Authorization: Bearer $PORT_ACCESS_TOKEN" \
  -H "Content-Type: application/json" \
  -d @dp_dashboard.json | python3 -m json.tool
The script assumes an engineering_intelligence folder already exists in your catalog. If you haven't created it yet, follow steps 1-4 in the create the dashboard section first, otherwise you will run into an error when you run the script.
High-level MR metrics
Start with summary widgets that give an at-a-glance view of MR delivery health. Click Title: Description: Select Select Select Select Add this JSON to the Additional filters editor: Select Click Save. Click Title: Description: Select Select Add this JSON to the Dataset filter editor: Click Save. Click Title: Description: Select GitLab Merge Request as the Blueprint. Select Add this JSON to the Additional filters editor: Click Save.Avg MR cycle time (hours) (click to expand)
+ Widget and select Number Chart.Avg MR Cycle Time (Hours).Average time from MR creation to merge across all services.Aggregate Property (All Entities) Chart type and choose GitLab Merge Request as the Blueprint.cycle_time_hours as the Property.average for the Function.total for Average of.custom as the Unit and input hours as the Custom unit.MR cycle time trend (monthly) (click to expand)
+ Widget and select Line Chart.MR Cycle Time Trend (Monthly Trend). Description: Displays average time from MR creation to merge over time.
Date.Week.In the past 30 days.Cycle Time.
MR cycle time.Aggregate property values.GitLab Merge Request.average.MR cycle time (hours).mergedAt.MR throughput (monthly trend) (click to expand)
+ Widget and select Line Chart.MR Throughput (Monthly Trend). Description: Shows merged MR volume over time.
Date.month.In the past 180 days.MRs Merged.
Merged MRs.Count entities.GitLab Merge Request.count.mergedAt.Total open MRs (click to expand)
+ Widget and select Number Chart.Total Open MRs.Total number of open MRs across all services in the organisation.Count entities Chart type and choose GitLab Merge Request as the Blueprint.count for the Function.Stale MR share (%) (click to expand)
+ Widget and select Number Chart.Stale MR Share (%).Percentage of open MRs that have been open for more than 7 days.Display Single Property Chart type and choose Organization as the Blueprint.Stale MR Share (%) (gitlab_stale_mr_share_percent) as the Property.Teams with highest MR throughput (click to expand)
+ Widget and select Bar Chart.Teams with Highest MR Throughput.Number of MRs merged per team in the last 30 days.Team as the Breakdown by property.
Service performance
Service performance overview (click to expand)
- Click
+ Widgetand select Table. - Title:
Service Performance Overview. - Description:
Delivery metrics across services. - Choose the Service blueprint.
- Click Save.
- Click on the
...button in the top right corner of the table and select Customize table. - In the top right corner of the table, click on Manage Properties and add the following columns:
- Team: The team that owns the service (
teamrelation). - Title: The service name.
- Delivery Performance: The delivery performance scorecard level.
- Monthly MR Cycle Time (
gitlab_mr_cycle_time): Average cycle time across MRs in the last month. - Cycle Time Trend (
gitlab_cycle_time_trend): Whether cycle time is improving, degrading, or stable. - Monthly MR Throughput (
gitlab_merged_mrs_last_month): Number of MRs merged in the last 30 days. - Throughput Trend (
gitlab_throughput_trend): Whether throughput is improving, degrading, or stable. - Stale MR Share (%) (
gitlab_stale_mr_share_percent): Percentage of open MRs that are stale. - Open MRs (
gitlab_open_mrs): Number of currently open MRs.
- Team: The team that owns the service (
- Select
teamas the Group by column. - Click on the save icon in the top right corner of the widget to save the customized table.
Team and group performance
Team performance (click to expand)
-
Click
+ Widgetand select Table. -
Title:
Team Performance. -
Description:
Delivery metrics aggregated per team. -
Choose the Team blueprint.
-
Add this JSON to the Initial filters editor to show only teams (not groups):
{"combinator": "and","rules": [{"property": "type","operator": "=","value": "team"}]} -
Click Save.
-
Click on the
...button in the top right corner of the table and select Customize table. -
In the top right corner of the table, click on Manage Properties and add the following columns:
- Title: The team name.
- Monthly MR Throughput (
gitlab_merged_mrs_last_month): Number of MRs merged in the last 30 days. - Throughput Trend (
gitlab_throughput_trend): Whether throughput is improving, degrading, or stable. - Monthly MR Cycle Time (
gitlab_mr_cycle_time): Average MR cycle time for the last month. - Cycle Time Trend (
gitlab_cycle_time_trend): Whether cycle time is improving, degrading, or stable. - Stale MR Share (%) (
gitlab_stale_mr_share_percent): Percentage of open MRs that are stale. - Open MRs (
gitlab_open_mrs): Number of currently open MRs. - Stale MRs (7d+) (
gitlab_stale_mrs_7d): Number of MRs open longer than 7 days. - Number of Services (
services_count): Number of services owned by the team.
-
Click on the save icon in the top right corner of the widget to save the customized table.
Group performance (click to expand)
-
Click
+ Widgetand select Table. -
Title:
Group Performance. -
Description:
Delivery metrics aggregated per group. -
Choose the Team blueprint.
-
Add this JSON to the Initial filters editor to show only groups:
{"combinator": "and","rules": [{"property": "type","operator": "=","value": "group"}]} -
Click Save.
-
Click on the
...button in the top right corner of the table and select Customize table. -
Add the same columns as Team Performance above.
-
Click on the save icon in the top right corner of the widget to save the customized table.
Stale MR analysis
Stale merge requests table (click to expand)
- Click
+ Widgetand select Table. - Title:
Stale Merge Requests. - Description:
Merge requests that have been open for more than 7 days. - Choose the GitLab Merge Request blueprint.
- Click Save.
- Click on the
...button in the top right corner of the table and select Customize table. - In the top right corner of the table, click on Manage Properties and add the following columns:
- Service: The related service.
- Repository: The related repository.
- Link: The URL to the merge request.
- Title: The MR title.
- Last Update: The last updated date.
- Creator: The MR creator.
- Select
serviceas the Group by column. - On the filter section, select the
is_staleproperty and set the operator to=and the value totrue. - Click on the save icon in the top right corner of the widget to save the customized table.
MR age distribution (click to expand)
-
Click
+ Widgetand select Pie chart. -
Title:
MR Age Distribution. -
Description:
MRs opened for: 0-3 days | 3-7 days | 7-30 days | >30 days. -
Choose the GitLab Merge Request blueprint.
-
Under Breakdown by property, select the
MR Age Labelproperty. -
Add this JSON to the Additional filters editor:
{"combinator": "and","rules": [{"property": "status","operator": "=","value": "opened"}]} -
Click Save.
MR quality indicators
MRs without assigned reviewers (click to expand)
-
Click
+ Widgetand select Table. -
Title:
MRs Without Assigned Reviewers. -
Description:
Lists merge requests that currently have no reviewers assigned. -
Choose the GitLab Merge Request blueprint.
-
Add this JSON to the Initial filters editor:
{"combinator": "and","rules": [{"property": "status","operator": "=","value": "opened"},{"property": "has_reviewers","operator": "=","value": false}]} -
Click Save.
-
Click on the
...button in the top right corner of the table and select Customize table. -
In the top right corner of the table, click on Manage Properties and add the following columns:
- Service: The related service.
- Repository: The related repository.
- Link: The URL to the merge request.
- Title: The MR title.
- Creator: The MR creator.
- Last Update: The last updated date.
-
Select
serviceas the Group by column. -
Click on the save icon in the top right corner of the widget to save the customized table.
MRs without assignees (click to expand)
-
Click
+ Widgetand select Table. -
Title:
MRs Without Assignees. -
Description:
Lists merge requests that currently have no assignees assigned. -
Choose the GitLab Merge Request blueprint.
-
Add this JSON to the Initial filters editor:
{"combinator": "and","rules": [{"property": "status","operator": "=","value": "opened"},{"property": "has_assignees","operator": "=","value": false}]} -
Click Save.
-
Click on the
...button in the top right corner of the table and select Customize table. -
In the top right corner of the table, click on Manage Properties and add the following columns:
- Service: The related service.
- Repository: The related repository.
- Link: The URL to the merge request.
- Title: The MR title.
- Creator: The MR creator.
- Last Update: The last updated date.
-
Select
serviceas the Group by column. -
Click on the save icon in the top right corner of the widget to save the customized table.
You can populate the dashboard using either an API script or by manually creating each widget through the UI.
- API script
- Manual setup
The fastest way to set up the dashboard is by using Port's API to create all widgets at once.
Get your Port API token
-
In your Port portal, click on your profile picture in the top right corner.
-
Select Credentials.
-
Click Generate API token.
-
Copy the generated token and store it as an environment variable:
export PORT_ACCESS_TOKEN="YOUR_GENERATED_TOKEN"
If your portal is hosted in the EU region, replace api.port.io with api.port-eu.io in the dashboard creation command below.
Create the dashboard with widgets
Save the following JSON to a file named dp_dashboard_ado.json:Dashboard JSON payload (click to expand)
Then run the following command to create the dashboard with all widgets:
curl -s -X POST "https://api.port.io/v1/pages" \
  -H "Authorization: Bearer $PORT_ACCESS_TOKEN" \
  -H "Content-Type: application/json" \
  -d @dp_dashboard_ado.json | python3 -m json.tool
The script assumes an engineering_intelligence folder already exists in your catalog. If you haven't created it yet, follow step 1-4 in the create the dashboard section first else you will run into an error when you run the script
High-level PR metrics
Start with summary widgets that give an at-a-glance view of PR delivery health. Click Title: Description: Select Select Select Select Add this JSON to the Additional filters editor: Select Click Save. Click Title: Set X axis: Set Y axis title: Click + Line and configure: Title: Chart type: Blueprint: Function: Property: Measure time by: Add this JSON to the Additional filters editor to include only completed PRs: Click Save. Click Title: Set X axis: Set Y axis title: Click + Line and configure: Title: Chart type: Blueprint: Function: Measure time by: Add this JSON to the Additional filters editor: Click Save. Click Title: Description: Select Add this JSON to the Additional filters editor: Click Save. Click Title: Description: Choose the Azure Pull Request blueprint. Under Breakdown by property, select Add this JSON to the Additional filters editor: Click Save.Avg PR cycle time (hours) (click to expand)
+ Widget and select Number Chart.Avg PR Cycle Time (Hours).Average time from PR creation to completion across all services.Aggregate Property (All Entities) Chart type and choose Azure Pull Request as the Blueprint.cycle_time_hours as the Property.average for the Function.total for Average of.custom as the Unit and input hours as the Custom unit.PR cycle time trend (monthly) (click to expand)
+ Widget and select Line Chart.PR Cycle Time Trend (Monthly Trend). Description: Displays average time from PR creation to completion over time.
Date.Week.In the past 30 days.Cycle Time.
PR cycle time.Aggregate property values.Azure Pull Request.average.PR Cycle Time (Hours).$createdAt.PR throughput (monthly trend) (click to expand)
+ Widget and select Line Chart.PR Throughput (Monthly Trend). Description: Shows completed PR volume over time.
Date.Month.In the past 6 months.PRs Completed.
Completed PRs.Count entities.Azure Pull Request.count.$createdAt.Total open PRs (click to expand)
+ Widget and select Number Chart.Total Open PRs.Total number of active PRs across all services in the organisation.Count Entities (All Entities) Chart type and choose Azure Pull Request as the Blueprint.Stale PR share (%) (click to expand)
+ Widget and select Number Chart.Stale PR Share (%).Percentage of open PRs that have been open for more than 7 days.Aggregate Property (All Entities) Chart type and choose Team as the Blueprint.ado_stale_pr_share_percent as the Property.average for the Function and total for Average of.Teams with highest PR throughput (click to expand)
+ Widget and select Bar Chart.Teams with Highest PR Throughput.Number of PRs completed per team in the last 30 days.Owning Teams.
Service and team performance
Service performance overview (click to expand)
- Click
+ Widgetand select Table. - Title:
Service Performance Overview. - Description:
Delivery metrics across services. - Choose the Service blueprint.
- Click Save.
- Click on the
...button in the top right corner of the table and select Customize table. - In the top right corner of the table, click on Manage Properties and add the following columns:
- Delivery Performance (
delivery_performance): Scorecard result. - Monthly PR Cycle Time (
ado_pr_cycle_time): Average cycle time last month. - PR Cycle Time Trend (
ado_cycle_time_trend): Weekly vs monthly cycle time. - Monthly PR Throughput (
ado_merged_prs_last_month): PRs completed last month. - PR Throughput Trend (
ado_throughput_trend): Weekly vs monthly throughput. - Stale PR Share (%) (
ado_stale_pr_share_percent): Percentage of stale open PRs. - Open PRs (
ado_open_prs): Currently active PRs. - Stale PRs (7d+) (
ado_stale_prs_7d): PRs open longer than 7 days.
- Delivery Performance (
- Select
teamas the Group by column. - Click on the save icon in the top right corner of the widget to save the customized table.
Team performance (click to expand)
-
Click
+ Widgetand select Table. -
Title:
Team Performance. -
Description:
Delivery metrics aggregated per team. -
Choose the Team blueprint.
-
Add this JSON to the Initial filters editor to show only teams:
{"combinator": "and","rules": [{"property": "type","operator": "=","value": "team"}]} -
Click Save.
-
Click on the
...button in the top right corner of the table and select Customize table. -
In the top right corner of the table, click on Manage Properties and add the following columns:
- Monthly PR Throughput (
ado_merged_prs_last_month): PRs completed last month. - PR Throughput Trend (
ado_throughput_trend): Weekly vs monthly throughput. - Monthly PR Cycle Time (
ado_pr_cycle_time): Average cycle time last month. - PR Cycle Time Trend (
ado_cycle_time_trend): Weekly vs monthly cycle time. - Stale PR Share (%) (
ado_stale_pr_share_percent): Percentage of stale open PRs. - Open PRs (
ado_open_prs): Currently active PRs. - Stale PRs (7d+) (
ado_stale_prs_7d): PRs open longer than 7 days. - Number of Services (
services_count): Number of services owned by the team.
- Monthly PR Throughput (
-
Click on the save icon in the top right corner of the widget to save the customized table.
Group performance (click to expand)
-
Click
+ Widgetand select Table. -
Title:
Group Performance. -
Description:
Delivery metrics aggregated per group. -
Choose the Team blueprint.
-
Add this JSON to the Initial filters editor to show only groups:
{"combinator": "and","rules": [{"property": "type","operator": "=","value": "group"}]} -
Click Save.
-
Click on the
...button in the top right corner of the table and select Customize table. -
Add the same columns as Team Performance above.
-
Click on the save icon in the top right corner of the widget to save the customized table.
Stale PR analysis
Stale pull requests table (click to expand)
- Click
+ Widgetand select Table. - Title:
Stale Pull Requests. - Description:
Pull requests that have been open for more than 7 days. - Choose the Azure Pull Request blueprint.
- Click Save.
- Click on the
...button in the top right corner of the table and select Customize table. - In the top right corner of the table, click on Manage Properties and add the following columns:
- Service: The related service.
- Repository: The related repository.
- Link: The URL to the pull request.
- Title: The PR title.
- Last Update: The last updated date.
- Select
serviceas the Group by column. - On the filter section, select the
is_staleproperty and set the operator to=and the value totrue. - Click on the save icon in the top right corner of the widget to save the customized table.
PR age distribution (click to expand)
-
Click
+ Widgetand select Pie chart. -
Title:
PR Age Distribution. -
Description:
PRs opened for: 0-3 days | 3-7 days | 7-30 days | >30 days. -
Choose the Azure Pull Request blueprint.
-
Under Breakdown by property, select the
PR Ageproperty. -
Add this JSON to the Additional filters editor:
{"combinator": "and","rules": [{"property": "status","operator": "=","value": "active"}]} -
Click Save.
PR quality indicators
PRs without assigned reviewers (click to expand)
-
Click
+ Widgetand select Table. -
Title:
PRs Without Assigned Reviewers. -
Description:
Lists pull requests that currently have no reviewers assigned. -
Choose the Azure Pull Request blueprint.
-
Add this JSON to the Initial filters editor:
{"combinator": "and","rules": [{"property": "status","operator": "=","value": "active"},{"property": "has_reviewers","operator": "=","value": false}]} -
Click Save.
-
Click on the
...button in the top right corner of the table and select Customize table. -
In the top right corner of the table, click on Manage Properties and add the following columns:
- Service: The related service.
- Repository: The related repository.
- Link: The URL to the pull request.
- Title: The PR title.
- Last Update: The last updated date.
-
Select
serviceas the Group by column. -
Click on the save icon in the top right corner of the widget to save the customized table.
Open PR reviewer coverage (click to expand)
-
Click
+ Widgetand select Pie chart. -
Title:
Open PR Reviewer Coverage. -
Description:
Shows open PRs with and without assigned reviewers. -
Choose the Azure Pull Request blueprint.
-
Under Breakdown by property, select the
has_reviewersproperty. -
Add this JSON to the Additional filters editor:
{"combinator": "and","rules": [{"property": "status","operator": "=","value": "active"}]} -
Click Save.
All open pull requests (click to expand)
-
Click
+ Widgetand select Table. -
Title:
All Open Pull Requests. -
Description:
All currently active pull requests across repositories. -
Choose the Azure Pull Request blueprint.
-
Add this JSON to the Initial filters editor:
{"combinator": "and","rules": [{"property": "status","operator": "=","value": "active"}]} -
Click Save.
-
Click on the
...button in the top right corner of the table and select Customize table. -
In the top right corner of the table, click on Manage Properties and add the following columns:
- Service: The related service.
- Repository: The related repository.
- Link: The URL to the pull request.
- Title: The PR title.
- Last Update: The last updated date.
- Days Old (
days_old): How many days the PR has been open. - Has reviewers (
has_reviewers): Whether the PR has reviewers. - Is Stale (7d+) (
is_stale): Whether the PR has been open for more than 7 days.
-
Select
serviceas the Group by column. -
Click on the save icon in the top right corner of the widget to save the customized table.
Next steps
Once your Delivery Performance dashboard is in place, consider these additional improvements:
- Set up scorecards to automatically evaluate services and teams against delivery performance targets.
- Create automations to send Slack notifications when stale PR share exceeds a threshold or when PRs have been open without reviewers for more than 48 hours.
- Add an AI agent to provide natural language insights into your delivery data.