Measure pipeline reliability
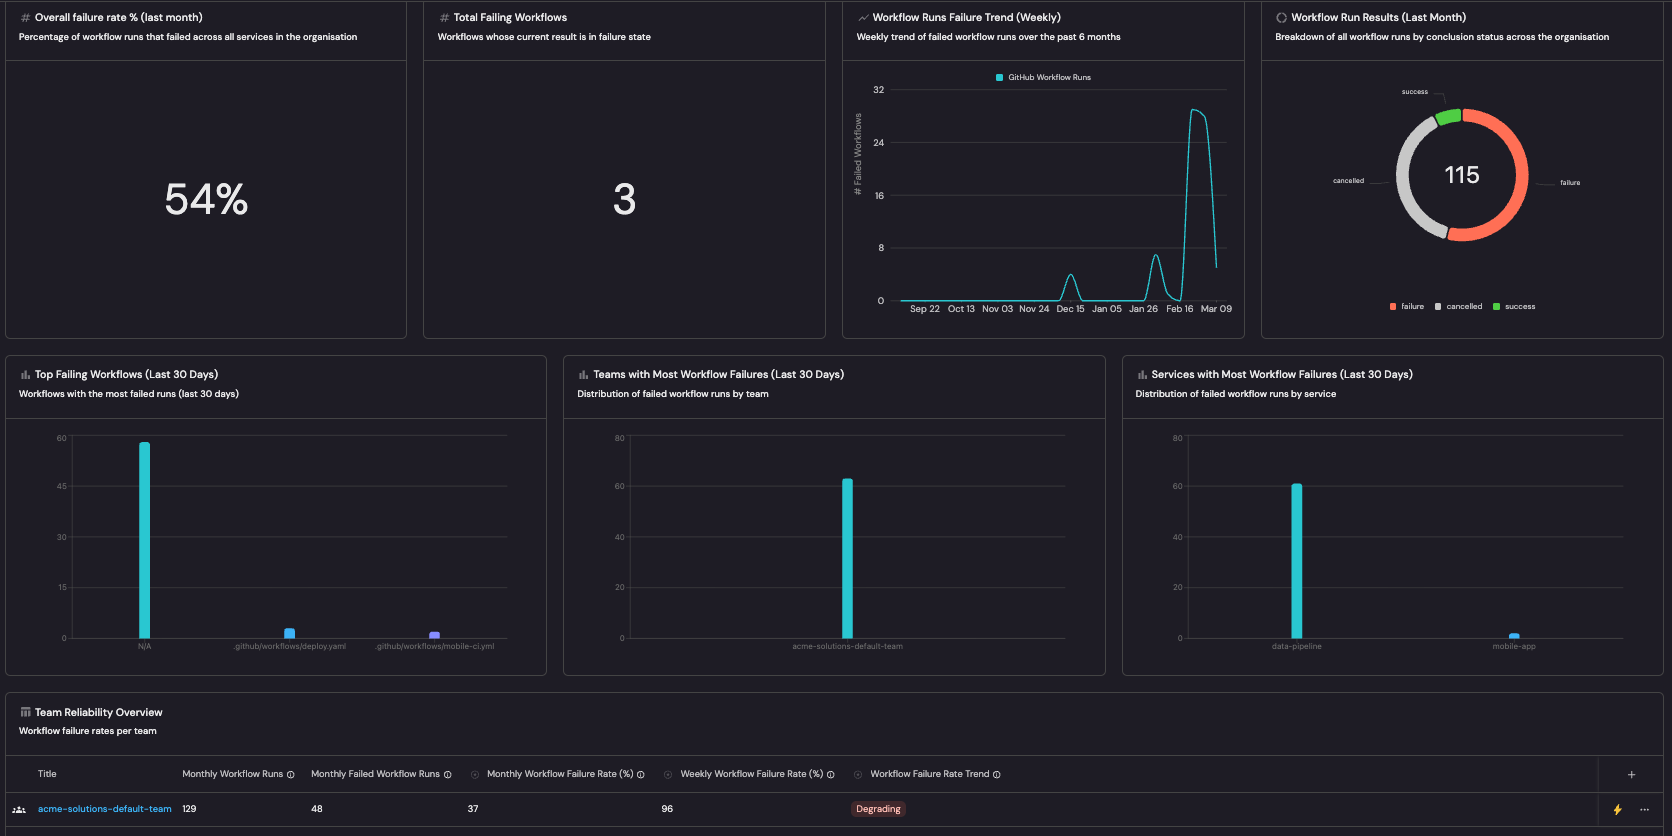
If you signed up for Port on or after May 1, 2026, this dashboard is already set up in Port. You can follow this guide to customize it to fit your organization's needs.
Understanding how your CI/CD pipelines perform is essential for maintaining delivery velocity and software quality.
Without pipeline-level visibility, engineering leaders cannot identify flaky workflows, detect reliability regressions, or measure the impact of infrastructure changes on build stability.
This guide demonstrates how to build a comprehensive pipeline reliability dashboard in Port that answers critical questions at both the service level and team level:
- Failure rate: What percentage of pipeline runs are failing weekly and monthly?
- Failure trend: Is pipeline reliability improving or degrading over time?
- Failing pipelines: Which specific workflows or builds are failing most frequently?
- Team impact: Which teams and services are most affected by pipeline failures?
By the end of this guide, you will have a dashboard that provides full visibility into pipeline reliability health across services and teams, helping you identify problem areas and track improvement over time.
This guide supports GitHub, GitLab, and Azure DevOps.
Common use cases
- Track pipeline failure rate trends to detect reliability regressions early.
- Identify the most frequently failing workflows or builds to prioritize fixes.
- Monitor failure rates per team and service to understand organizational reliability health.
- Surface services with degrading pipeline reliability before they impact delivery.
- Compare reliability metrics across teams to identify best practices and improvement areas.
Prerequisites
This guide assumes the following:
- You have a Port account and have completed the onboarding process.
- You have completed the Create foundational Engineering Intelligence data model guide, which provisions the core Organization, Team, and Service blueprints (with team ownership on services) for GitHub, GitLab, and Azure DevOps.
- GitHub
- GitLab
- Azure DevOps
- Port's GitHub Ocean integration is installed in your account.
- The
githubWorkflow,githubWorkflowRun, andgithubRepositoryblueprints already exist (these are created automatically when you install GitHub Ocean). - A
serviceblueprint exists with Port team ownership configured (see the Engineering Intelligence data model guide for setup instructions).
- Port's GitLab integration is installed in your account.
- The
gitlabRepositoryblueprint already exists (created automatically when you install the GitLab integration). - A
serviceblueprint exists with Port team ownership configured (set up via the Engineering Intelligence data model guide).
- Port's Azure DevOps integration is installed in your account.
- The
azureDevopsRepository,azureDevopsProject,azureDevopsBuild, andazureDevopsPipelineStageblueprints already exist (created automatically when you install the Azure DevOps integration). - A
serviceblueprint exists with Port team ownership configured (see the Engineering Intelligence data model guide for setup instructions).
Key metrics overview
This dashboard tracks pipeline reliability metrics across two levels - individual services and teams:
- GitHub
- GitLab
- Azure DevOps
| Metric | What it measures | Why it matters |
|---|---|---|
| Overall failure rate | Percentage of workflow runs that failed in the last month | Shows the organization-wide reliability baseline |
| Failing workflows | Count of workflows currently in a failure state | Highlights active reliability problems that need attention |
| Failure trend | Weekly count of failed workflow runs over time | Reveals whether pipeline reliability is improving or degrading |
| Run result distribution | Breakdown of workflow run conclusions (success, failure, cancelled, etc.) | Gives a complete picture of pipeline health beyond just failures |
| Top failing workflows | Workflows with the most failed runs | Identifies the specific workflows to prioritize for fixing |
| Team failure distribution | Failed workflow runs broken down by team | Shows which teams carry the most reliability burden |
| Weekly failure rate (%) | Percentage of workflow runs that failed in the last 7 days | Provides a short-term reliability signal |
| Monthly failure rate (%) | Percentage of workflow runs that failed in the last 30 days | Provides a longer-term reliability baseline |
| Failure rate trend | Whether weekly failure rate is better or worse than monthly average | Signals whether reliability is improving, stable, or degrading |
| Metric | What it measures | Why it matters |
|---|---|---|
| Overall failure rate | Percentage of pipeline jobs that failed in the last month | Shows the organization-wide reliability baseline |
| Failing pipelines | Count of pipelines currently in a failed state | Highlights active reliability problems that need attention |
| Failure trend | Weekly count of failed pipeline jobs over time | Reveals whether pipeline reliability is improving or degrading |
| Job result distribution | Breakdown of pipeline jobs by status (success, failed, canceled, etc.) | Gives a complete picture of pipeline health beyond just failures |
| Most failing stages | Pipeline stages with the most failed jobs | Identifies the specific stages to prioritize for fixing |
| Team failure distribution | Failed pipeline jobs broken down by team | Shows which teams carry the most reliability burden |
| Weekly failure rate (%) | Percentage of pipeline jobs that failed in the last 7 days | Provides a short-term reliability signal |
| Monthly failure rate (%) | Percentage of pipeline jobs that failed in the last 30 days | Provides a longer-term reliability baseline |
| Failure rate trend | Whether weekly failure rate is better or worse than monthly average | Signals whether reliability is improving, stable, or degrading |
| Metric | What it measures | Why it matters |
|---|---|---|
| Overall failure rate | Percentage of builds that failed in the last month | Shows the organization-wide reliability baseline |
| Failed builds | Count of builds that failed in the last month | Highlights active reliability problems that need attention |
| Failure trend | Weekly count of failed builds over time | Reveals whether pipeline reliability is improving or degrading |
| Build result distribution | Breakdown of builds by result (succeeded, failed, canceled, etc.) | Gives a complete picture of pipeline health beyond just failures |
| Top failing stages | Pipeline stages with the most failures | Identifies the specific stages to prioritize for fixing |
| Team failure distribution | Failed builds broken down by team | Shows which teams carry the most reliability burden |
| Weekly failure rate (%) | Percentage of builds that failed in the last 7 days | Provides a short-term reliability signal |
| Monthly failure rate (%) | Percentage of builds that failed in the last 30 days | Provides a longer-term reliability baseline |
| Failure rate trend | Whether weekly failure rate is better or worse than monthly average | Signals whether reliability is improving, stable, or degrading |
Set up data model
- GitHub
- GitLab
- Azure DevOps
The GitHub integration automatically creates the githubWorkflow and githubWorkflowRun blueprints with default properties. We need to ensure the workflow run blueprint has the right properties for reliability tracking, then add aggregation and calculation properties to the service and Team blueprints to surface failure metrics at those levels.
The integration mapping in this guide filters workflow runs to the default branch (main, master, or production) and the last 30 days. This ensures reliability metrics reflect production-relevant pipeline health rather than feature branch noise. Adjust the integration mapping selector if you need to include other branches.
Verify the GitHub workflow blueprint
The githubWorkflow blueprint should already have the following properties from the default integration. Verify they exist:Expected workflow properties (click to expand)
We need to add two additional properties to track the latest run result. These properties are populated by the second workflow-run mapping block described in the Update integration mapping section below - the block that "merges" the most recent workflow run conclusion back onto the workflow entity.
result and last_triggered_at will be null for repositories that have had no workflow runs on the default branch in the last 30 days. They are NOT set by the workflow kind mapping itself - only by the second workflow-run mapping block.
-
Go to the Data model page in Port.
-
Find the GitHub Workflow blueprint and click on it.
-
Click on the
{...}button in the top right corner, and choose Edit JSON. -
Add the following properties to the
propertiessection:Additional workflow properties (click to expand)
"result": {"title": "Result","description": "Latest run conclusion (merged from workflow-run data)","type": "string","enum": ["success", "failure", "cancelled", "skipped", "timed_out", "action_required", "neutral", "stale", "startup_failure"],"enumColors": {"success": "green","failure": "red","cancelled": "lightGray","skipped": "lightGray","timed_out": "orange","action_required": "yellow","neutral": "lightGray","stale": "darkGray","startup_failure": "red"}},"last_triggered_at": {"title": "Last Triggered At","type": "string","format": "date-time"} -
Verify the
relationssection includes a relation togithubRepository:"repository": {"title": "Repository","target": "githubRepository","required": false,"many": false} -
Click Save to update the blueprint.
Verify the GitHub workflow run blueprint
The githubWorkflowRun blueprint should already have the following properties. Verify they exist:Expected workflow run properties (click to expand)
Add the following mirror properties to surface team, service, and workflow context on each run:
-
Go to the Data model page in Port.
-
Find the GitHub Workflow Run blueprint and click on it.
-
Click on the
{...}button in the top right corner, and choose Edit JSON. -
Add or verify the following
mirrorProperties:Workflow run mirror properties (click to expand)
"service_name": {"title": "Service","path": "service.$title"},"workflow_name": {"title": "Workflow Name","path": "workflow.path"},"workflow_current_result": {"title": "Workflow Current Result","path": "workflow.result"} -
Verify the
relationssection includes all four relations:"workflow": {"title": "Workflow","target": "githubWorkflow","required": false,"many": false},"repository": {"title": "Repository","target": "githubRepository","required": false,"many": false},"service": {"title": "Service","target": "service","required": false,"many": false},"pullRequests": {"title": "Pull Requests","target": "githubPullRequest","required": false,"many": true} -
Click Save to update the blueprint.
Set up GitHub workflow run service relations
The service relation on githubWorkflowRun is populated by two complementary mechanisms:
- Mapping (ingest-time): The integration mapping sets
serviceat ingest via a search query ongithub_repository_id, linking each workflow run to the matching service entity. - Automation (post-ingest): The
set_workflow_run_relationsautomation fires whenever a service'sgithub_repositoryrelation changes and bulk-updates allgithubWorkflowRunentities whoserepositoryrelation matches the updated repository.
This automation requires the service blueprint to have a github_repository relation pointing to githubRepository. This relation is set up by the Create foundational Engineering Intelligence data model guide.
To set up the automation:
- Go to the automations page.
- Click + Automation.
- Click the
{...} Edit JSONbutton. - Paste the following JSON and click Save:
Set GitHub Workflow Run relations automation (click to expand)
{
  "identifier": "set_workflow_run_relations",
  "title": "Set GitHub Workflow Run relations",
  "trigger": {
    "type": "automation",
    "event": {"type": "ANY_ENTITY_CHANGE", "blueprintIdentifier": "service"},
    "condition": {
      "type": "JQ",
      "expressions": [
        ".diff.before.relations.github_repository != .diff.after.relations.github_repository",
        ".diff.after.relations.github_repository != null"
      ],
      "combinator": "and"
    }
  },
  "invocationMethod": {
    "type": "WEBHOOK",
    "url": "https://api.port.io/v1/migrations",
    "agent": false,
    "synchronized": true,
    "method": "POST",
    "headers": {"RUN_ID": "{{ .run.id }}", "Content-Type": "application/json"},
    "body": {
      "sourceBlueprint": "githubWorkflowRun",
      "mapping": {
        "blueprint": "githubWorkflowRun",
        "filter": ".relations.repository == \"{{ .event.diff.after.relations.github_repository }}\"",
        "entity": {
          "identifier": ".identifier",
          "relations": {"service": "\"{{ .event.context.entityIdentifier }}\""}
        }
      }
    }
  }
}
We need to create two new blueprints - gitlabPipeline and gitlabJob - to model CI/CD pipeline data from GitLab, then add aggregation and calculation properties to the service and Team blueprints.
The integration mapping in this guide filters pipelines and jobs to the default branch (main, master, or production) and the last 30 days. This ensures reliability metrics reflect production-relevant pipeline health rather than feature branch noise. Adjust the integration mapping selector if you need to include other branches.
Create the GitLab pipeline blueprint
-
Go to the Data model page in Port.
-
Click on
+ Blueprint. -
Click on the
{...} Edit JSONbutton. -
Copy and paste the following JSON configuration:
GitLab pipeline blueprint JSON (click to expand)
{"identifier": "gitlabPipeline","title": "GitLab Pipeline","icon": "GitLab","schema": {"properties": {"status": {"title": "Status","type": "string","enum": ["created", "waiting_for_resource", "preparing", "pending", "running", "success", "failed", "canceled", "skipped", "manual", "scheduled"],"enumColors": {"success": "green","failed": "red","canceled": "lightGray","skipped": "lightGray","running": "blue","pending": "yellow","manual": "orange","created": "lightGray"}},"createdAt": {"title": "Created At","type": "string","format": "date-time"},"updatedAt": {"title": "Updated At","type": "string","format": "date-time"},"link": {"title": "Link","type": "string","format": "url"},"source": {"title": "Source","description": "What triggered the pipeline (push, web, merge_request_event, etc.)","type": "string"},"ref": {"title": "Ref","description": "Branch or tag that triggered the pipeline","type": "string"}}},"calculationProperties": {"is_failing": {"title": "Is Failing","icon": "Alert","description": "True when this pipeline's latest status is failed","calculation": "if .properties.status == \"failed\" then true else false end","type": "boolean","colorized": true,"colors": {"true": "red"}}},"relations": {"repository": {"title": "Repository","target": "gitlabRepository","required": false,"many": false}}}
Create the GitLab job blueprint
-
In the Data model page in Port, click on the
+ Blueprintbutton. -
Click on the
{...} Edit JSONbutton in the top right corner. -
Paste the following JSON and click Save:
GitLab job blueprint JSON (click to expand)
{"identifier": "gitlabJob","title": "GitLab Job","icon": "GitLab","schema": {"properties": {"status": {"title": "Status","type": "string","enum": ["created", "waiting_for_resource", "preparing", "pending", "running", "success", "failed", "canceled", "skipped", "manual"],"enumColors": {"success": "green","failed": "red","canceled": "lightGray","skipped": "lightGray","running": "blue","pending": "yellow","manual": "orange","created": "lightGray"}},"stage": {"title": "Stage","description": "The pipeline stage this job belongs to","type": "string"},"startedAt": {"title": "Started At","type": "string","format": "date-time"},"finishedAt": {"title": "Finished At","type": "string","format": "date-time"},"link": {"title": "Link","type": "string","format": "url"},"duration": {"title": "Duration (seconds)","description": "How long the job ran in seconds","type": "number"}}},"mirrorProperties": {"service_name": {"title": "Service","path": "service.$title"},"pipeline_status": {"title": "Pipeline Status","path": "pipeline.status"}},"relations": {"pipeline": {"title": "Pipeline","target": "gitlabPipeline","required": false,"many": false},"repository": {"title": "Repository","target": "gitlabRepository","required": false,"many": false},"service": {"title": "Service","target": "service","required": false,"many": false}}}
The Azure DevOps integration automatically creates the azureDevopsBuild and azureDevopsPipelineStage blueprints. We need to verify these blueprints have the right properties and relations for reliability tracking, then add aggregation and calculation properties to the service and Team blueprints.
Verify the Azure DevOps build blueprint
The azureDevopsBuild blueprint should already exist with the following properties. Verify they are present:
-
Go to the Data model page in Port.
-
Find the Azure DevOps Build blueprint and click on it.
-
Click on the
{...}button in the top right corner, and choose Edit JSON. -
Verify the blueprint matches the following structure (update if needed) and click Save:
Azure DevOps build blueprint (click to expand)
{"identifier": "azureDevopsBuild","title": "Azure DevOps Build","icon": "AzureDevops","schema": {"properties": {"status": {"title": "Status","type": "string"},"result": {"title": "Result","type": "string","enum": ["succeeded", "partiallySucceeded", "failed", "canceled", "none"],"enumColors": {"succeeded": "green","partiallySucceeded": "yellow","failed": "red","canceled": "lightGray","none": "lightGray"}},"queueTime": {"title": "Queue Time","type": "string","format": "date-time"},"startTime": {"title": "Start Time","type": "string","format": "date-time"},"finishTime": {"title": "Finish Time","type": "string","format": "date-time"},"definitionName": {"title": "Definition Name","type": "string"},"requestedFor": {"title": "Requested For","type": "string"},"link": {"title": "Link","type": "string","format": "url"}}},"mirrorProperties": {"service_name": {"title": "Service","path": "service.$title"}},"relations": {"project": {"title": "Project","target": "azureDevopsProject","required": false,"many": false},"repository": {"title": "Repository","target": "azureDevopsRepository","required": false,"many": false},"service": {"title": "Service","target": "service","required": false,"many": false}}}
Verify the Azure DevOps pipeline stage blueprint
The azureDevopsPipelineStage blueprint should already exist with the following properties. Verify they are present:
-
In the Data model page in Port, find the Azure DevOps Pipeline Stage blueprint and click on it.
-
Click on the
{...}button in the top right corner, and choose Edit JSON. -
Verify the blueprint matches the following structure (update if needed) and click Save:
Azure DevOps pipeline stage blueprint (click to expand)
{"identifier": "azureDevopsPipelineStage","title": "Azure DevOps Pipeline Stage","icon": "AzureDevops","schema": {"properties": {"state": {"title": "State","type": "string"},"result": {"title": "Result","type": "string"},"startTime": {"title": "Start Time","type": "string","format": "date-time"},"finishTime": {"title": "Finish Time","type": "string","format": "date-time"},"stageType": {"title": "Stage Type","type": "string"}}},"relations": {"project": {"title": "Project","target": "azureDevopsProject","required": false,"many": false},"build": {"title": "Build","target": "azureDevopsBuild","required": false,"many": false}}}
Update the service blueprint
Add aggregation and calculation properties to the service blueprint to surface pipeline reliability metrics for each service.
- Go to the Data model page in Port.
- Find the Service blueprint and click on it.
- Click on the
{...}button in the top right corner, and choose Edit JSON. - Add the following entries to the
aggregationPropertiessection of the blueprint:
- GitHub
- GitLab
- Azure DevOps
Service reliability aggregation properties (click to expand)
"github_workflow_runs_7d": {
  "title": "Weekly Workflow Runs",
  "description": "Total workflow runs in the last 7 days",
  "type": "number",
  "target": "githubWorkflowRun",
  "query": {
    "combinator": "and",
    "rules": [
      {
        "property": "createdAt",
        "operator": "between",
        "value": {
          "preset": "lastWeek"
        }
      }
    ]
  },
  "calculationSpec": {
    "func": "count",
    "calculationBy": "entities"
  }
},
"github_failed_workflow_runs_7d": {
  "title": "Weekly Failed Workflow Runs",
  "description": "Workflow runs that ended in failure in the last 7 days",
  "type": "number",
  "target": "githubWorkflowRun",
  "query": {
    "combinator": "and",
    "rules": [
      {
        "property": "createdAt",
        "operator": "between",
        "value": {
          "preset": "lastWeek"
        }
      },
      {
        "property": "conclusion",
        "operator": "=",
        "value": "failure"
      }
    ]
  },
  "calculationSpec": {
    "func": "count",
    "calculationBy": "entities"
  }
},
"github_workflow_runs_30d": {
  "title": "Monthly Workflow Runs",
  "description": "Total workflow runs in the last 30 days",
  "type": "number",
  "target": "githubWorkflowRun",
  "query": {
    "combinator": "and",
    "rules": [
      {
        "property": "createdAt",
        "operator": "between",
        "value": {
          "preset": "lastMonth"
        }
      }
    ]
  },
  "calculationSpec": {
    "func": "count",
    "calculationBy": "entities"
  }
},
"github_failed_workflow_runs_30d": {
  "title": "Monthly Failed Workflow Runs",
  "description": "Workflow runs that ended in failure in the last 30 days",
  "type": "number",
  "target": "githubWorkflowRun",
  "query": {
    "combinator": "and",
    "rules": [
      {
        "property": "createdAt",
        "operator": "between",
        "value": {
          "preset": "lastMonth"
        }
      },
      {
        "property": "conclusion",
        "operator": "=",
        "value": "failure"
      }
    ]
  },
  "calculationSpec": {
    "func": "count",
    "calculationBy": "entities"
  }
}
Service reliability aggregation properties (click to expand)
The gitlabJob blueprint has a direct service relation, so the pathFilter uses ["service"] to ensure Port resolves the correct path from job entities to their owning service.
"gitlab_pipeline_jobs_7d": {
  "title": "Weekly Pipeline Jobs",
  "description": "Total pipeline jobs in the last 7 days",
  "type": "number",
  "target": "gitlabJob",
  "query": {
    "combinator": "and",
    "rules": [
      {
        "property": "startedAt",
        "operator": "between",
        "value": {
          "preset": "lastWeek"
        }
      }
    ]
  },
  "calculationSpec": {
    "func": "count",
    "calculationBy": "entities"
  },
  "pathFilter": [
    {
      "path": ["service"],
      "fromBlueprint": "gitlabJob"
    }
  ]
},
"gitlab_failed_pipeline_jobs_7d": {
  "title": "Weekly Failed Pipeline Jobs",
  "description": "Pipeline jobs that failed in the last 7 days",
  "type": "number",
  "target": "gitlabJob",
  "query": {
    "combinator": "and",
    "rules": [
      {
        "property": "startedAt",
        "operator": "between",
        "value": {
          "preset": "lastWeek"
        }
      },
      {
        "property": "status",
        "operator": "=",
        "value": "failed"
      }
    ]
  },
  "calculationSpec": {
    "func": "count",
    "calculationBy": "entities"
  },
  "pathFilter": [
    {
      "path": ["service"],
      "fromBlueprint": "gitlabJob"
    }
  ]
},
"gitlab_pipeline_jobs_30d": {
  "title": "Monthly Pipeline Jobs",
  "description": "Total pipeline jobs in the last 30 days",
  "type": "number",
  "target": "gitlabJob",
  "query": {
    "combinator": "and",
    "rules": [
      {
        "property": "startedAt",
        "operator": "between",
        "value": {
          "preset": "lastMonth"
        }
      }
    ]
  },
  "calculationSpec": {
    "func": "count",
    "calculationBy": "entities"
  },
  "pathFilter": [
    {
      "path": ["service"],
      "fromBlueprint": "gitlabJob"
    }
  ]
},
"gitlab_failed_pipeline_jobs_30d": {
  "title": "Monthly Failed Pipeline Jobs",
  "description": "Pipeline jobs that failed in the last 30 days",
  "type": "number",
  "target": "gitlabJob",
  "query": {
    "combinator": "and",
    "rules": [
      {
        "property": "startedAt",
        "operator": "between",
        "value": {
          "preset": "lastMonth"
        }
      },
      {
        "property": "status",
        "operator": "=",
        "value": "failed"
      }
    ]
  },
  "calculationSpec": {
    "func": "count",
    "calculationBy": "entities"
  },
  "pathFilter": [
    {
      "path": ["service"],
      "fromBlueprint": "gitlabJob"
    }
  ]
}
Service reliability aggregation properties (click to expand)
The azureDevopsBuild blueprint has a direct service relation, so the pathFilter uses ["service"] to ensure Port resolves the correct path from build entities to their owning service.
"ado_pipeline_builds_7d": {
  "title": "Weekly Build Runs",
  "description": "Total builds in the last 7 days",
  "type": "number",
  "target": "azureDevopsBuild",
  "query": {
    "combinator": "and",
    "rules": [
      {
        "property": "$createdAt",
        "operator": "between",
        "value": {
          "preset": "lastWeek"
        }
      }
    ]
  },
  "calculationSpec": {
    "func": "count",
    "calculationBy": "entities"
  },
  "pathFilter": [
    {
      "path": ["service"],
      "fromBlueprint": "azureDevopsBuild"
    }
  ]
},
"ado_failed_pipeline_builds_7d": {
  "title": "Weekly Failed Builds",
  "description": "Builds that failed in the last 7 days",
  "type": "number",
  "target": "azureDevopsBuild",
  "query": {
    "combinator": "and",
    "rules": [
      {
        "property": "$createdAt",
        "operator": "between",
        "value": {
          "preset": "lastWeek"
        }
      },
      {
        "property": "result",
        "operator": "=",
        "value": "failed"
      }
    ]
  },
  "calculationSpec": {
    "func": "count",
    "calculationBy": "entities"
  },
  "pathFilter": [
    {
      "path": ["service"],
      "fromBlueprint": "azureDevopsBuild"
    }
  ]
},
"ado_pipeline_builds_30d": {
  "title": "Monthly Build Runs",
  "description": "Total builds in the last 30 days",
  "type": "number",
  "target": "azureDevopsBuild",
  "query": {
    "combinator": "and",
    "rules": [
      {
        "property": "$createdAt",
        "operator": "between",
        "value": {
          "preset": "lastMonth"
        }
      }
    ]
  },
  "calculationSpec": {
    "func": "count",
    "calculationBy": "entities"
  },
  "pathFilter": [
    {
      "path": ["service"],
      "fromBlueprint": "azureDevopsBuild"
    }
  ]
},
"ado_failed_pipeline_builds_30d": {
  "title": "Monthly Failed Builds",
  "description": "Builds that failed in the last 30 days",
  "type": "number",
  "target": "azureDevopsBuild",
  "query": {
    "combinator": "and",
    "rules": [
      {
        "property": "$createdAt",
        "operator": "between",
        "value": {
          "preset": "lastMonth"
        }
      },
      {
        "property": "result",
        "operator": "=",
        "value": "failed"
      }
    ]
  },
  "calculationSpec": {
    "func": "count",
    "calculationBy": "entities"
  },
  "pathFilter": [
    {
      "path": ["service"],
      "fromBlueprint": "azureDevopsBuild"
    }
  ]
}
- Add the following entries to the
calculationPropertiessection of the blueprint:
- GitHub
- GitLab
- Azure DevOps
Service reliability calculation properties (click to expand)
"github_weekly_workflow_failure_rate": {
  "title": "Weekly Failure Rate (%)",
  "description": "Percentage of pipeline runs that failed in the last 7 days",
  "type": "number",
  "calculation": "if (.properties.github_workflow_runs_7d != null and .properties.github_workflow_runs_7d != 0) then ((.properties.github_failed_workflow_runs_7d // 0) / .properties.github_workflow_runs_7d) * 100 | floor else 0 end"
},
"github_monthly_workflow_failure_rate": {
  "title": "Monthly Failure Rate (%)",
  "description": "Percentage of pipeline runs that failed in the last 30 days",
  "type": "number",
  "calculation": "if (.properties.github_workflow_runs_30d != null and .properties.github_workflow_runs_30d != 0) then ((.properties.github_failed_workflow_runs_30d // 0) / .properties.github_workflow_runs_30d) * 100 | floor else 0 end"
},
"github_failure_rate_trend": {
  "title": "Failure Rate Trend",
  "description": "Weekly failure rate vs monthly average - Improving, Stable, or Degrading",
  "type": "string",
  "colorized": true,
  "colors": {
    "Improving": "green",
    "Stable": "blue",
    "Degrading": "red"
  },
  "calculation": "((if (.properties.github_workflow_runs_30d != null and .properties.github_workflow_runs_30d != 0) then ((.properties.github_failed_workflow_runs_30d // 0) / .properties.github_workflow_runs_30d) * 100 | floor else 0 end) - (if (.properties.github_workflow_runs_7d != null and .properties.github_workflow_runs_7d != 0) then ((.properties.github_failed_workflow_runs_7d // 0) / .properties.github_workflow_runs_7d) * 100 | floor else 0 end)) as $diff | if $diff > 0 then \"Improving\" elif $diff < 0 then \"Degrading\" else \"Stable\" end"
}
Service reliability calculation properties (click to expand)
"gitlab_weekly_pipeline_job_failure_rate": {
  "title": "Weekly Failure Rate (%)",
  "description": "Percentage of pipeline jobs that failed in the last 7 days",
  "type": "number",
  "calculation": "if (.properties.gitlab_pipeline_jobs_7d != null and .properties.gitlab_pipeline_jobs_7d != 0) then ((.properties.gitlab_failed_pipeline_jobs_7d // 0) / .properties.gitlab_pipeline_jobs_7d) * 100 | floor else 0 end"
},
"gitlab_monthly_pipeline_job_failure_rate": {
  "title": "Monthly Failure Rate (%)",
  "description": "Percentage of pipeline jobs that failed in the last 30 days",
  "type": "number",
  "calculation": "if (.properties.gitlab_pipeline_jobs_30d != null and .properties.gitlab_pipeline_jobs_30d != 0) then ((.properties.gitlab_failed_pipeline_jobs_30d // 0) / .properties.gitlab_pipeline_jobs_30d) * 100 | floor else 0 end"
},
"gitlab_pipeline_job_failure_rate_trend": {
  "title": "Failure Rate Trend",
  "description": "Weekly failure rate vs monthly average - Improving, Stable, or Degrading",
  "type": "string",
  "colorized": true,
  "colors": {
    "Improving": "green",
    "Stable": "blue",
    "Degrading": "red"
  },
  "calculation": "((if (.properties.gitlab_pipeline_jobs_30d != null and .properties.gitlab_pipeline_jobs_30d != 0) then ((.properties.gitlab_failed_pipeline_jobs_30d // 0) / .properties.gitlab_pipeline_jobs_30d) * 100 | floor else 0 end) - (if (.properties.gitlab_pipeline_jobs_7d != null and .properties.gitlab_pipeline_jobs_7d != 0) then ((.properties.gitlab_failed_pipeline_jobs_7d // 0) / .properties.gitlab_pipeline_jobs_7d) * 100 | floor else 0 end)) as $diff | if $diff > 0 then \"Improving\" elif $diff < 0 then \"Degrading\" else \"Stable\" end"
}
Service reliability calculation properties (click to expand)
"ado_weekly_pipeline_build_failure_rate": {
  "title": "Weekly Failure Rate (%)",
  "description": "Percentage of pipeline builds that failed in the last 7 days",
  "type": "number",
  "calculation": "if (.properties.ado_pipeline_builds_7d != null and .properties.ado_pipeline_builds_7d != 0) then ((.properties.ado_failed_pipeline_builds_7d // 0) / .properties.ado_pipeline_builds_7d) * 100 | floor else 0 end"
},
"ado_monthly_pipeline_build_failure_rate": {
  "title": "Monthly Failure Rate (%)",
  "description": "Percentage of pipeline builds that failed in the last 30 days",
  "type": "number",
  "calculation": "if (.properties.ado_pipeline_builds_30d != null and .properties.ado_pipeline_builds_30d != 0) then ((.properties.ado_failed_pipeline_builds_30d // 0) / .properties.ado_pipeline_builds_30d) * 100 | floor else 0 end"
},
"ado_pipeline_build_failure_rate_trend": {
  "title": "Failure Rate Trend",
  "description": "Weekly failure rate vs monthly average - Improving, Stable, or Degrading",
  "type": "string",
  "colorized": true,
  "colors": {
    "Improving": "green",
    "Stable": "blue",
    "Degrading": "red"
  },
  "calculation": "((if (.properties.ado_pipeline_builds_30d != null and .properties.ado_pipeline_builds_30d != 0) then ((.properties.ado_failed_pipeline_builds_30d // 0) / .properties.ado_pipeline_builds_30d) * 100 | floor else 0 end) - (if (.properties.ado_pipeline_builds_7d != null and .properties.ado_pipeline_builds_7d != 0) then ((.properties.ado_failed_pipeline_builds_7d // 0) / .properties.ado_pipeline_builds_7d) * 100 | floor else 0 end)) as $diff | if $diff > 0 then \"Improving\" elif $diff < 0 then \"Degrading\" else \"Stable\" end"
}
- Click Save to update the blueprint.
Update the team blueprint
Add aggregation and calculation properties to the Team blueprint to aggregate reliability metrics across all services owned by each team.
- Go to the Data model page in Port.
- Find the Team blueprint and click on it.
- Click on the
{...}button in the top right corner, and choose Edit JSON. - Add the following entries to the
aggregationPropertiessection of the blueprint:
- GitHub
- GitLab
- Azure DevOps
Team reliability aggregation properties (click to expand)
"github_workflow_runs_7d": {
  "title": "Weekly Workflow Runs",
  "description": "Total workflow runs in the last 7 days",
  "type": "number",
  "target": "githubWorkflowRun",
  "query": {
    "combinator": "and",
    "rules": [
      {
        "property": "createdAt",
        "operator": "between",
        "value": {
          "preset": "lastWeek"
        }
      }
    ]
  },
  "calculationSpec": {
    "func": "count",
    "calculationBy": "entities"
  }
},
"github_failed_workflow_runs_7d": {
  "title": "Weekly Failed Workflow Runs",
  "description": "Workflow runs that ended in failure in the last 7 days",
  "type": "number",
  "target": "githubWorkflowRun",
  "query": {
    "combinator": "and",
    "rules": [
      {
        "property": "createdAt",
        "operator": "between",
        "value": {
          "preset": "lastWeek"
        }
      },
      {
        "property": "conclusion",
        "operator": "=",
        "value": "failure"
      }
    ]
  },
  "calculationSpec": {
    "func": "count",
    "calculationBy": "entities"
  }
},
"github_workflow_runs_30d": {
  "title": "Monthly Workflow Runs",
  "description": "Total workflow runs in the last 30 days",
  "type": "number",
  "target": "githubWorkflowRun",
  "query": {
    "combinator": "and",
    "rules": [
      {
        "property": "createdAt",
        "operator": "between",
        "value": {
          "preset": "lastMonth"
        }
      }
    ]
  },
  "calculationSpec": {
    "func": "count",
    "calculationBy": "entities"
  }
},
"github_failed_workflow_runs_30d": {
  "title": "Monthly Failed Workflow Runs",
  "description": "Workflow runs that ended in failure in the last 30 days",
  "type": "number",
  "target": "githubWorkflowRun",
  "query": {
    "combinator": "and",
    "rules": [
      {
        "property": "createdAt",
        "operator": "between",
        "value": {
          "preset": "lastMonth"
        }
      },
      {
        "property": "conclusion",
        "operator": "=",
        "value": "failure"
      }
    ]
  },
  "calculationSpec": {
    "func": "count",
    "calculationBy": "entities"
  }
}
Team reliability aggregation properties (click to expand)
"gitlab_pipeline_jobs_7d": {
  "title": "Weekly Pipeline Jobs",
  "description": "Total pipeline jobs in the last 7 days",
  "type": "number",
  "target": "gitlabJob",
  "query": {
    "combinator": "and",
    "rules": [
      {
        "property": "startedAt",
        "operator": "between",
        "value": {
          "preset": "lastWeek"
        }
      }
    ]
  },
  "calculationSpec": {
    "func": "count",
    "calculationBy": "entities"
  }
},
"gitlab_failed_pipeline_jobs_7d": {
  "title": "Weekly Failed Pipeline Jobs",
  "description": "Pipeline jobs that failed in the last 7 days",
  "type": "number",
  "target": "gitlabJob",
  "query": {
    "combinator": "and",
    "rules": [
      {
        "property": "startedAt",
        "operator": "between",
        "value": {
          "preset": "lastWeek"
        }
      },
      {
        "property": "status",
        "operator": "=",
        "value": "failed"
      }
    ]
  },
  "calculationSpec": {
    "func": "count",
    "calculationBy": "entities"
  }
},
"gitlab_pipeline_jobs_30d": {
  "title": "Monthly Pipeline Jobs",
  "description": "Total pipeline jobs in the last 30 days",
  "type": "number",
  "target": "gitlabJob",
  "query": {
    "combinator": "and",
    "rules": [
      {
        "property": "startedAt",
        "operator": "between",
        "value": {
          "preset": "lastMonth"
        }
      }
    ]
  },
  "calculationSpec": {
    "func": "count",
    "calculationBy": "entities"
  }
},
"gitlab_failed_pipeline_jobs_30d": {
  "title": "Monthly Failed Pipeline Jobs",
  "description": "Pipeline jobs that failed in the last 30 days",
  "type": "number",
  "target": "gitlabJob",
  "query": {
    "combinator": "and",
    "rules": [
      {
        "property": "startedAt",
        "operator": "between",
        "value": {
          "preset": "lastMonth"
        }
      },
      {
        "property": "status",
        "operator": "=",
        "value": "failed"
      }
    ]
  },
  "calculationSpec": {
    "func": "count",
    "calculationBy": "entities"
  }
}
Team reliability aggregation properties (click to expand)
"ado_pipeline_builds_7d": {
  "title": "Weekly Build Runs",
  "description": "Total builds in the last 7 days",
  "type": "number",
  "target": "azureDevopsBuild",
  "query": {
    "combinator": "and",
    "rules": [
      {
        "property": "$createdAt",
        "operator": "between",
        "value": {
          "preset": "lastWeek"
        }
      }
    ]
  },
  "calculationSpec": {
    "func": "count",
    "calculationBy": "entities"
  }
},
"ado_failed_pipeline_builds_7d": {
  "title": "Weekly Failed Builds",
  "description": "Builds that failed in the last 7 days",
  "type": "number",
  "target": "azureDevopsBuild",
  "query": {
    "combinator": "and",
    "rules": [
      {
        "property": "$createdAt",
        "operator": "between",
        "value": {
          "preset": "lastWeek"
        }
      },
      {
        "property": "result",
        "operator": "=",
        "value": "failed"
      }
    ]
  },
  "calculationSpec": {
    "func": "count",
    "calculationBy": "entities"
  }
},
"ado_pipeline_builds_30d": {
  "title": "Monthly Build Runs",
  "description": "Total builds in the last 30 days",
  "type": "number",
  "target": "azureDevopsBuild",
  "query": {
    "combinator": "and",
    "rules": [
      {
        "property": "$createdAt",
        "operator": "between",
        "value": {
          "preset": "lastMonth"
        }
      }
    ]
  },
  "calculationSpec": {
    "func": "count",
    "calculationBy": "entities"
  }
},
"ado_failed_pipeline_builds_30d": {
  "title": "Monthly Failed Builds",
  "description": "Builds that failed in the last 30 days",
  "type": "number",
  "target": "azureDevopsBuild",
  "query": {
    "combinator": "and",
    "rules": [
      {
        "property": "$createdAt",
        "operator": "between",
        "value": {
          "preset": "lastMonth"
        }
      },
      {
        "property": "result",
        "operator": "=",
        "value": "failed"
      }
    ]
  },
  "calculationSpec": {
    "func": "count",
    "calculationBy": "entities"
  }
}
- Add the following entries to the
calculationPropertiessection of the blueprint:
- GitHub
- GitLab
- Azure DevOps
Team reliability calculation properties (click to expand)
"weekly_workflow_failure_rate": {
  "title": "Weekly Failure Rate (%)",
  "description": "Percentage of pipeline runs that failed in the last 7 days",
  "type": "number",
  "calculation": "if (.properties.github_workflow_runs_7d != null and .properties.github_workflow_runs_7d != 0) then ((.properties.github_failed_workflow_runs_7d // 0) / .properties.github_workflow_runs_7d) * 100 | floor else 0 end"
},
"monthly_workflow_failure_rate": {
  "title": "Monthly Failure Rate (%)",
  "description": "Percentage of pipeline runs that failed in the last 30 days",
  "type": "number",
  "calculation": "if (.properties.github_workflow_runs_30d != null and .properties.github_workflow_runs_30d != 0) then ((.properties.github_failed_workflow_runs_30d // 0) / .properties.github_workflow_runs_30d) * 100 | floor else 0 end"
},
"failure_rate_trend": {
  "title": "Failure Rate Trend",
  "description": "Weekly failure rate vs monthly average - Improving, Stable, or Degrading",
  "type": "string",
  "colorized": true,
  "colors": {
    "Improving": "green",
    "Stable": "blue",
    "Degrading": "red"
  },
  "calculation": "((if (.properties.github_workflow_runs_30d != null and .properties.github_workflow_runs_30d != 0) then ((.properties.github_failed_workflow_runs_30d // 0) / .properties.github_workflow_runs_30d) * 100 | floor else 0 end) - (if (.properties.github_workflow_runs_7d != null and .properties.github_workflow_runs_7d != 0) then ((.properties.github_failed_workflow_runs_7d // 0) / .properties.github_workflow_runs_7d) * 100 | floor else 0 end)) as $diff | if $diff > 0 then \"Improving\" elif $diff < 0 then \"Degrading\" else \"Stable\" end"
}
Team reliability calculation properties (click to expand)
"weekly_pipeline_job_failure_rate": {
  "title": "Weekly Failure Rate (%)",
  "description": "Percentage of pipeline runs that failed in the last 7 days",
  "type": "number",
  "calculation": "if (.properties.gitlab_pipeline_jobs_7d != null and .properties.gitlab_pipeline_jobs_7d != 0) then ((.properties.gitlab_failed_pipeline_jobs_7d // 0) / .properties.gitlab_pipeline_jobs_7d) * 100 | floor else 0 end"
},
"monthly_pipeline_job_failure_rate": {
  "title": "Monthly Failure Rate (%)",
  "description": "Percentage of pipeline runs that failed in the last 30 days",
  "type": "number",
  "calculation": "if (.properties.gitlab_pipeline_jobs_30d != null and .properties.gitlab_pipeline_jobs_30d != 0) then ((.properties.gitlab_failed_pipeline_jobs_30d // 0) / .properties.gitlab_pipeline_jobs_30d) * 100 | floor else 0 end"
},
"pipeline_job_failure_rate_trend": {
  "title": "Failure Rate Trend",
  "description": "Weekly failure rate vs monthly average - Improving, Stable, or Degrading",
  "type": "string",
  "colorized": true,
  "colors": {
    "Improving": "green",
    "Stable": "blue",
    "Degrading": "red"
  },
  "calculation": "((if (.properties.gitlab_pipeline_jobs_30d != null and .properties.gitlab_pipeline_jobs_30d != 0) then ((.properties.gitlab_failed_pipeline_jobs_30d // 0) / .properties.gitlab_pipeline_jobs_30d) * 100 | floor else 0 end) - (if (.properties.gitlab_pipeline_jobs_7d != null and .properties.gitlab_pipeline_jobs_7d != 0) then ((.properties.gitlab_failed_pipeline_jobs_7d // 0) / .properties.gitlab_pipeline_jobs_7d) * 100 | floor else 0 end)) as $diff | if $diff > 0 then \"Improving\" elif $diff < 0 then \"Degrading\" else \"Stable\" end"
}
Team reliability calculation properties (click to expand)
"weekly_pipeline_build_failure_rate": {
  "title": "Weekly Failure Rate (%)",
  "description": "Percentage of pipeline builds that failed in the last 7 days",
  "type": "number",
  "calculation": "if (.properties.ado_pipeline_builds_7d != null and .properties.ado_pipeline_builds_7d != 0) then ((.properties.ado_failed_pipeline_builds_7d // 0) / .properties.ado_pipeline_builds_7d) * 100 | floor else 0 end"
},
"monthly_pipeline_build_failure_rate": {
  "title": "Monthly Failure Rate (%)",
  "description": "Percentage of pipeline builds that failed in the last 30 days",
  "type": "number",
  "calculation": "if (.properties.ado_pipeline_builds_30d != null and .properties.ado_pipeline_builds_30d != 0) then ((.properties.ado_failed_pipeline_builds_30d // 0) / .properties.ado_pipeline_builds_30d) * 100 | floor else 0 end"
},
"pipeline_build_failure_rate_trend": {
  "title": "Failure Rate Trend",
  "description": "Weekly failure rate vs monthly average - Improving, Stable, or Degrading",
  "type": "string",
  "colorized": true,
  "colors": {
    "Improving": "green",
    "Stable": "blue",
    "Degrading": "red"
  },
  "calculation": "((if (.properties.ado_pipeline_builds_30d != null and .properties.ado_pipeline_builds_30d != 0) then ((.properties.ado_failed_pipeline_builds_30d // 0) / .properties.ado_pipeline_builds_30d) * 100 | floor else 0 end) - (if (.properties.ado_pipeline_builds_7d != null and .properties.ado_pipeline_builds_7d != 0) then ((.properties.ado_failed_pipeline_builds_7d // 0) / .properties.ado_pipeline_builds_7d) * 100 | floor else 0 end)) as $diff | if $diff > 0 then \"Improving\" elif $diff < 0 then \"Degrading\" else \"Stable\" end"
}
- Click Save to update the blueprint.
Organization blueprint reliability properties
The organization blueprint already contains calculationProperties that surface reliability metrics at the organization level. These are derived from existing aggregation counts and are already present - you do not need to add them.
The organization blueprint includes these calculationProperties per provider:
- GitHub
- GitLab
- Azure DevOps
monthly_workflow_failure_rate- Monthly workflow run failure rate (%)failure_rate_trend- Whether weekly failure rate is better or worse than monthly averageweekly_workflow_failure_rate- Weekly workflow run failure rate (%)
monthly_pipeline_job_failure_rate- Monthly pipeline job failure rate (%)pipeline_job_failure_rate_trend- Whether weekly failure rate is better or worse than monthly averagegitlab_cycle_time_trend- Cycle time trend for GitLab merge requestsgitlab_stale_mr_share_percent- Percentage of stale merge requestsgitlab_throughput_trend- Throughput trend for GitLab merge requestsweekly_pipeline_job_failure_rate- Weekly pipeline job failure rate (%)
monthly_pipeline_build_failure_rate- Monthly pipeline build failure rate (%)pipeline_build_failure_rate_trend- Whether weekly failure rate is better or worse than monthly averageado_cycle_time_trend- Cycle time trend for ADO pull requestsado_stale_pr_share_percent- Percentage of stale pull requestsado_throughput_trend- Throughput trend for ADO pull requestsweekly_pipeline_build_failure_rate- Weekly pipeline build failure rate (%)
Repository blueprint inline metrics
Each repository blueprint also carries its own metric properties mirroring service-level equivalents. These are already present and are used as the source for service and organization-level aggregations.
- GitHub
- GitLab
- Azure DevOps
The githubRepository blueprint includes these metric properties:
open_prs, merged_prs_last_week, merged_prs_last_month, pr_cycle_time, pr_cycle_time_weekly, stale_prs_7d, workflow_runs_7d, workflow_runs_30d, failed_workflow_runs_7d, failed_workflow_runs_30d, cycle_time_trend, failure_rate_trend, monthly_workflow_failure_rate, stale_pr_share_percent, throughput_trend, weekly_workflow_failure_rate
The gitlabRepository blueprint includes these metric properties:
open_mrs, merged_mrs_last_week, merged_mrs_last_month, mr_cycle_time, mr_cycle_time_weekly, stale_mrs_7d, pipeline_jobs_7d, pipeline_jobs_30d, failed_pipeline_jobs_7d, failed_pipeline_jobs_30d, cycle_time_trend, throughput_trend, stale_mr_share_percent, monthly_pipeline_job_failure_rate, pipeline_job_failure_rate_trend, weekly_pipeline_job_failure_rate
The azureDevopsRepository blueprint includes these metric properties:
open_prs, merged_prs_last_week, merged_prs_last_month, pr_cycle_time, pr_cycle_time_weekly, stale_prs_7d, pipeline_builds_7d, pipeline_builds_30d, failed_pipeline_builds_7d, failed_pipeline_builds_30d, failed_builds_last_7d, cycle_time_trend, throughput_trend, stale_pr_share_percent, monthly_pipeline_build_failure_rate, pipeline_build_failure_rate_trend, weekly_pipeline_build_failure_rate
Update integration mapping
- GitHub
- GitLab
- Azure DevOps
Now we'll update the GitHub integration mapping to populate the workflow and workflow run blueprints with the properties needed for reliability tracking. The default mapping may already handle basic workflow data, but we need to ensure the workflow run mapping filters to the default branch and includes the conclusion property.
-
Go to your Data Source page.
-
Select the GitHub integration.
-
Find or add the
workflowresource block in the mapping:Workflow mapping (click to expand)
- kind: workflowselector:query: 'true'port:entity:mappings:identifier: >-(.url | capture("repos/(?<repo>[^/]+/[^/]+)/") | .repo) +(.id|tostring)title: .nameblueprint: '"githubWorkflow"'properties:path: .pathstatus: .statecreatedAt: .created_atupdatedAt: .updated_atlink: .html_urlrelations:repository: >-.url | capture("repos/[^/]+/(?<repo>[^/]+)/") | .repo -
Find or add the
workflow-runresource block. This mapping creates workflow run entities filtered to the default branch and last 30 days:Workflow run mapping (click to expand)
- kind: workflow-runselector:query: >-(.head_branch | IN("main", "master", "production")) and((.created_at | fromdateiso8601) > (now - 2592000))port:entity:mappings:identifier: .repository.full_name + (.id|tostring)title: .display_titleblueprint: '"githubWorkflowRun"'properties:name: .nametriggeringActor: .triggering_actor.loginstatus: .statusconclusion: .conclusioncreatedAt: .created_atrunStartedAt: .run_started_atupdatedAt: .updated_atrunNumber: .run_numberrunAttempt: .run_attemptlink: .html_urlheadBranch: .head_branchrelations:workflow: .repository.full_name + (.workflow_id|tostring)repository: .repository.name -
Add a second
workflow-runresource block that updates the workflow blueprint with the latest run result. This "merges" the most recent conclusion back onto the workflow entity:Workflow result update mapping (click to expand)
- kind: workflow-runselector:query: >-(.head_branch | IN("main", "master", "production")) and((.created_at | fromdateiso8601) > (now - 2592000))port:entity:mappings:identifier: .repository.full_name + (.workflow_id|tostring)title: .repository.full_name + (.workflow_id|tostring)blueprint: '"githubWorkflow"'properties:result: .conclusionlast_triggered_at: .run_started_at -
Click Save & Resync to apply the mapping.
The workflow run selector filters to main, master, and production branches only. This ensures reliability metrics reflect production-relevant pipeline health. If your repositories use different default branch names, update the IN(...) list accordingly.
Now we'll update the GitLab integration mapping to populate the pipeline and job blueprints. The mapping filters pipelines and jobs to the default branch and last 30 days.
-
Go to your Data Source page.
-
Select the GitLab integration.
-
Add the
pipelineresource block in the mapping:Pipeline mapping (click to expand)
- kind: pipelineselector:query: >-(.ref | IN("main", "master", "production")) and((.created_at | fromdateiso8601) > (now - 2592000))port:entity:mappings:identifier: .id | tostringtitle: >-(.__project.name // .__project.path_with_namespace) +" #" + (.id | tostring)blueprint: '"gitlabPipeline"'properties:status: .statuscreatedAt: .created_atupdatedAt: .updated_atlink: .web_urlsource: .sourceref: .refrelations:repository: .__project.path_with_namespace -
Add the
jobresource block. This mapping creates job entities from pipeline jobs filtered to the default branch and last 30 days:Job mapping (click to expand)
- kind: jobselector:query: >-(.pipeline.ref | IN("main", "master", "production")) and((.created_at | fromdateiso8601) > (now - 2592000))port:entity:mappings:identifier: .id | tostringtitle: .nameblueprint: '"gitlabJob"'properties:status: .statusstage: .stagestartedAt: .started_atfinishedAt: .finished_atlink: .web_urlduration: .durationrelations:pipeline: .pipeline.id | tostringrepository: >-.web_url | split("/-/") | .[0] | split("://") |.[1] | split("/") | .[1:] | join("/") -
Click Save & Resync to apply the mapping.
The pipeline and job selectors filter to main, master, and production branches only. This ensures reliability metrics reflect production-relevant pipeline health. If your repositories use different default branch names, update the IN(...) list accordingly.
Set up GitLab service relations
The service relation on gitlabJob is populated by two complementary mechanisms:
- Mapping (ingest-time): The integration mapping sets
serviceat ingest via a search query ongitlab_repository_identifier, linking each job directly to the matching service entity. - Automation (post-ingest): The
set_gitlab_job_relationsautomation is supplementary and handles the case where a service'sgitlab_repositoryrelation changes post-ingest. It fires whenever a service'sgitlab_repositoryrelation is updated and bulk-updates all matchinggitlabJobentities.
gitlab_repository relation on serviceThis automation requires the service blueprint to have a gitlab_repository relation pointing to gitlabRepository. This relation is set up by the Create foundational Engineering Intelligence data model guide. Once set for a service, the automation below will populate the service relation on all matching gitlabJob entities.
- Go to the automations page.
- Click + Automation.
- Click the
{...} Edit JSONbutton. - Paste the following JSON and click Save:
Set GitLab Job relations automation (click to expand)
{
  "identifier": "set_gitlab_job_relations",
  "title": "Set GitLab Job relations",
  "trigger": {
    "type": "automation",
    "event": {"type": "ANY_ENTITY_CHANGE", "blueprintIdentifier": "service"},
    "condition": {
      "type": "JQ",
      "expressions": [
        ".diff.before.relations.gitlab_repository != .diff.after.relations.gitlab_repository",
        ".diff.after.relations.gitlab_repository != null"
      ],
      "combinator": "and"
    }
  },
  "invocationMethod": {
    "type": "WEBHOOK",
    "url": "https://api.port.io/v1/migrations",
    "agent": false,
    "synchronized": true,
    "method": "POST",
    "headers": {"Content-Type": "application/json", "RUN_ID": "{{ .run.id }}"},
    "body": {
      "sourceBlueprint": "gitlabJob",
      "mapping": {
        "blueprint": "gitlabJob",
        "filter": ".relations.repository == \"{{ .event.diff.after.relations.gitlab_repository }}\"",
        "entity": {
          "identifier": ".identifier",
          "relations": {"service": "\"{{ .event.context.entityIdentifier }}\""}
        }
      }
    }
  }
}
The Azure DevOps integration already maps kind: build and kind: pipeline-stage resources to the azureDevopsBuild and azureDevopsPipelineStage blueprints. The service relation on azureDevopsBuild is populated by two complementary mechanisms:
- Mapping (ingest-time): The integration mapping sets
serviceat ingest via a search query onado_repository_id, linking each build to the matching service entity. - Automation (post-ingest): The
set_ado_build_relationsautomation fires when a service'sazureDevopsRepositoryrelation changes and bulk-updates allazureDevopsBuildentities whoserepositoryrelation matches.
We need to verify the existing mapping includes the service relation on the build (via the repository) so that aggregation properties on the service blueprint can count builds correctly.
-
Go to your Data Source page.
-
Select the Azure DevOps integration.
-
Find the
buildresource block in the mapping and verify it matches the following (add theservicerelation if it is missing):Build mapping (click to expand)
- kind: buildselector:query: 'true'port:entity:mappings:identifier: >-.__project.id + "/" + (.id | tostring) | gsub(" "; "")title: .buildNumberblueprint: '"azureDevopsBuild"'properties:status: .statusresult: .resultqueueTime: .queueTimestartTime: .startTimefinishTime: .finishTimedefinitionName: .definition.namerequestedFor: .requestedFor.displayNamelink: ._links.web.hrefrelations:project: .__project.id | gsub(" "; "")repository: .repository.id -
Find the
pipeline-stageresource block and verify it matches the following:Pipeline stage mapping (click to expand)
- kind: pipeline-stageselector:query: 'true'port:entity:mappings:identifier: >-.__project.id + "/" + (.__build.id | tostring) + "/" +(.id | tostring) | gsub(" "; "")title: .nameblueprint: '"azureDevopsPipelineStage"'properties:state: .stateresult: .resultstartTime: .startTimefinishTime: .finishTimestageType: .typerelations:project: .__project.id | gsub(" "; "")build: >-(.__project.id + "/" + (.__build.id | tostring)) |gsub(" "; "") -
Click Save & Resync to apply the mapping.
Set up Azure DevOps build service relations
To ensure azureDevopsBuild entities are linked to the correct service when a service's repository relation changes, set up the following automation:
azureDevopsRepository relation on serviceThis automation requires the service blueprint to have an azureDevopsRepository relation pointing to azureDevopsRepository. This relation is set up by the Create foundational Engineering Intelligence data model guide.
- Go to the automations page.
- Click + Automation.
- Click the
{...} Edit JSONbutton. - Paste the following JSON and click Save:
Set Azure DevOps Build relations automation (click to expand)
{
  "identifier": "set_ado_build_relations",
  "title": "Set Azure DevOps Build relations",
  "trigger": {
    "type": "automation",
    "event": {"type": "ANY_ENTITY_CHANGE", "blueprintIdentifier": "service"},
    "condition": {
      "type": "JQ",
      "expressions": [
        ".diff.before.relations.azureDevopsRepository != .diff.after.relations.azureDevopsRepository",
        ".diff.after.relations.azureDevopsRepository != null"
      ],
      "combinator": "and"
    }
  },
  "invocationMethod": {
    "type": "WEBHOOK",
    "url": "https://api.port.io/v1/migrations",
    "agent": false,
    "synchronized": true,
    "method": "POST",
    "headers": {"Content-Type": "application/json", "RUN_ID": "{{ .run.id }}"},
    "body": {
      "sourceBlueprint": "azureDevopsBuild",
      "mapping": {
        "blueprint": "azureDevopsBuild",
        "filter": ".relations.repository == \"{{ .event.diff.after.relations.azureDevopsRepository }}\"",
        "entity": {
          "identifier": ".identifier",
          "relations": {"service": "\"{{ .event.context.entityIdentifier }}\""}
        }
      }
    }
  }
}
Visualize metrics
We will create a dedicated dashboard to monitor pipeline reliability metrics using Port's customizable widgets.
Create the dashboard
First, let's create an Engineering Intelligence folder (if it doesn't already exist) to organize your dashboards, then add the Pipeline Reliability dashboard inside it:
- Navigate to your context lake.
- Click on the
+button in the left sidebar. - Select New folder.
- Name the folder Engineering Intelligence and click Create.
- Inside the Engineering Intelligence folder, click
+again. - Select New dashboard.
- Name the dashboard Pipeline Reliability and click Create.
Add widgets
You can populate the dashboard using either an API script or by manually creating each widget through the UI.
- API script
- Manual setup
The fastest way to set up the dashboard is by using Port's API to create all widgets at once.
Get your Port API token
-
Open the Credentials modal.
-
Click Generate API token.
-
Copy the generated token and store it as an environment variable:
export PORT_ACCESS_TOKEN="YOUR_GENERATED_TOKEN"
If Port is hosted in the EU region, replace api.port.io with api.port-eu.io in the dashboard creation command below.
Create the dashboard with widgets
Save the following JSON to a file named reliability_dashboard.json:
- GitHub
- GitLab
- Azure DevOps
Dashboard JSON payload (click to expand)
{
  "identifier": "reliability",
  "title": "Reliability",
  "icon": "Apps",
  "type": "dashboard",
  "description": "Based on default branch (main/master/production) workflow runs only. Adjust the integration mapping selector to include other branches if needed.",
  "parent": "engineering_intelligence",
  "widgets": [
    {
      "id": "reliabilityDashboardWidget",
      "type": "dashboard-widget",
      "layout": [
        {
          "height": 512,
          "columns": [
            {"id": "overallFailureRate", "size": 3},
            {"id": "totalFailingWorkflows", "size": 3},
            {"id": "failureTrend", "size": 3},
            {"id": "workflowRunResults", "size": 3}
          ]
        },
        {
          "height": 482,
          "columns": [
            {"id": "topFailingWorkflows", "size": 4},
            {"id": "teamFailureBar", "size": 4},
            {"id": "serviceFailureBar", "size": 4}
          ]
        },
        {
          "height": 400,
          "columns": [
            {"id": "teamReliabilityTable", "size": 12}
          ]
        },
        {
          "height": 400,
          "columns": [
            {"id": "groupReliabilityTable", "size": 12}
          ]
        },
        {
          "height": 400,
          "columns": [
            {"id": "serviceReliabilityTable", "size": 12}
          ]
        },
        {
          "height": 488,
          "columns": [
            {"id": "failedRunsTable", "size": 12}
          ]
        }
      ],
      "widgets": [
        {
          "id": "overallFailureRate",
          "type": "entities-number-chart",
          "title": "Overall failure rate % (last month)",
          "icon": "Metric",
          "description": "Percentage of workflow runs that failed across all services in the organization",
          "blueprint": "organization",
          "chartType": "displaySingleProperty",
          "entity": "default-org",
          "property": "monthly_workflow_failure_rate",
          "unit": "%",
          "unitAlignment": "right"
        },
        {
          "id": "totalFailingWorkflows",
          "type": "entities-number-chart",
          "title": "Total Failing Workflows",
          "icon": "Metric",
          "description": "Workflows whose current result is in failure state",
          "blueprint": "githubWorkflow",
          "chartType": "countEntities",
          "calculationBy": "entities",
          "func": "count",
          "unit": "none",
          "dataset": {
            "combinator": "and",
            "rules": [
              {"property": "result", "operator": "=", "value": "failure"}
            ]
          }
        },
        {
          "id": "failureTrend",
          "type": "line-chart",
          "title": "Workflow Runs Failure Trend (Weekly)",
          "icon": "LineChart",
          "description": "Weekly trend of failed workflow runs over the past 6 months",
          "blueprint": "githubWorkflowRun",
          "chartType": "countEntities",
          "func": "count",
          "measureTimeBy": "runStartedAt",
          "timeInterval": "isoWeek",
          "timeRange": {"preset": "last6Months"},
          "xAxisTitle": "",
          "yAxisTitle": "# Failed Workflows",
          "dataset": {
            "combinator": "and",
            "rules": [
              {"property": "conclusion", "operator": "=", "value": "failure"}
            ]
          }
        },
        {
          "id": "workflowRunResults",
          "type": "entities-pie-chart",
          "title": "Workflow Run Results (Last Month)",
          "icon": "Pie",
          "description": "Breakdown of all workflow runs by conclusion status across the organization",
          "blueprint": "githubWorkflowRun",
          "property": "property#conclusion",
          "dataset": {
            "combinator": "and",
            "rules": [
              {"property": "createdAt", "operator": "between", "value": {"preset": "lastMonth"}}
            ]
          }
        },
        {
          "id": "topFailingWorkflows",
          "type": "bar-chart",
          "title": "Top Failing Workflows (Last 30 Days)",
          "icon": "Bar",
          "description": "Workflows with the most failed runs (last 30 days)",
          "blueprint": "githubWorkflowRun",
          "property": "mirror-property#workflow_name",
          "dataset": {
            "combinator": "and",
            "rules": [
              {"property": "runStartedAt", "operator": "between", "value": {"preset": "lastMonth"}},
              {"property": "conclusion", "operator": "=", "value": "failure"}
            ]
          }
        },
        {
          "id": "teamFailureBar",
          "type": "bar-chart",
          "title": "Teams with Most Workflow Failures (Last 30 Days)",
          "icon": "Bar",
          "description": "Distribution of failed workflow runs by team",
          "blueprint": "githubWorkflowRun",
          "property": "$team",
          "dataset": {
            "combinator": "and",
            "rules": [
              {"property": "runStartedAt", "operator": "between", "value": {"preset": "lastMonth"}},
              {"property": "conclusion", "operator": "=", "value": "failure"}
            ]
          }
        },
        {
          "id": "serviceFailureBar",
          "type": "bar-chart",
          "title": "Services with Most Workflow Failures (Last 30 Days)",
          "icon": "Bar",
          "description": "Distribution of failed workflow runs by service",
          "blueprint": "githubWorkflowRun",
          "property": "mirror-property#service_name",
          "dataset": {
            "combinator": "and",
            "rules": [
              {"property": "conclusion", "operator": "=", "value": "failure"},
              {"property": "runStartedAt", "operator": "between", "value": {"preset": "lastMonth"}}
            ]
          }
        },
        {
          "id": "teamReliabilityTable",
          "type": "table-entities-explorer",
          "displayMode": "widget",
          "title": "Team Reliability Overview",
          "icon": "Table",
          "description": "Workflow failure rates per team",
          "blueprint": "_team",
          "dataset": {"combinator": "and", "rules": [{"operator": "=", "property": "type", "value": "team"}]},
          "excludedFields": [],
          "blueprintConfig": {
            "_team": {
              "groupSettings": {"groupBy": []},
              "propertiesSettings": {
                "order": ["$title", "github_workflow_runs_30d", "github_failed_workflow_runs_30d", "monthly_workflow_failure_rate", "weekly_workflow_failure_rate", "failure_rate_trend", "github_workflow_runs_7d", "github_failed_workflow_runs_7d", "gitlab_pipeline_jobs_30d", "gitlab_failed_pipeline_jobs_30d", "monthly_pipeline_job_failure_rate", "weekly_pipeline_job_failure_rate", "pipeline_job_failure_rate_trend", "gitlab_pipeline_jobs_7d", "gitlab_failed_pipeline_jobs_7d", "ado_pipeline_builds_30d", "ado_failed_pipeline_builds_30d", "monthly_pipeline_build_failure_rate", "weekly_pipeline_build_failure_rate", "pipeline_build_failure_rate_trend", "ado_pipeline_builds_7d", "ado_failed_pipeline_builds_7d"],
                "shown": ["$title", "github_workflow_runs_30d", "github_failed_workflow_runs_30d", "monthly_workflow_failure_rate", "weekly_workflow_failure_rate", "failure_rate_trend", "github_workflow_runs_7d", "github_failed_workflow_runs_7d", "gitlab_pipeline_jobs_30d", "gitlab_failed_pipeline_jobs_30d", "monthly_pipeline_job_failure_rate", "weekly_pipeline_job_failure_rate", "pipeline_job_failure_rate_trend", "gitlab_pipeline_jobs_7d", "gitlab_failed_pipeline_jobs_7d", "ado_pipeline_builds_30d", "ado_failed_pipeline_builds_30d", "monthly_pipeline_build_failure_rate", "weekly_pipeline_build_failure_rate", "pipeline_build_failure_rate_trend", "ado_pipeline_builds_7d", "ado_failed_pipeline_builds_7d"]
              },
              "filterSettings": {"filterBy": {"combinator": "and", "rules": []}},
              "sortSettings": {"sortBy": []}
            }
          }
        },
        {
          "id": "groupReliabilityTable",
          "type": "table-entities-explorer",
          "displayMode": "widget",
          "title": "Group Reliability Overview",
          "icon": "Table",
          "description": "Workflow failure rates per group",
          "blueprint": "_team",
          "dataset": {"combinator": "and", "rules": [{"operator": "=", "property": "type", "value": "group"}]},
          "excludedFields": [],
          "blueprintConfig": {
            "_team": {
              "groupSettings": {"groupBy": []},
              "propertiesSettings": {
                "order": ["$title", "github_workflow_runs_30d", "github_failed_workflow_runs_30d", "monthly_workflow_failure_rate", "weekly_workflow_failure_rate", "failure_rate_trend", "github_workflow_runs_7d", "github_failed_workflow_runs_7d", "gitlab_pipeline_jobs_30d", "gitlab_failed_pipeline_jobs_30d", "monthly_pipeline_job_failure_rate", "weekly_pipeline_job_failure_rate", "pipeline_job_failure_rate_trend", "gitlab_pipeline_jobs_7d", "gitlab_failed_pipeline_jobs_7d", "ado_pipeline_builds_30d", "ado_failed_pipeline_builds_30d", "monthly_pipeline_build_failure_rate", "weekly_pipeline_build_failure_rate", "pipeline_build_failure_rate_trend", "ado_pipeline_builds_7d", "ado_failed_pipeline_builds_7d"],
                "shown": ["$title", "github_workflow_runs_30d", "github_failed_workflow_runs_30d", "monthly_workflow_failure_rate", "weekly_workflow_failure_rate", "failure_rate_trend", "github_workflow_runs_7d", "github_failed_workflow_runs_7d", "gitlab_pipeline_jobs_30d", "gitlab_failed_pipeline_jobs_30d", "monthly_pipeline_job_failure_rate", "weekly_pipeline_job_failure_rate", "pipeline_job_failure_rate_trend", "gitlab_pipeline_jobs_7d", "gitlab_failed_pipeline_jobs_7d", "ado_pipeline_builds_30d", "ado_failed_pipeline_builds_30d", "monthly_pipeline_build_failure_rate", "weekly_pipeline_build_failure_rate", "pipeline_build_failure_rate_trend", "ado_pipeline_builds_7d", "ado_failed_pipeline_builds_7d"]
              },
              "filterSettings": {"filterBy": {"combinator": "and", "rules": []}},
              "sortSettings": {"sortBy": []}
            }
          }
        },
        {
          "id": "serviceReliabilityTable",
          "type": "table-entities-explorer",
          "displayMode": "widget",
          "title": "Service Reliability Overview",
          "icon": "Table",
          "description": "Workflow failure rates per service",
          "blueprint": "service",
          "dataset": {"combinator": "and", "rules": []},
          "excludedFields": [],
          "blueprintConfig": {
            "service": {
              "groupSettings": {"groupBy": []},
              "propertiesSettings": {
                "order": ["$title", "github_workflow_runs_30d", "github_failed_workflow_runs_30d", "github_monthly_workflow_failure_rate", "github_weekly_workflow_failure_rate", "github_failure_rate_trend", "github_workflow_runs_7d", "github_failed_workflow_runs_7d", "gitlab_pipeline_jobs_30d", "gitlab_failed_pipeline_jobs_30d", "gitlab_monthly_pipeline_job_failure_rate", "gitlab_weekly_pipeline_job_failure_rate", "gitlab_pipeline_job_failure_rate_trend", "gitlab_pipeline_jobs_7d", "gitlab_failed_pipeline_jobs_7d", "ado_pipeline_builds_30d", "ado_failed_pipeline_builds_30d", "ado_monthly_pipeline_build_failure_rate", "ado_weekly_pipeline_build_failure_rate", "ado_pipeline_build_failure_rate_trend", "ado_pipeline_builds_7d", "ado_failed_pipeline_builds_7d"],
                "shown": ["$title", "github_workflow_runs_30d", "github_failed_workflow_runs_30d", "github_monthly_workflow_failure_rate", "github_weekly_workflow_failure_rate", "github_failure_rate_trend", "github_workflow_runs_7d", "github_failed_workflow_runs_7d", "gitlab_pipeline_jobs_30d", "gitlab_failed_pipeline_jobs_30d", "gitlab_monthly_pipeline_job_failure_rate", "gitlab_weekly_pipeline_job_failure_rate", "gitlab_pipeline_job_failure_rate_trend", "gitlab_pipeline_jobs_7d", "gitlab_failed_pipeline_jobs_7d", "ado_pipeline_builds_30d", "ado_failed_pipeline_builds_30d", "ado_monthly_pipeline_build_failure_rate", "ado_weekly_pipeline_build_failure_rate", "ado_pipeline_build_failure_rate_trend", "ado_pipeline_builds_7d", "ado_failed_pipeline_builds_7d"]
              },
              "filterSettings": {"filterBy": {"combinator": "and", "rules": []}},
              "sortSettings": {"sortBy": []}
            }
          }
        },
        {
          "id": "failedRunsTable",
          "type": "table-entities-explorer",
          "displayMode": "widget",
          "title": "Failed Workflow Runs (last month)",
          "icon": "Table",
          "description": "All workflow runs that concluded with failure",
          "blueprint": "githubWorkflowRun",
          "dataset": {
            "combinator": "and",
            "rules": [
              {"property": "workflow_current_result", "operator": "=", "value": "failure"},
              {"property": "createdAt", "operator": "between", "value": {"preset": "lastMonth"}}
            ]
          },
          "excludedFields": [],
          "blueprintConfig": {
            "githubWorkflowRun": {
              "groupSettings": {"groupBy": ["service_name"]},
              "propertiesSettings": {
                "order": ["repository", "service_name", "$team", "$title", "link", "workflow", "runNumber"],
                "shown": ["$title", "link", "runNumber", "workflow"]
              },
              "filterSettings": {
                "filterBy": {
                  "combinator": "and",
                  "rules": [
                    {"property": "conclusion", "operator": "=", "value": "failure"},
                    {"property": "workflow_current_result", "operator": "=", "value": "failure"}
                  ]
                }
              },
              "sortSettings": {"sortBy": []}
            }
          }
        }
      ]
    }
  ]
}
Dashboard JSON payload (click to expand)
{
  "identifier": "reliability",
  "title": "Reliability",
  "icon": "Apps",
  "type": "dashboard",
  "description": "Based on GitLab pipeline jobs for default branch (main/master/production) only. Adjust the integration mapping selector to include other branches if needed.",
  "parent": "engineering_intelligence",
  "widgets": [
    {
      "id": "reliabilityDashboardWidget",
      "type": "dashboard-widget",
      "layout": [
        {
          "height": 466,
          "columns": [
            {"id": "reliabilityAgent", "size": 12}
          ]
        },
        {
          "height": 512,
          "columns": [
            {"id": "overallFailureRate", "size": 3},
            {"id": "totalFailingPipelines", "size": 3},
            {"id": "failureTrend", "size": 3},
            {"id": "jobResults", "size": 3}
          ]
        },
        {
          "height": 482,
          "columns": [
            {"id": "failingStages", "size": 4},
            {"id": "teamFailureBar", "size": 4},
            {"id": "serviceFailureBar", "size": 4}
          ]
        },
        {
          "height": 400,
          "columns": [
            {"id": "teamReliabilityTable", "size": 12}
          ]
        },
        {
          "height": 400,
          "columns": [
            {"id": "groupReliabilityTable", "size": 12}
          ]
        },
        {
          "height": 400,
          "columns": [
            {"id": "serviceReliabilityTable", "size": 12}
          ]
        },
        {
          "height": 488,
          "columns": [
            {"id": "failedJobsTable", "size": 12}
          ]
        }
      ],
      "widgets": [
        {
          "id": "reliabilityAgent",
          "type": "ai-agent",
          "title": "Reliability Agent",
          "agentIdentifier": "reliability_agent",
          "useMCP": true
        },
        {
          "id": "overallFailureRate",
          "type": "entities-number-chart",
          "title": "Overall failure rate % (last month)",
          "icon": "Metric",
          "description": "Percentage of pipeline jobs that failed across all services in the organization",
          "emptyStateText": "",
          "blueprint": "organization",
          "chartType": "displaySingleProperty",
          "entity": "default-org",
          "property": "monthly_pipeline_job_failure_rate",
          "unit": "%",
          "unitAlignment": "right"
        },
        {
          "id": "totalFailingPipelines",
          "type": "entities-number-chart",
          "title": "Total Failing Pipelines",
          "icon": "Metric",
          "description": "Pipelines whose current status is failed",
          "blueprint": "gitlabPipeline",
          "chartType": "countEntities",
          "calculationBy": "entities",
          "func": "count",
          "unit": "none",
          "dataset": {
            "combinator": "and",
            "rules": [
              {"property": "status", "operator": "=", "value": "failed"}
            ]
          }
        },
        {
          "id": "failureTrend",
          "type": "line-chart",
          "title": "Pipeline Job Failure Trend (Weekly)",
          "icon": "LineChart",
          "description": "Weekly trend of failed pipeline jobs over the past 6 months",
          "blueprint": "gitlabJob",
          "chartType": "countEntities",
          "func": "count",
          "measureTimeBy": "startedAt",
          "timeInterval": "isoWeek",
          "timeRange": {"preset": "last6Months"},
          "xAxisTitle": "",
          "yAxisTitle": "# Failed Jobs",
          "dataset": {
            "combinator": "and",
            "rules": [
              {"property": "status", "operator": "=", "value": "failed"}
            ]
          }
        },
        {
          "id": "jobResults",
          "type": "entities-pie-chart",
          "title": "Pipeline Job Results (Last Month)",
          "icon": "Pie",
          "description": "Breakdown of all pipeline jobs by status across the organization",
          "blueprint": "gitlabJob",
          "property": "property#status",
          "dataset": {
            "combinator": "and",
            "rules": [
              {"property": "startedAt", "operator": "between", "value": {"preset": "lastMonth"}}
            ]
          }
        },
        {
          "id": "failingStages",
          "type": "bar-chart",
          "title": "Most Failing Stages (Last 30 Days)",
          "icon": "Bar",
          "description": "Pipeline stages with the most failed jobs (last 30 days)",
          "blueprint": "gitlabJob",
          "property": "property#stage",
          "dataset": {
            "combinator": "and",
            "rules": [
              {"property": "startedAt", "operator": "between", "value": {"preset": "lastMonth"}},
              {"property": "status", "operator": "=", "value": "failed"}
            ]
          }
        },
        {
          "id": "teamFailureBar",
          "type": "bar-chart",
          "title": "Teams with Most Pipeline Jobs Failures (Last 30 Days)",
          "icon": "Bar",
          "description": "Distribution of failed pipeline jobs by team",
          "blueprint": "gitlabJob",
          "property": "$team",
          "dataset": {
            "combinator": "and",
            "rules": [
              {"property": "startedAt", "operator": "between", "value": {"preset": "lastMonth"}},
              {"property": "status", "operator": "=", "value": "failed"}
            ]
          }
        },
        {
          "id": "serviceFailureBar",
          "type": "bar-chart",
          "title": "Services with Most Pipeline Jobs Failures (Last 30 Days)",
          "icon": "Bar",
          "description": "Distribution of failed pipeline jobs by service",
          "blueprint": "gitlabJob",
          "property": "mirror-property#service_name",
          "dataset": {
            "combinator": "and",
            "rules": [
              {"property": "status", "operator": "=", "value": "failed"},
              {"property": "startedAt", "operator": "between", "value": {"preset": "lastMonth"}}
            ]
          }
        },
        {
          "id": "teamReliabilityTable",
          "type": "table-entities-explorer",
          "displayMode": "widget",
          "title": "Team Reliability Overview",
          "icon": "Table",
          "description": "Pipeline job failure rates per team",
          "blueprint": "_team",
          "dataset": {"combinator": "and", "rules": [{"operator": "=", "property": "type", "value": "team"}]},
          "excludedFields": [],
          "blueprintConfig": {
            "_team": {
              "groupSettings": {"groupBy": []},
              "propertiesSettings": {
                "order": ["$title", "github_workflow_runs_30d", "github_failed_workflow_runs_30d", "monthly_workflow_failure_rate", "weekly_workflow_failure_rate", "failure_rate_trend", "github_workflow_runs_7d", "github_failed_workflow_runs_7d", "gitlab_pipeline_jobs_30d", "gitlab_failed_pipeline_jobs_30d", "monthly_pipeline_job_failure_rate", "weekly_pipeline_job_failure_rate", "pipeline_job_failure_rate_trend", "gitlab_pipeline_jobs_7d", "gitlab_failed_pipeline_jobs_7d", "ado_pipeline_builds_30d", "ado_failed_pipeline_builds_30d", "monthly_pipeline_build_failure_rate", "weekly_pipeline_build_failure_rate", "pipeline_build_failure_rate_trend", "ado_pipeline_builds_7d", "ado_failed_pipeline_builds_7d"],
                "shown": ["$title", "github_workflow_runs_30d", "github_failed_workflow_runs_30d", "monthly_workflow_failure_rate", "weekly_workflow_failure_rate", "failure_rate_trend", "github_workflow_runs_7d", "github_failed_workflow_runs_7d", "gitlab_pipeline_jobs_30d", "gitlab_failed_pipeline_jobs_30d", "monthly_pipeline_job_failure_rate", "weekly_pipeline_job_failure_rate", "pipeline_job_failure_rate_trend", "gitlab_pipeline_jobs_7d", "gitlab_failed_pipeline_jobs_7d", "ado_pipeline_builds_30d", "ado_failed_pipeline_builds_30d", "monthly_pipeline_build_failure_rate", "weekly_pipeline_build_failure_rate", "pipeline_build_failure_rate_trend", "ado_pipeline_builds_7d", "ado_failed_pipeline_builds_7d"]
              },
              "filterSettings": {"filterBy": {"combinator": "and", "rules": []}},
              "sortSettings": {"sortBy": []}
            }
          }
        },
        {
          "id": "groupReliabilityTable",
          "type": "table-entities-explorer",
          "displayMode": "widget",
          "title": "Group Reliability Overview",
          "icon": "Table",
          "description": "Pipeline job failure rates per group",
          "blueprint": "_team",
          "dataset": {"combinator": "and", "rules": [{"operator": "=", "property": "type", "value": "group"}]},
          "excludedFields": [],
          "blueprintConfig": {
            "_team": {
              "groupSettings": {"groupBy": []},
              "propertiesSettings": {
                "order": ["$title", "github_workflow_runs_30d", "github_failed_workflow_runs_30d", "monthly_workflow_failure_rate", "weekly_workflow_failure_rate", "failure_rate_trend", "github_workflow_runs_7d", "github_failed_workflow_runs_7d", "gitlab_pipeline_jobs_30d", "gitlab_failed_pipeline_jobs_30d", "monthly_pipeline_job_failure_rate", "weekly_pipeline_job_failure_rate", "pipeline_job_failure_rate_trend", "gitlab_pipeline_jobs_7d", "gitlab_failed_pipeline_jobs_7d", "ado_pipeline_builds_30d", "ado_failed_pipeline_builds_30d", "monthly_pipeline_build_failure_rate", "weekly_pipeline_build_failure_rate", "pipeline_build_failure_rate_trend", "ado_pipeline_builds_7d", "ado_failed_pipeline_builds_7d"],
                "shown": ["$title", "github_workflow_runs_30d", "github_failed_workflow_runs_30d", "monthly_workflow_failure_rate", "weekly_workflow_failure_rate", "failure_rate_trend", "github_workflow_runs_7d", "github_failed_workflow_runs_7d", "gitlab_pipeline_jobs_30d", "gitlab_failed_pipeline_jobs_30d", "monthly_pipeline_job_failure_rate", "weekly_pipeline_job_failure_rate", "pipeline_job_failure_rate_trend", "gitlab_pipeline_jobs_7d", "gitlab_failed_pipeline_jobs_7d", "ado_pipeline_builds_30d", "ado_failed_pipeline_builds_30d", "monthly_pipeline_build_failure_rate", "weekly_pipeline_build_failure_rate", "pipeline_build_failure_rate_trend", "ado_pipeline_builds_7d", "ado_failed_pipeline_builds_7d"]
              },
              "filterSettings": {"filterBy": {"combinator": "and", "rules": []}},
              "sortSettings": {"sortBy": []}
            }
          }
        },
        {
          "id": "serviceReliabilityTable",
          "type": "table-entities-explorer",
          "displayMode": "widget",
          "title": "Service Reliability Overview",
          "icon": "Table",
          "description": "Pipeline job failure rates per service",
          "blueprint": "service",
          "dataset": {"combinator": "and", "rules": []},
          "excludedFields": [],
          "blueprintConfig": {
            "service": {
              "groupSettings": {"groupBy": []},
              "propertiesSettings": {
                "order": ["$title", "github_workflow_runs_30d", "github_failed_workflow_runs_30d", "github_monthly_workflow_failure_rate", "github_weekly_workflow_failure_rate", "github_failure_rate_trend", "github_workflow_runs_7d", "github_failed_workflow_runs_7d", "gitlab_pipeline_jobs_30d", "gitlab_failed_pipeline_jobs_30d", "gitlab_monthly_pipeline_job_failure_rate", "gitlab_weekly_pipeline_job_failure_rate", "gitlab_pipeline_job_failure_rate_trend", "gitlab_pipeline_jobs_7d", "gitlab_failed_pipeline_jobs_7d", "ado_pipeline_builds_30d", "ado_failed_pipeline_builds_30d", "ado_monthly_pipeline_build_failure_rate", "ado_weekly_pipeline_build_failure_rate", "ado_pipeline_build_failure_rate_trend", "ado_pipeline_builds_7d", "ado_failed_pipeline_builds_7d"],
                "shown": ["$title", "github_workflow_runs_30d", "github_failed_workflow_runs_30d", "github_monthly_workflow_failure_rate", "github_weekly_workflow_failure_rate", "github_failure_rate_trend", "github_workflow_runs_7d", "github_failed_workflow_runs_7d", "gitlab_pipeline_jobs_30d", "gitlab_failed_pipeline_jobs_30d", "gitlab_monthly_pipeline_job_failure_rate", "gitlab_weekly_pipeline_job_failure_rate", "gitlab_pipeline_job_failure_rate_trend", "gitlab_pipeline_jobs_7d", "gitlab_failed_pipeline_jobs_7d", "ado_pipeline_builds_30d", "ado_failed_pipeline_builds_30d", "ado_monthly_pipeline_build_failure_rate", "ado_weekly_pipeline_build_failure_rate", "ado_pipeline_build_failure_rate_trend", "ado_pipeline_builds_7d", "ado_failed_pipeline_builds_7d"]
              },
              "filterSettings": {"filterBy": {"combinator": "and", "rules": []}},
              "sortSettings": {"sortBy": []}
            }
          }
        },
        {
          "id": "failedJobsTable",
          "type": "table-entities-explorer",
          "displayMode": "widget",
          "title": "Failed Pipeline Jobs (last month)",
          "icon": "Table",
          "description": "All pipeline jobs that concluded with failure",
          "blueprint": "gitlabJob",
          "dataset": {
            "combinator": "and",
            "rules": [
              {"property": "status", "operator": "=", "value": "failed"},
              {"property": "startedAt", "operator": "between", "value": {"preset": "lastMonth"}}
            ]
          },
          "excludedFields": [],
          "blueprintConfig": {
            "gitlabJob": {
              "groupSettings": {"groupBy": ["service_name"]},
              "propertiesSettings": {
                "order": ["repository", "service_name", "$team", "$title", "link", "pipeline", "stage"],
                "shown": ["$title", "link", "stage", "pipeline"]
              },
              "filterSettings": {"filterBy": {"combinator": "and", "rules": []}},
              "sortSettings": {"sortBy": []}
            }
          }
        }
      ]
    }
  ]
}
Dashboard JSON payload (click to expand)
{
  "identifier": "reliability",
  "title": "Reliability",
  "icon": "Apps",
  "type": "dashboard",
  "description": "Based on Azure DevOps builds and pipeline stages. Adjust the integration mapping selector to scope projects, branches, or environments as needed.",
  "parent": "engineering_intelligence",
  "widgets": [
    {
      "id": "reliabilityDashboardWidget",
      "type": "dashboard-widget",
      "layout": [
        {
          "height": 466,
          "columns": [
            {"id": "reliabilityAgent", "size": 12}
          ]
        },
        {
          "height": 512,
          "columns": [
            {"id": "overallFailureRate", "size": 3},
            {"id": "totalFailedBuilds", "size": 3},
            {"id": "failureTrend", "size": 3},
            {"id": "buildResults", "size": 3}
          ]
        },
        {
          "height": 482,
          "columns": [
            {"id": "topFailingStages", "size": 4},
            {"id": "teamFailureBar", "size": 4},
            {"id": "serviceFailureBar", "size": 4}
          ]
        },
        {
          "height": 400,
          "columns": [
            {"id": "teamReliabilityTable", "size": 12}
          ]
        },
        {
          "height": 400,
          "columns": [
            {"id": "groupReliabilityTable", "size": 12}
          ]
        },
        {
          "height": 400,
          "columns": [
            {"id": "serviceReliabilityTable", "size": 12}
          ]
        },
        {
          "height": 488,
          "columns": [
            {"id": "failedBuildsTable", "size": 12}
          ]
        }
      ],
      "widgets": [
        {
          "id": "reliabilityAgent",
          "type": "ai-agent",
          "title": "Reliability Agent",
          "agentIdentifier": "reliability_agent",
          "useMCP": true
        },
        {
          "id": "overallFailureRate",
          "type": "entities-number-chart",
          "title": "Overall failure rate % (last month)",
          "icon": "Metric",
          "description": "Percentage of pipeline builds that failed across all services in the organization",
          "emptyStateText": "",
          "blueprint": "organization",
          "chartType": "displaySingleProperty",
          "entity": "default-org",
          "property": "monthly_pipeline_build_failure_rate",
          "unit": "%",
          "unitAlignment": "right"
        },
        {
          "id": "totalFailedBuilds",
          "type": "entities-number-chart",
          "title": "Total Failed Builds (Last Month)",
          "icon": "Metric",
          "description": "Number of builds that failed in the last 30 days",
          "blueprint": "azureDevopsBuild",
          "chartType": "countEntities",
          "calculationBy": "entities",
          "func": "count",
          "unit": "none",
          "dataset": {
            "combinator": "and",
            "rules": [
              {"operator": "=", "property": "result", "value": "failed"},
              {"operator": "between", "property": "$createdAt", "value": {"preset": "lastMonth"}}
            ]
          }
        },
        {
          "id": "failureTrend",
          "type": "line-chart",
          "title": "Build Failure Trend (Weekly)",
          "icon": "LineChart",
          "description": "Weekly trend of failed builds over the past 6 months",
          "blueprint": "azureDevopsBuild",
          "chartType": "countEntities",
          "func": "count",
          "measureTimeBy": "startTime",
          "timeInterval": "isoWeek",
          "timeRange": {"preset": "last6Months"},
          "xAxisTitle": "",
          "yAxisTitle": "# Failed Builds",
          "dataset": {
            "combinator": "and",
            "rules": [
              {"operator": "=", "property": "result", "value": "failed"}
            ]
          }
        },
        {
          "id": "buildResults",
          "type": "entities-pie-chart",
          "title": "Build Results (Last Month)",
          "icon": "Pie",
          "description": "Breakdown of all builds by result status across the organization",
          "blueprint": "azureDevopsBuild",
          "property": "property#result",
          "dataset": {
            "combinator": "and",
            "rules": [
              {"operator": "between", "property": "$createdAt", "value": {"preset": "lastMonth"}}
            ]
          }
        },
        {
          "id": "topFailingStages",
          "type": "bar-chart",
          "title": "Top Failing Pipeline Stages (Last 30 Days)",
          "icon": "Bar",
          "description": "Pipeline stages with the most failures (last 30 days)",
          "blueprint": "azureDevopsPipelineStage",
          "property": "$title",
          "dataset": {
            "combinator": "and",
            "rules": [
              {"operator": "between", "property": "finishTime", "value": {"preset": "lastMonth"}},
              {"operator": "=", "property": "result", "value": "failed"}
            ]
          }
        },
        {
          "id": "teamFailureBar",
          "type": "bar-chart",
          "title": "Teams with Most Build Failures (Last 30 Days)",
          "icon": "Bar",
          "description": "Distribution of failed builds by team",
          "blueprint": "azureDevopsBuild",
          "property": "$team",
          "dataset": {
            "combinator": "and",
            "rules": [
              {"operator": "between", "property": "startTime", "value": {"preset": "lastMonth"}},
              {"operator": "=", "property": "result", "value": "failed"}
            ]
          }
        },
        {
          "id": "serviceFailureBar",
          "type": "bar-chart",
          "title": "Services with Most Build Failures (Last 30 Days)",
          "icon": "Bar",
          "description": "Distribution of failed builds by service",
          "blueprint": "azureDevopsBuild",
          "property": "mirror-property#service_name",
          "dataset": {
            "combinator": "and",
            "rules": [
              {"operator": "=", "property": "result", "value": "failed"},
              {"operator": "between", "property": "startTime", "value": {"preset": "lastMonth"}}
            ]
          }
        },
        {
          "id": "teamReliabilityTable",
          "type": "table-entities-explorer",
          "displayMode": "widget",
          "title": "Team Reliability Overview",
          "icon": "Table",
          "description": "Pipeline build failure rates per team",
          "blueprint": "_team",
          "dataset": {"combinator": "and", "rules": [{"operator": "=", "property": "type", "value": "team"}]},
          "excludedFields": [],
          "blueprintConfig": {
            "_team": {
              "groupSettings": {"groupBy": []},
              "propertiesSettings": {
                "order": ["$title", "github_workflow_runs_30d", "github_failed_workflow_runs_30d", "monthly_workflow_failure_rate", "weekly_workflow_failure_rate", "failure_rate_trend", "github_workflow_runs_7d", "github_failed_workflow_runs_7d", "gitlab_pipeline_jobs_30d", "gitlab_failed_pipeline_jobs_30d", "monthly_pipeline_job_failure_rate", "weekly_pipeline_job_failure_rate", "pipeline_job_failure_rate_trend", "gitlab_pipeline_jobs_7d", "gitlab_failed_pipeline_jobs_7d", "ado_pipeline_builds_30d", "ado_failed_pipeline_builds_30d", "monthly_pipeline_build_failure_rate", "weekly_pipeline_build_failure_rate", "pipeline_build_failure_rate_trend", "ado_pipeline_builds_7d", "ado_failed_pipeline_builds_7d"],
                "shown": ["$title", "github_workflow_runs_30d", "github_failed_workflow_runs_30d", "monthly_workflow_failure_rate", "weekly_workflow_failure_rate", "failure_rate_trend", "github_workflow_runs_7d", "github_failed_workflow_runs_7d", "gitlab_pipeline_jobs_30d", "gitlab_failed_pipeline_jobs_30d", "monthly_pipeline_job_failure_rate", "weekly_pipeline_job_failure_rate", "pipeline_job_failure_rate_trend", "gitlab_pipeline_jobs_7d", "gitlab_failed_pipeline_jobs_7d", "ado_pipeline_builds_30d", "ado_failed_pipeline_builds_30d", "monthly_pipeline_build_failure_rate", "weekly_pipeline_build_failure_rate", "pipeline_build_failure_rate_trend", "ado_pipeline_builds_7d", "ado_failed_pipeline_builds_7d"]
              },
              "filterSettings": {"filterBy": {"combinator": "and", "rules": []}},
              "sortSettings": {"sortBy": []}
            }
          }
        },
        {
          "id": "groupReliabilityTable",
          "type": "table-entities-explorer",
          "displayMode": "widget",
          "title": "Group Reliability Overview",
          "icon": "Table",
          "description": "Pipeline build failure rates per group",
          "blueprint": "_team",
          "dataset": {"combinator": "and", "rules": [{"operator": "=", "property": "type", "value": "group"}]},
          "excludedFields": [],
          "blueprintConfig": {
            "_team": {
              "groupSettings": {"groupBy": []},
              "propertiesSettings": {
                "order": ["$title", "github_workflow_runs_30d", "github_failed_workflow_runs_30d", "monthly_workflow_failure_rate", "weekly_workflow_failure_rate", "failure_rate_trend", "github_workflow_runs_7d", "github_failed_workflow_runs_7d", "gitlab_pipeline_jobs_30d", "gitlab_failed_pipeline_jobs_30d", "monthly_pipeline_job_failure_rate", "weekly_pipeline_job_failure_rate", "pipeline_job_failure_rate_trend", "gitlab_pipeline_jobs_7d", "gitlab_failed_pipeline_jobs_7d", "ado_pipeline_builds_30d", "ado_failed_pipeline_builds_30d", "monthly_pipeline_build_failure_rate", "weekly_pipeline_build_failure_rate", "pipeline_build_failure_rate_trend", "ado_pipeline_builds_7d", "ado_failed_pipeline_builds_7d"],
                "shown": ["$title", "github_workflow_runs_30d", "github_failed_workflow_runs_30d", "monthly_workflow_failure_rate", "weekly_workflow_failure_rate", "failure_rate_trend", "github_workflow_runs_7d", "github_failed_workflow_runs_7d", "gitlab_pipeline_jobs_30d", "gitlab_failed_pipeline_jobs_30d", "monthly_pipeline_job_failure_rate", "weekly_pipeline_job_failure_rate", "pipeline_job_failure_rate_trend", "gitlab_pipeline_jobs_7d", "gitlab_failed_pipeline_jobs_7d", "ado_pipeline_builds_30d", "ado_failed_pipeline_builds_30d", "monthly_pipeline_build_failure_rate", "weekly_pipeline_build_failure_rate", "pipeline_build_failure_rate_trend", "ado_pipeline_builds_7d", "ado_failed_pipeline_builds_7d"]
              },
              "filterSettings": {"filterBy": {"combinator": "and", "rules": []}},
              "sortSettings": {"sortBy": []}
            }
          }
        },
        {
          "id": "serviceReliabilityTable",
          "type": "table-entities-explorer",
          "displayMode": "widget",
          "title": "Service Reliability Overview",
          "icon": "Table",
          "description": "Pipeline build failure rates per service",
          "blueprint": "service",
          "dataset": {"combinator": "and", "rules": []},
          "excludedFields": [],
          "blueprintConfig": {
            "service": {
              "groupSettings": {"groupBy": []},
              "propertiesSettings": {
                "order": ["$title", "github_workflow_runs_30d", "github_failed_workflow_runs_30d", "github_monthly_workflow_failure_rate", "github_weekly_workflow_failure_rate", "github_failure_rate_trend", "github_workflow_runs_7d", "github_failed_workflow_runs_7d", "gitlab_pipeline_jobs_30d", "gitlab_failed_pipeline_jobs_30d", "gitlab_monthly_pipeline_job_failure_rate", "gitlab_weekly_pipeline_job_failure_rate", "gitlab_pipeline_job_failure_rate_trend", "gitlab_pipeline_jobs_7d", "gitlab_failed_pipeline_jobs_7d", "ado_pipeline_builds_30d", "ado_failed_pipeline_builds_30d", "ado_monthly_pipeline_build_failure_rate", "ado_weekly_pipeline_build_failure_rate", "ado_pipeline_build_failure_rate_trend", "ado_pipeline_builds_7d", "ado_failed_pipeline_builds_7d"],
                "shown": ["$title", "github_workflow_runs_30d", "github_failed_workflow_runs_30d", "github_monthly_workflow_failure_rate", "github_weekly_workflow_failure_rate", "github_failure_rate_trend", "github_workflow_runs_7d", "github_failed_workflow_runs_7d", "gitlab_pipeline_jobs_30d", "gitlab_failed_pipeline_jobs_30d", "gitlab_monthly_pipeline_job_failure_rate", "gitlab_weekly_pipeline_job_failure_rate", "gitlab_pipeline_job_failure_rate_trend", "gitlab_pipeline_jobs_7d", "gitlab_failed_pipeline_jobs_7d", "ado_pipeline_builds_30d", "ado_failed_pipeline_builds_30d", "ado_monthly_pipeline_build_failure_rate", "ado_weekly_pipeline_build_failure_rate", "ado_pipeline_build_failure_rate_trend", "ado_pipeline_builds_7d", "ado_failed_pipeline_builds_7d"]
              },
              "filterSettings": {"filterBy": {"combinator": "and", "rules": []}},
              "sortSettings": {"sortBy": []}
            }
          }
        },
        {
          "id": "failedBuildsTable",
          "type": "table-entities-explorer",
          "displayMode": "widget",
          "title": "Failed Builds (last month)",
          "icon": "Table",
          "description": "All builds that concluded with failure",
          "blueprint": "azureDevopsBuild",
          "dataset": {
            "combinator": "and",
            "rules": [
              {"operator": "=", "property": "result", "value": "failed"},
              {"operator": "between", "property": "startTime", "value": {"preset": "lastMonth"}}
            ]
          },
          "excludedFields": [],
          "blueprintConfig": {
            "azureDevopsBuild": {
              "groupSettings": {"groupBy": ["service_name"]},
              "propertiesSettings": {
                "order": ["service_name", "$team", "$title", "result", "startTime"],
                "shown": ["$title", "result", "startTime"]
              },
              "filterSettings": {"filterBy": {"combinator": "and", "rules": [{"operator": "=", "property": "result", "value": "failed"}]}},
              "sortSettings": {"sortBy": []}
            }
          }
        }
      ]
    }
  ]
}
Then run the following command to create the dashboard with all widgets:
curl -s -X POST "https://api.port.io/v1/pages" \
  -H "Authorization: Bearer $PORT_ACCESS_TOKEN" \
  -H "Content-Type: application/json" \
  -d @reliability_dashboard.json | python3 -m json.tool
The script assumes an engineering_intelligence folder already exists in your catalog. If you haven't created it yet, follow step 1-4 in the create the dashboard section first else you will run into an error when you run the script.
High-level reliability metrics
Start with summary widgets that give an at-a-glance view of pipeline reliability health.Overall failure rate (%) (click to expand)
+ Widget and select Number Chart.Overall Failure Rate % (Last Month).Percentage of pipeline runs that failed across all services in the organization.Display Single Property Chart type and choose Organization as the Blueprint.default-org.Monthly Workflow Failure Rate (monthly_workflow_failure_rate) as the Property.% and align it to the right.
- GitHub
- GitLab
- Azure DevOps
Total failing workflows (click to expand)
-
Click
+ Widgetand select Number Chart. -
Title:
Total Failing Workflows. -
Description:
Workflows whose current result is in failure state. -
Select
Count entitiesChart type and choose GitHub Workflow as the Blueprint. -
Select
countfor the Function. -
Add this JSON to the Initial filters editor:
{"combinator": "and","rules": [{"property": "result","operator": "=","value": "failure"}]} -
Click Save.
Workflow runs failure trend (weekly) (click to expand)
-
Click
+ Widgetand select Line Chart. -
Title:
Workflow Runs Failure Trend (Weekly). Description:Weekly trend of failed workflow runs over the past 6 months. -
Set X axis:
- Title:
Date. - Time interval:
Week. - Time range:
In the past 180 days.
- Title:
-
Set Y axis title:
# Failed Workflows. -
Click + Line and configure:
-
Title:
Failed workflow runs. -
Chart type:
Count entities. -
Blueprint:
GitHub Workflow Run. -
Function:
count. -
Measure time by:
runStartedAt. -
Add this JSON to the Initial filters editor:
{"combinator": "and","rules": [{"property": "conclusion","operator": "=","value": "failure"}]}
-
-
Click Save.
Workflow run results (last month) (click to expand)
-
Click
+ Widgetand select Pie chart. -
Title:
Workflow Run Results (Last Month). -
Description:
Breakdown of all workflow runs by conclusion status. -
Choose the GitHub Workflow Run blueprint.
-
Under Breakdown by property, select the
conclusionproperty. -
Add this JSON to the Initial filters editor:
{"combinator": "and","rules": [{"property": "createdAt","operator": "between","value": {"preset": "lastMonth"}}]} -
Click Save.
Total failing pipelines (click to expand)
-
Click
+ Widgetand select Number Chart. -
Title:
Total Failing Pipelines. -
Description:
Pipelines whose current status is failed. -
Select
Count entitiesChart type and choose GitLab Pipeline as the Blueprint. -
Select
countfor the Function. -
Add this JSON to the Initial filters editor:
{"combinator": "and","rules": [{"property": "status","operator": "=","value": "failed"}]} -
Click Save.
Pipeline job failure trend (weekly) (click to expand)
-
Click
+ Widgetand select Line Chart. -
Title:
Pipeline Job Failure Trend (Weekly). Description:Weekly trend of failed pipeline jobs over the past 6 months. -
Set X axis:
- Title:
Date. - Time interval:
Week. - Time range:
In the past 180 days.
- Title:
-
Set Y axis title:
# Failed Jobs. -
Click + Line and configure:
-
Title:
Failed pipeline jobs. -
Chart type:
Count entities. -
Blueprint:
GitLab Job. -
Function:
count. -
Measure time by:
startedAt. -
Add this JSON to the Initial filters editor:
{"combinator": "and","rules": [{"property": "status","operator": "=","value": "failed"}]}
-
-
Click Save.
Pipeline job results (last month) (click to expand)
-
Click
+ Widgetand select Pie chart. -
Title:
Pipeline Job Results (Last Month). -
Description:
Breakdown of all pipeline jobs by status. -
Choose the GitLab Job blueprint.
-
Under Breakdown by property, select the
statusproperty. -
Add this JSON to the Initial filters editor:
{"combinator": "and","rules": [{"property": "startedAt","operator": "between","value": {"preset": "lastMonth"}}]} -
Click Save.
Total failed builds (click to expand)
-
Click
+ Widgetand select Number Chart. -
Title:
Total Failed Builds (Last Month). -
Description:
Number of builds that failed in the last 30 days. -
Select
Count entitiesChart type and choose Azure DevOps Build as the Blueprint. -
Select
countfor the Function. -
Add this JSON to the Initial filters editor:
{"combinator": "and","rules": [{"property": "result","operator": "=","value": "failed"},{"property": "$createdAt","operator": "between","value": {"preset": "lastMonth"}}]} -
Click Save.
Build failure trend (weekly) (click to expand)
-
Click
+ Widgetand select Line Chart. -
Title:
Build Failure Trend (Weekly). Description:Weekly trend of failed builds over the past 6 months. -
Set X axis:
- Title:
Date. - Time interval:
Week. - Time range:
In the past 180 days.
- Title:
-
Set Y axis title:
# Failed Builds. -
Click + Line and configure:
-
Title:
Failed builds. -
Chart type:
Count entities. -
Blueprint:
Azure DevOps Build. -
Function:
count. -
Measure time by:
startTime. -
Add this JSON to the Initial filters editor:
{"combinator": "and","rules": [{"property": "result","operator": "=","value": "failed"}]}
-
-
Click Save.
Build results (last month) (click to expand)
-
Click
+ Widgetand select Pie chart. -
Title:
Build Results (Last Month). -
Description:
Breakdown of all builds by result status. -
Choose the Azure DevOps Build blueprint.
-
Under Breakdown by property, select the
resultproperty. -
Add this JSON to the Initial filters editor:
{"combinator": "and","rules": [{"property": "$createdAt","operator": "between","value": {"preset": "lastMonth"}}]} -
Click Save.
Failure distribution
Identify where failures are concentrated - by pipeline, team, and service.
- GitHub
- GitLab
- Azure DevOps
Top failing workflows (click to expand)
-
Click
+ Widgetand select Bar Chart. -
Title:
Top Failing Workflows (Last 30 Days). -
Description:
Workflows with the most failed runs (last 30 days). -
Select GitHub Workflow Run as the Blueprint.
-
Select
Workflow Nameas the Breakdown by property. -
Add this JSON to the Initial filters editor:
{"combinator": "and","rules": [{"property": "runStartedAt","operator": "between","value": {"preset": "lastMonth"}},{"property": "conclusion","operator": "=","value": "failure"}]} -
Click Save.
Teams with most workflow failures (click to expand)
-
Click
+ Widgetand select Bar Chart. -
Title:
Teams with Most Workflow Failures (Last 30 Days). -
Description:
Distribution of failed workflow runs by team. -
Select GitHub Workflow Run as the Blueprint.
-
Select
Teamas the Breakdown by property. -
Add this JSON to the Initial filters editor:
{"combinator": "and","rules": [{"property": "runStartedAt","operator": "between","value": {"preset": "lastMonth"}},{"property": "conclusion","operator": "=","value": "failure"}]} -
Click Save.
Services with most workflow failures (click to expand)
-
Click
+ Widgetand select Bar Chart. -
Title:
Services with Most Workflow Failures (Last 30 Days). -
Description:
Distribution of failed workflow runs by service. -
Select GitHub Workflow Run as the Blueprint.
-
Select
Serviceas the Breakdown by property. -
Add this JSON to the Initial filters editor:
{"combinator": "and","rules": [{"property": "conclusion","operator": "=","value": "failure"},{"property": "runStartedAt","operator": "between","value": {"preset": "lastMonth"}}]} -
Click Save.
Most failing stages (click to expand)
-
Click
+ Widgetand select Bar Chart. -
Title:
Most Failing Stages (Last 30 Days). -
Description:
Pipeline stages with the most failed jobs (last 30 days). -
Select GitLab Job as the Blueprint.
-
Select
Stageas the Breakdown by property. -
Add this JSON to the Initial filters editor:
{"combinator": "and","rules": [{"property": "startedAt","operator": "between","value": {"preset": "lastMonth"}},{"property": "status","operator": "=","value": "failed"}]} -
Click Save.
Teams with most pipeline failures (click to expand)
-
Click
+ Widgetand select Bar Chart. -
Title:
Teams with Most Pipeline Failures (Last 30 Days). -
Description:
Distribution of failed pipeline jobs by team. -
Select GitLab Job as the Blueprint.
-
Select
Teamas the Breakdown by property. -
Add this JSON to the Initial filters editor:
{"combinator": "and","rules": [{"property": "startedAt","operator": "between","value": {"preset": "lastMonth"}},{"property": "status","operator": "=","value": "failed"}]} -
Click Save.
Services with most pipeline failures (click to expand)
-
Click
+ Widgetand select Bar Chart. -
Title:
Services with Most Pipeline Failures (Last 30 Days). -
Description:
Distribution of failed pipeline jobs by service. -
Select GitLab Job as the Blueprint.
-
Select
Serviceas the Breakdown by property. -
Add this JSON to the Initial filters editor:
{"combinator": "and","rules": [{"property": "status","operator": "=","value": "failed"},{"property": "startedAt","operator": "between","value": {"preset": "lastMonth"}}]} -
Click Save.
Top failing pipeline stages (click to expand)
-
Click
+ Widgetand select Bar Chart. -
Title:
Top Failing Pipeline Stages (Last 30 Days). -
Description:
Pipeline stages with the most failures (last 30 days). -
Select Azure DevOps Pipeline Stage as the Blueprint.
-
Select
Titleas the Breakdown by property. -
Add this JSON to the Initial filters editor:
{"combinator": "and","rules": [{"property": "finishTime","operator": "between","value": {"preset": "lastMonth"}},{"property": "result","operator": "=","value": "failed"}]} -
Click Save.
Teams with most build failures (click to expand)
-
Click
+ Widgetand select Bar Chart. -
Title:
Teams with Most Build Failures (Last 30 Days). -
Description:
Distribution of failed builds by team. -
Select Azure DevOps Build as the Blueprint.
-
Select
Teamas the Breakdown by property. -
Add this JSON to the Initial filters editor:
{"combinator": "and","rules": [{"property": "startTime","operator": "between","value": {"preset": "lastMonth"}},{"property": "result","operator": "=","value": "failed"}]} -
Click Save.
Services with most build failures (click to expand)
-
Click
+ Widgetand select Bar Chart. -
Title:
Services with Most Build Failures (Last 30 Days). -
Description:
Distribution of failed builds by service. -
Select Azure DevOps Build as the Blueprint.
-
Select
Serviceas the Breakdown by property. -
Add this JSON to the Initial filters editor:
{"combinator": "and","rules": [{"property": "result","operator": "=","value": "failed"},{"property": "startTime","operator": "between","value": {"preset": "lastMonth"}}]} -
Click Save.
Team reliability
Compare reliability metrics across teams. Team blueprint property names vary by integration:Team reliability overview (click to expand)
github_workflow_runs_30d, github_failed_workflow_runs_30d, monthly_workflow_failure_rate, weekly_workflow_failure_rate, failure_rate_trendgitlab_pipeline_jobs_30d, gitlab_failed_pipeline_jobs_30d, monthly_pipeline_job_failure_rate, weekly_pipeline_job_failure_rate, pipeline_job_failure_rate_trendado_pipeline_builds_30d, ado_failed_pipeline_builds_30d, monthly_pipeline_build_failure_rate, weekly_pipeline_build_failure_rate, pipeline_build_failure_rate_trend
+ Widget and select Table.Team Reliability Overview.Pipeline failure rates per team.... button in the top right corner of the table and select Customize table.type = team.
Group reliability
Compare reliability metrics across groups. Group blueprint property names are the same as team property names:Group reliability overview (click to expand)
github_workflow_runs_30d, github_failed_workflow_runs_30d, monthly_workflow_failure_rate, weekly_workflow_failure_rate, failure_rate_trendgitlab_pipeline_jobs_30d, gitlab_failed_pipeline_jobs_30d, monthly_pipeline_job_failure_rate, weekly_pipeline_job_failure_rate, pipeline_job_failure_rate_trendado_pipeline_builds_30d, ado_failed_pipeline_builds_30d, monthly_pipeline_build_failure_rate, weekly_pipeline_build_failure_rate, pipeline_build_failure_rate_trend
+ Widget and select Table.Group Reliability Overview.Workflow failure rates per group.... button in the top right corner of the table and select Customize table.type = group.
Service reliability
Track reliability at the individual service level. The service blueprint uses different property names depending on your integration:Service reliability overview (click to expand)
github_workflow_runs_30d, github_failed_workflow_runs_30d, github_monthly_workflow_failure_rate, github_weekly_workflow_failure_rate, and github_failure_rate_trend.gitlab_pipeline_jobs_30d, gitlab_failed_pipeline_jobs_30d, gitlab_monthly_pipeline_job_failure_rate, gitlab_weekly_pipeline_job_failure_rate, and gitlab_pipeline_job_failure_rate_trend.ado_pipeline_builds_30d, ado_failed_pipeline_builds_30d, ado_monthly_pipeline_build_failure_rate, ado_weekly_pipeline_build_failure_rate, and ado_pipeline_build_failure_rate_trend.
+ Widget and select Table.Service Reliability Overview.Pipeline failure rates per service.... button in the top right corner of the table and select Customize table.
ado_pipeline_builds_30d for Azure DevOps, gitlab_pipeline_jobs_30d for GitLab, github_workflow_runs_30d for GitHub): Total runs in the last 30 days.ado_failed_pipeline_builds_30d / gitlab_failed_pipeline_jobs_30d / github_failed_workflow_runs_30d): Failed runs in the last 30 days.ado_monthly_pipeline_build_failure_rate / gitlab_monthly_pipeline_job_failure_rate / github_monthly_workflow_failure_rate): Percentage of runs that failed.ado_weekly_pipeline_build_failure_rate / gitlab_weekly_pipeline_job_failure_rate / github_weekly_workflow_failure_rate): Percentage of runs that failed in the last 7 days.ado_pipeline_build_failure_rate_trend / gitlab_pipeline_job_failure_rate_trend / github_failure_rate_trend): Whether failure rate is improving, stable, or degrading.
Failed pipeline runs
Drill into individual failed runs to investigate root causes.
- GitHub
- GitLab
- Azure DevOps
Failed workflow runs table (click to expand)
-
Click
+ Widgetand select Table. -
Title:
Failed Workflow Runs (last month). -
Description:
All workflow runs that concluded with failure. -
Choose the GitHub Workflow Run blueprint.
-
Add this JSON to the Initial filters editor:
{"combinator": "and","rules": [{"property": "workflow_current_result","operator": "=","value": "failure"},{"property": "createdAt","operator": "between","value": {"preset": "lastMonth"}}]} -
Click Save.
-
Click on the
...button in the top right corner of the table and select Customize table. -
In the top right corner of the table, click on Manage Properties and add the following columns:
- Title: The run title.
- Link: URL to the workflow run.
- Run Number (
runNumber): The run number. - Workflow (
workflow): The workflow name.
-
Select
service_nameas the Group by column. -
Click on the save icon in the top right corner of the widget to save the customized table.
Failed pipeline jobs table (click to expand)
-
Click
+ Widgetand select Table. -
Title:
Failed Pipeline Jobs (Last Month). -
Description:
All pipeline jobs that concluded with failure. -
Choose the GitLab Job blueprint.
-
Add this JSON to the Initial filters editor:
{"combinator": "and","rules": [{"property": "status","operator": "=","value": "failed"},{"property": "startedAt","operator": "between","value": {"preset": "lastMonth"}}]} -
Click Save.
-
Click on the
...button in the top right corner of the table and select Customize table. -
In the top right corner of the table, click on Manage Properties and add the following columns:
- Title: The job name.
- Link: URL to the job.
- Stage: The pipeline stage.
- Pipeline: The parent pipeline (via relation).
-
Select
service_nameandrepositoryas the Group by columns. -
Click on the save icon in the top right corner of the widget to save the customized table.
Failed builds table (click to expand)
-
Click
+ Widgetand select Table. -
Title:
Failed Builds (Last Month). -
Description:
All builds that resulted in failure. -
Choose the Azure DevOps Build blueprint.
-
Add this JSON to the Initial filters editor:
{"combinator": "and","rules": [{"property": "result","operator": "=","value": "failed"},{"property": "$createdAt","operator": "between","value": {"preset": "lastMonth"}}]} -
Click Save.
-
Click on the
...button in the top right corner of the table and select Customize table. -
In the top right corner of the table, click on Manage Properties and add the following columns:
- Title: The build number.
- Link: URL to the build.
- Definition Name: The build pipeline definition.
- Requested For: Who triggered the build.
- Start Time: When the build started.
-
Select
service_nameandrepositoryas the Group by columns. -
Click on the save icon in the top right corner of the widget to save the customized table.
Next steps
Once your Pipeline Reliability dashboard is in place, consider these additional improvements:
- Create automations to send Slack notifications when a service's failure rate exceeds a threshold or when the failure rate trend changes to "Degrading".
- Add an AI agent to provide natural language insights into your reliability data, helping identify patterns in failures and recommending fixes.
- Combine with delivery metrics by adding reliability columns to your existing Delivery Performance dashboard for a unified engineering intelligence view.