Gain visibility into delivery performance
Measuring delivery performance is essential for understanding how effectively your engineering teams ship value to customers. Without visibility into delivery metrics, teams struggle to identify bottlenecks, optimize workflows, and make data-driven decisions about process improvements.
This guide helps engineering managers, platform engineers, DevEx teams, and product leaders answer critical questions about their delivery pipeline:
- Flow: How smoothly does work move through the development lifecycle?
- Bottlenecks: Where are the friction points that slow down delivery?
- Predictability: Can we reliably forecast when features will be delivered?
By the end of this guide, you will have a working dashboard that tracks key delivery performance metrics, enabling you to identify improvement opportunities, measure the impact of process changes, and communicate delivery health across your organization.
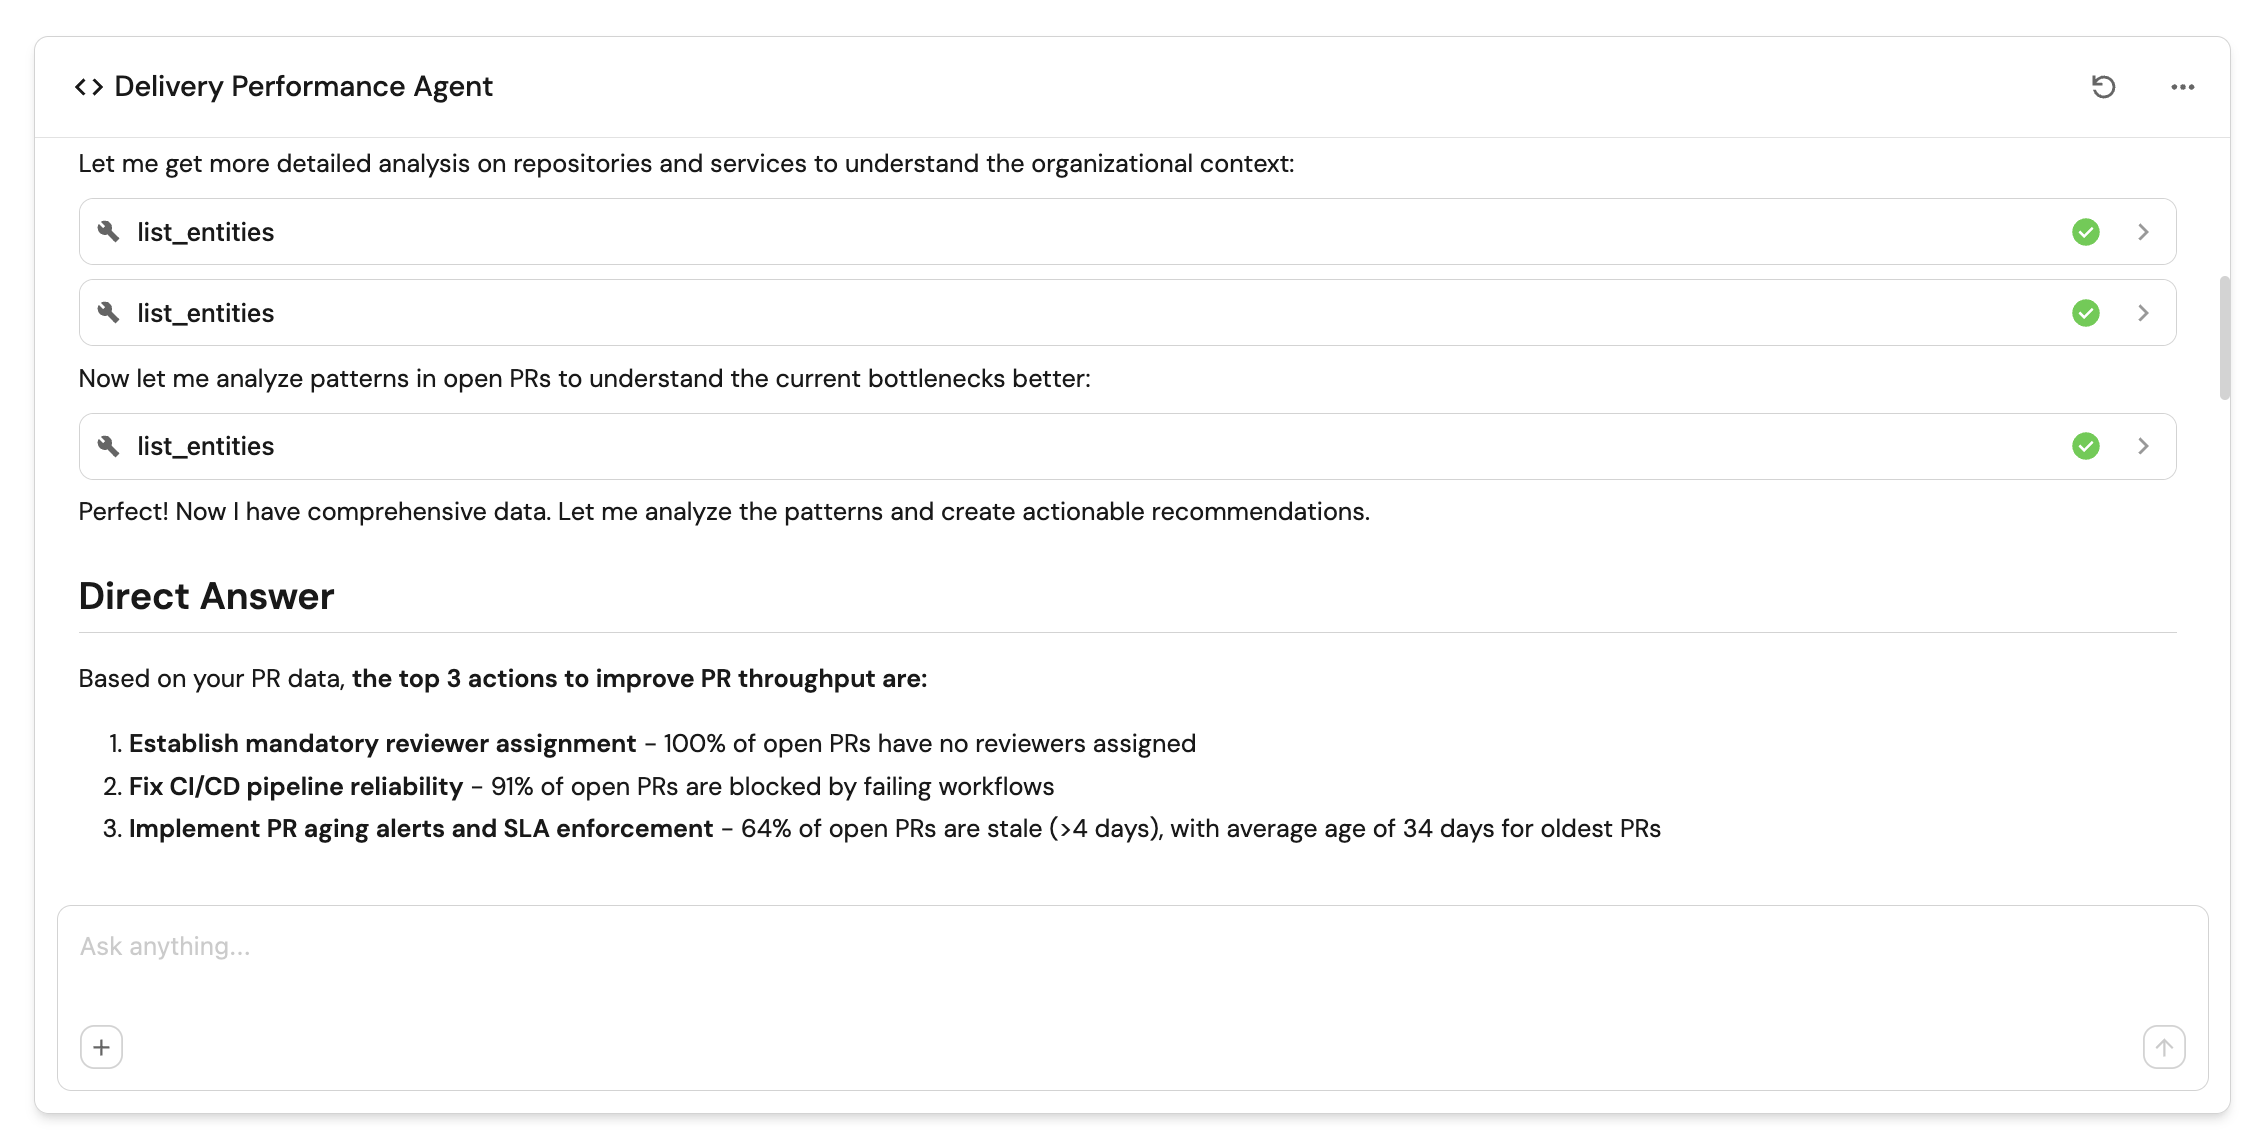
This guide includes configuration for a Delivery Performance Agent that provides AI-powered insights into your delivery flow. Ask natural language questions like "What needs attention right now?" or "What are the top 3 actions we should take to improve PR throughput?" and receive prioritized, actionable recommendations with expected impact and implementation complexity.
Common use cases
- Track PR cycle time to identify bottlenecks in reviews and CI processes.
- Monitor PR throughput to understand delivery flow and detect platform issues.
- Measure deployment frequency to see how often customer value is shipped.
- Identify overdue PRs to surface workflow inefficiencies and blocked work.
Prerequisites
This guide assumes the following:
- You have a Port account and have completed the onboarding process.
- The GitHub Ocean integration or Port's GitHub app installed in your account.
- Port's Azure DevOps integration is installed in your account.
This guide focuses on measuring delivery performance using source control management (SCM) data, including repositories, pull requests, commits, and workflows. This guide supports GitHub and Azure DevOps, with GitLab support coming soon. This is the first iteration of delivery performance measurement and will expand in future versions to include additional metrics and data sources such as issue trackers, deployment platforms, and other development tools.
Key metrics overview
We will track four key metrics to measure delivery performance:
| Metric | What it measures | Why it matters |
|---|---|---|
| PR cycle time | Time from PR creation to merge | Exposes friction in reviews, CI wait times, and other bottlenecks that slow down delivery |
| PR throughput | Number of PRs merged over time | Shows delivery flow and whether CI or platform issues block output |
| Deployment frequency | How often code is deployed to production | Shows how often customer value is shipped and indicates delivery cadence |
| Overdue PRs (open > 3 days) | PRs that have been open longer than 3 days | Signals workflow inefficiencies, unclear ownership, or blocked work that needs attention |
Set up data model
We will create several blueprints to model your data. The service blueprint should already exist from onboarding.
- GitHub
- Azure DevOps
Create the GitHub user blueprint
-
Go to the Builder page of your portal.
-
Click on
+ Blueprint. -
Click on the
{...}button in the top right corner, and chooseEdit JSON. -
Add this JSON schema:
GitHub user blueprint (click to expand)
{"identifier": "githubUser","title": "Github User","icon": "Github","schema": {"properties": {"email": {"title": "Email","type": "string"}},"required": []},"mirrorProperties": {},"calculationProperties": {},"aggregationProperties": {},"relations": {}} -
Click
Saveto create the blueprint.
Create the GitHub repository blueprint
-
Go to your Builder page.
-
Click on
+ Blueprint. -
Click on the
{...}button in the top right corner, and chooseEdit JSON. -
Add this JSON schema:
GitHub repository blueprint (click to expand)
{"identifier": "githubRepository","title": "Repository","icon": "Github","ownership": {"type": "Direct"},"schema": {"properties": {"readme": {"title": "README","type": "string","format": "markdown"},"url": {"icon": "DefaultProperty","title": "Repository URL","type": "string","format": "url"},"defaultBranch": {"title": "Default branch","type": "string"},"last_push": {"icon": "GitPullRequest","title": "Last push","description": "Last commit to the main branch","type": "string","format": "date-time"}},"required": []},"mirrorProperties": {},"calculationProperties": {},"aggregationProperties": {},"relations": {"service": {"title": "Service","target": "service","required": false,"many": false}}} -
Click
Saveto create the blueprint.
Create or update the GitHub pull request blueprint
If you already have a pull request blueprint, you need to add the following properties to it. Otherwise, create a new one.
-
Go to your Builder page.
-
If you have an existing pull request blueprint, hover over it, click on the
...button, and selectEdit JSON. Otherwise, click on+ Blueprintand thenEdit JSON. -
Add or update the JSON schema:
GitHub pull request blueprint (click to expand)
{"identifier": "githubPullRequest","title": "Pull Request","icon": "Github","schema": {"properties": {"status": {"title": "Status","type": "string","enum": ["merged","open","closed"],"enumColors": {"merged": "purple","open": "green","closed": "red"}},"closedAt": {"title": "Closed at","type": "string","format": "date-time"},"updatedAt": {"title": "Updated at","type": "string","format": "date-time"},"mergedAt": {"title": "Merged at","type": "string","format": "date-time"},"createdAt": {"title": "Created at","type": "string","format": "date-time"},"link": {"format": "url","type": "string","title": "Link"},"leadTimeHours": {"type": "number","title": "Lead Time Hours"},"pr_age": {"icon": "DefaultProperty","type": "number","title": "PR Age"},"cycle_time": {"type": "number","title": "Cycle Time"},"pr_age_label": {"icon": "DefaultProperty","type": "string","title": "PR Age Label"}},"required": []},"mirrorProperties": {},"calculationProperties": {},"aggregationProperties": {"failedWorkflowsCount": {"title": "Failed Workflows","type": "number","description": "Count of failed workflow runs for this PR","target": "githubWorkflowRun","query": {"combinator": "and","rules": [{"property": "conclusion","operator": "=","value": "failure"}]},"calculationSpec": {"func": "count","calculationBy": "entities"}}},"relations": {"git_hub_assignees": {"title": "GitHub Assignees","target": "githubUser","required": false,"many": true},"git_hub_creator": {"title": "GitHub Creator","target": "githubUser","required": false,"many": false},"repository": {"title": "Repository","target": "githubRepository","required": false,"many": false},"git_hub_reviewers": {"title": "GitHub Reviewers","target": "githubUser","required": false,"many": true}}}Properties to create for existing PR blueprintIf you're updating an existing pull request blueprint, make sure to add the
pr_age,cycle_time, andpr_age_labelproperties if they don't already exist. -
Click
Saveto create or update the blueprint.
Create the deployment blueprint
-
Go to your Builder page.
-
Click on
+ Blueprint. -
Click on the
{...}button in the top right corner, and chooseEdit JSON. -
Add this JSON schema:
Deployment blueprint (click to expand)
{"identifier": "deployment","title": "Deployment","icon": "Deployment","schema": {"properties": {"description": {"title": "Description","type": "string"},"ref": {"title": "Ref","type": "string"},"sha": {"title": "Sha","type": "string"},"transientEnvironment": {"title": "Transient Running Service","type": "boolean"},"productionEnvironment": {"title": "Production Running Service","type": "boolean"},"createdAt": {"title": "Created At","type": "string","format": "date-time"},"url": {"title": "URL","type": "string","icon": "Link","format": "url"}},"required": []},"mirrorProperties": {"owning_team": {"title": "Owning Team","path": "service.$team"}},"calculationProperties": {},"aggregationProperties": {},"relations": {"service": {"title": "Service","target": "service","required": false,"many": false}}} -
Click
Saveto create the blueprint.
Create the Azure DevOps project blueprint
-
Go to the Builder page of your portal.
-
Click on
+ Blueprint. -
Click on the
{...}button in the top right corner, and chooseEdit JSON. -
Add this JSON schema:
Azure DevOps project blueprint (click to expand)
{"identifier": "azureDevopsProject","title": "Project","icon": "AzureDevops","schema": {"properties": {"state": {"title": "State","type": "string","icon": "AzureDevops","description": "The current lifecycle state of the project."},"revision": {"title": "Revision","type": "string","icon": "AzureDevops","description": "The revision number, indicating how many times the project configuration has been updated."},"visibility": {"title": "Visibility","type": "string","icon": "AzureDevops","description": "Indicates whether the project is private or public"},"defaultTeam": {"title": "Default Team","type": "string","icon": "Team","description": "Default Team of the project"},"link": {"title": "Link","type": "string","format": "url","icon": "AzureDevops","description": "Link to azure devops project"}},"required": []},"mirrorProperties": {},"calculationProperties": {},"aggregationProperties": {},"relations": {}} -
Click
Saveto create the blueprint.
Create the Azure DevOps repository blueprint
-
Go to the Builder page of your portal.
-
Click on
+ Blueprint. -
Click on the
{...}button in the top right corner, and chooseEdit JSON. -
Add this JSON schema:
Azure DevOps repository blueprint (click to expand)
{"identifier": "azureDevopsRepository","title": "Repository","icon": "AzureDevops","ownership": {"type": "Direct"},"schema": {"properties": {"url": {"title": "URL","format": "url","type": "string","icon": "Link"},"readme": {"title": "README","type": "string","format": "markdown","icon": "Book"},"id": {"type": "string","title": "ID"},"last_activity": {"type": "string","title": "Last Activity","format": "date-time"},"minimumApproverCount": {"type": "number","title": "Minimum Approver Count"},"workItemLinking": {"title": "Work Item Linking","type": "boolean","default": false},"repository_policy_enabled": {"type": "boolean","title": "Repository Policy Enabled"},"visibility": {"type": "string","title": "Visibility"}},"required": []},"mirrorProperties": {},"calculationProperties": {},"aggregationProperties": {"total_pipeline": {"title": "Total Pipeline","type": "number","target": "azureDevopsBuild","calculationSpec": {"func": "count","calculationBy": "entities"}},"has_pr_template": {"title": "Has PR Template","type": "number","target": "pr_template","calculationSpec": {"func": "count","calculationBy": "entities"}}},"relations": {"project": {"title": "Project","target": "azureDevopsProject","required": true,"many": false}}} -
Click
Saveto create the blueprint.
Create the Azure DevOps user blueprint
-
Go to the Builder page of your portal.
-
Click on
+ Blueprint. -
Click on the
{...}button in the top right corner, and chooseEdit JSON. -
Add this JSON schema:
Azure DevOps user blueprint (click to expand)
{"identifier": "azureDevopsUser","title": "Azure Devops User","icon": "AzureDevops","schema": {"properties": {"url": {"type": "string","title": "URL","format": "url"},"email": {"type": "string","title": "Email"}},"required": []},"mirrorProperties": {},"calculationProperties": {},"aggregationProperties": {},"relations": {}} -
Click
Saveto create the blueprint.
Create or update the Azure DevOps pull request blueprint
-
Go to the Builder page of your portal.
-
If you have an existing Azure DevOps pull request blueprint, hover over it, click on the
...button, and selectEdit JSON. Otherwise, click on+ Blueprintand thenEdit JSON. -
Add or update the JSON schema:
Azure DevOps pull request blueprint (click to expand)
{"identifier": "azureDevopsPullRequest","title": "Pull Request","icon": "AzureDevops","ownership": {"type": "Inherited","path": "repository"},"schema": {"properties": {"status": {"title": "Status","type": "string","enum": ["completed","abandoned","active"],"enumColors": {"completed": "yellow","abandoned": "red","active": "green"}},"createdAt": {"title": "Created At","type": "string","format": "date-time"},"link": {"title": "Link","format": "url","type": "string"},"leadTimeHours": {"title": "Lead Time in hours","type": "number"},"description": {"type": "string","title": "Description","icon": "Book"},"cycle_time": {"type": "number","title": "Cycle Time"},"closedDate": {"icon": "DefaultProperty","type": "string","title": "Closed Date","format": "date-time"},"pr_age_label": {"type": "string","title": "PR Age"},"source_branch": {"type": "string","title": "Source Branch"},"source_commit_sha": {"type": "string","title": "Source Commit SHA"}},"required": []},"mirrorProperties": {"reviewer_teams": {"title": "Reviewer Teams","path": "reviewers.$team"}},"calculationProperties": {"days_old": {"title": "Days Old","icon": "DefaultProperty","calculation": "(now / 86400) - (.properties.createdAt | capture(\"(?<date>\\\\d{4}-\\\\d{2}-\\\\d{2})\") | .date | strptime(\"%Y-%m-%d\") | mktime / 86400) | floor","type": "number"}},"aggregationProperties": {"failedWorkflowsCount": {"title": "Failed Workflows","type": "number","description": "Count of failed workflow runs for this PR","target": "azureDevopsBuild","query": {"combinator": "and","rules": [{"value": "failed","property": "result","operator": "="}]},"calculationSpec": {"func": "count","calculationBy": "entities"}}},"relations": {"creator": {"title": "Creator","target": "_user","required": false,"many": false},"service": {"title": "Service","target": "service","required": false,"many": false},"azure_devops_creator": {"title": "Creator (ADO)","target": "azureDevopsUser","required": false,"many": false},"azure_devops_reviewers": {"title": "Reviewers (ADO)","target": "azureDevopsUser","required": false,"many": true},"repository": {"title": "Repository","target": "azureDevopsRepository","required": false,"many": false},"reviewers": {"title": "Reviewers","target": "_user","required": false,"many": true}}}Properties to create for existing PR blueprintIf you're updating an existing Azure DevOps pull request blueprint, make sure to add the
cycle_time,pr_age_label, anddays_oldproperties if they don't already exist. -
Click
Saveto create or update the blueprint.
Create the Azure DevOps environment blueprint
-
Go to the Builder page of your portal.
-
Click on
+ Blueprint. -
Click on the
{...}button in the top right corner, and chooseEdit JSON. -
Add this JSON schema:
Azure DevOps environment blueprint (click to expand)
{"identifier": "azureDevopsEnvironment","title": "AzureDevops Environment","icon": "AzureDevops","schema": {"properties": {"description": {"title": "Description","type": "string","icon": "DefaultProperty","description": "Description of the environment"},"createdOn": {"title": "Created On","type": "string","format": "date-time","icon": "Clock","description": "When the environment was created"},"lastModifiedOn": {"title": "Last Modified On","type": "string","format": "date-time","icon": "Clock","description": "When the environment was last modified"}},"required": []},"mirrorProperties": {},"calculationProperties": {},"aggregationProperties": {},"relations": {"project": {"title": "Project","target": "azureDevopsProject","required": true,"many": false}}} -
Click
Saveto create the blueprint.
Create the Azure DevOps pipeline deployment blueprint
-
Go to the Builder page of your portal.
-
Click on
+ Blueprint. -
Click on the
{...}button in the top right corner, and chooseEdit JSON. -
Add this JSON schema:
Azure DevOps pipeline deployment blueprint (click to expand)
{"identifier": "azureDevopsPipelineDeployment","title": "Azure Devops PipelineDeployment","icon": "AzureDevops","schema": {"properties": {"planType": {"title": "Plan Type","type": "string","icon": "DefaultProperty","description": "Type of deployment plan"},"stageName": {"title": "Stage Name","type": "string","icon": "DefaultProperty","description": "Name of the deployment stage"},"jobName": {"title": "Job Name","type": "string","icon": "DefaultProperty","description": "Name of the deployment job"},"result": {"title": "Result","type": "string","icon": "DefaultProperty","description": "Result of the deployment"},"startTime": {"title": "Start Time","type": "string","format": "date-time","icon": "Clock","description": "When the deployment started"},"finishTime": {"title": "Finish Time","type": "string","format": "date-time","icon": "Clock","description": "When the deployment finished"}},"required": []},"mirrorProperties": {},"calculationProperties": {},"aggregationProperties": {},"relations": {"project": {"title": "Project","target": "azureDevopsProject","required": true,"many": false},"environment": {"title": "Environment","target": "azureDevopsEnvironment","required": true,"many": false}}} -
Click
Saveto create the blueprint.
Update integration mapping
- GitHub (Ocean)
- GitHub (Sunset)
- Azure DevOps
Now we'll configure the GitHub Ocean integration to ingest data into your catalog.
-
Go to your Data Source page.
-
Select the GitHub Ocean integration.
-
Add the following YAML block into the editor to ingest data from GitHub:
GitHub Ocean integration configuration (click to expand)
resources:- kind: repositoryselector:query: 'true'includedFiles:- README.mdport:entity:mappings:identifier: .full_nametitle: .nameblueprint: '"githubRepository"'properties:readme: .__includedFiles["README.md"]url: .html_urldefaultBranch: .default_branchlast_push: .pushed_at- kind: userselector:query: 'true'port:entity:mappings:identifier: .logintitle: .loginblueprint: '"githubUser"'- kind: pull-requestselector:query: 'true'states: ["open", "closed"]maxResults: 100since: 90port:entity:mappings:identifier: .__repository + (.id|tostring)title: .titleblueprint: '"githubPullRequest"'properties:status: .stateclosedAt: .closed_atupdatedAt: .updated_atmergedAt: .merged_atcreatedAt: .created_atlink: .html_urlleadTimeHours: >-(.created_at as $createdAt | .merged_at as $mergedAt | ($createdAt| sub("\\..*Z$"; "Z") | strptime("%Y-%m-%dT%H:%M:%SZ") | mktime)as $createdTimestamp | ($mergedAt | if . == null then null elsesub("\\..*Z$"; "Z") | strptime("%Y-%m-%dT%H:%M:%SZ") | mktime end)as $mergedTimestamp | if $mergedTimestamp == null then null else(((($mergedTimestamp - $createdTimestamp) / 3600) * 100 | floor) /100) end)pr_age: >-((now - (.created_at | sub("\\.[0-9]+Z$"; "Z") | fromdateiso8601))/ 86400) | roundpr_age_label: >-((now - (.created_at | sub("\\.[0-9]+Z$"; "Z") | fromdateiso8601))/ 86400 | round) as $age | if $age <= 3 then "0-3 days" elif $age<= 7 then "3-7 days" else ">7 days" endcycle_time: >-if .merged_at then (((.merged_at | sub("\\.[0-9]+Z$"; "Z") |fromdateiso8601) - (.created_at | sub("\\.[0-9]+Z$"; "Z") |fromdateiso8601)) / 86400 | round) else null endrelations:repository: .__repository- kind: pull-requestselector:query: 'true'states: ["open", "closed"]port:entity:mappings:identifier: .__repository + (.id|tostring)blueprint: '"githubPullRequest"'properties: {}relations:git_hub_assignees: '[.assignees[].login]'git_hub_reviewers: '[.requested_reviewers[].login]'git_hub_creator: .user.loginrepository: .__repository- kind: deploymentselector:query: 'true'port:entity:mappings:identifier: .repo + '-' + (.id|tostring)title: .task + '-' + .environmentblueprint: '"deployment"'properties:description: .descriptionref: .refsha: .shaproductionEnvironment: .production_environmenttransientEnvironment: .transient_environmentcreatedAt: .created_aturl: .repository_urlrelations:service: .repoOcean differencesGitHub (Ocean) uses
states: ["open", "closed"]withmaxResultsandsincein the pull-request selector,.statefor the status property, and.__repositoryfor the repository relation. -
Click
Save & Resyncto apply the mapping.
Now we'll configure the GitHub integration to ingest data into your catalog.
-
Go to your Data Source page.
-
Select the GitHub integration.
-
Add the following YAML block into the editor to ingest data from GitHub:
GitHub integration configuration (click to expand)
resources:- kind: repositoryselector:query: 'true'teams: trueport:entity:mappings:identifier: .full_nametitle: .nameblueprint: '"githubRepository"'properties:readme: file://README.mdurl: .html_urldefaultBranch: .default_branchlast_push: .pushed_at- kind: userselector:query: 'true'port:entity:mappings:identifier: .logintitle: .loginblueprint: '"githubUser"'- kind: pull-requestselector:query: 'true'closedPullRequests: trueport:entity:mappings:identifier: .id|tostringtitle: .titleblueprint: '"githubPullRequest"'properties:status: .statusclosedAt: .closed_atupdatedAt: .updated_atmergedAt: .merged_atcreatedAt: .created_atlink: .html_urlleadTimeHours: >-(.created_at as $createdAt | .merged_at as $mergedAt | ($createdAt| sub("\\..*Z$"; "Z") | strptime("%Y-%m-%dT%H:%M:%SZ") | mktime)as $createdTimestamp | ($mergedAt | if . == null then null elsesub("\\..*Z$"; "Z") | strptime("%Y-%m-%dT%H:%M:%SZ") | mktime end)as $mergedTimestamp | if $mergedTimestamp == null then null else(((($mergedTimestamp - $createdTimestamp) / 3600) * 100 | floor) /100) end)pr_age: >-((now - (.created_at | sub("\\.[0-9]+Z$"; "Z") | fromdateiso8601))/ 86400) | roundpr_age_label: >-((now - (.created_at | sub("\\.[0-9]+Z$"; "Z") | fromdateiso8601))/ 86400 | round) as $age | if $age <= 3 then "0-3 days" elif $age<= 7 then "3-7 days" else ">7 days" endcycle_time: >-if .merged_at then (((.merged_at | sub("\\.[0-9]+Z$"; "Z") |fromdateiso8601) - (.created_at | sub("\\.[0-9]+Z$"; "Z") |fromdateiso8601)) / 86400 | round) else null endrelations:repository: .head.repo.full_name- kind: pull-requestselector:query: 'true'port:entity:mappings:identifier: .id|tostringblueprint: '"githubPullRequest"'properties: {}relations:git_hub_assignees: '[.assignees[].login]'git_hub_reviewers: '[.requested_reviewers[].login]'git_hub_creator: .user.login- kind: deploymentselector:query: 'true'port:entity:mappings:identifier: .repo + '-' + (.id|tostring)title: .task + '-' + .environmentblueprint: '"deployment"'properties:description: .descriptionref: .refsha: .shaproductionEnvironment: .production_environmenttransientEnvironment: .transient_environmentcreatedAt: .created_aturl: .repository_urlrelations:service: .repo -
Click
Save & Resyncto apply the mapping.
Now we'll configure the Azure DevOps integration to ingest data into your catalog.
-
Go to your Data Source page.
-
Select the Azure DevOps integration.
-
Add the following YAML block into the editor to ingest data from Azure DevOps:
Azure DevOps integration configuration (click to expand)
resources:- kind: projectselector:query: 'true'defaultTeam: 'true'port:entity:mappings:identifier: .id | gsub(" "; "")blueprint: '"azureDevopsProject"'title: .nameproperties:state: .staterevision: .revisionvisibility: .visibilitydefaultTeam: .defaultTeam.namelink: .url | gsub("_apis/projects/"; "")- kind: repositoryselector:query: 'true'port:entity:mappings:identifier: .idtitle: .nameblueprint: '"azureDevopsRepository"'properties:url: .remoteUrlreadme: file://README.mdid: .idlast_activity: .project.lastUpdateTimerelations:project: .project.id | gsub(" "; "")- kind: repository-policyselector:query: .type.displayName=="Minimum number of reviewers"port:entity:mappings:identifier: .__repository.idblueprint: '"azureDevopsRepository"'properties:minimumApproverCount: .settings.minimumApproverCountrepository_policy_enabled: .isEnabled- kind: repository-policyselector:query: .type.displayName=="Work item linking"port:entity:mappings:identifier: .__repository.idblueprint: '"azureDevopsRepository"'properties:workItemLinking: .isEnabled and .isBlocking- kind: userselector:query: 'true'port:entity:mappings:identifier: .idtitle: .user.displayNameblueprint: '"azureDevopsUser"'properties:url: .user.urlemail: .user.mailAddress- kind: pull-requestselector:query: 'true'port:entity:mappings:identifier: .repository.id + "/" + (.pullRequestId | tostring)title: .titleblueprint: '"azureDevopsPullRequest"'properties:status: .statuscreatedAt: .creationDateclosedDate: .closedDatedescription: .descriptionsource_branch: .sourceRefNamesource_commit_sha: .lastMergeSourceCommit.commitIdleadTimeHours: >-(.creationDate as $createdAt | .status as $status | .closedDate as$closedAt | ($createdAt | sub("\\..*Z$"; "Z") |strptime("%Y-%m-%dT%H:%M:%SZ") | mktime) as $createdTimestamp |($closedAt | if . == null then null else sub("\\..*Z$"; "Z") |strptime("%Y-%m-%dT%H:%M:%SZ") | mktime end) as $closedTimestamp |if $status == "completed" and $closedTimestamp != null then(((($closedTimestamp - $createdTimestamp) / 3600) * 100 | floor) /100) else null end)link: .urlpr_age_label: >-((now - (.creationDate | sub("\\.[0-9]+Z$"; "Z") |fromdateiso8601)) / 86400 | round) as $age | if $age <= 3 then"0-3 days" elif $age <= 7 then "3-7 days" else ">7 days" endcycle_time: >-if .closedDate then (((.closedDate | sub("\\.[0-9]+Z$"; "Z") |fromdateiso8601) - (.creationDate | sub("\\.[0-9]+Z$"; "Z") |fromdateiso8601)) / 86400 | round) else null endrelations:repository: .repository.idservice:combinator: '"and"'rules:- operator: '"="'property: '"ado_repository_id"'value: .repository.idcreator:combinator: '"and"'rules:- operator: '"="'property: '"$identifier"'value: .createdBy.idreviewers:combinator: '"and"'rules:- operator: '"in"'property: '"$identifier"'value: '[.reviewers[].id]'azure_devops_reviewers: '[.reviewers[].id]'azure_devops_creator: .createdBy.id- kind: environmentselector:query: 'true'port:entity:mappings:identifier: .project.id + "/" + (.id | tostring) | gsub(" "; "")title: .name | tostringblueprint: '"azureDevopsEnvironment"'properties:description: .descriptioncreatedOn: .createdOnlastModifiedOn: .lastModifiedOnrelations:project: .project.id- kind: pipeline-deploymentselector:query: 'true'port:entity:mappings:identifier: >-.__project.id + "/" + (.environmentId | tostring) + "/" + (.id |tostring) | gsub(" "; "")title: .requestIdentifier | tostringblueprint: '"azureDevopsPipelineDeployment"'properties:planType: .planTypestageName: .stageNamejobName: .jobNameresult: .resultstartTime: .startTimefinishTime: .finishTimerelations:project: .__project.id | gsub(" "; "")environment: .__project.id + "/" + (.environmentId | tostring) | gsub(" "; "") -
Click
Save & Resyncto apply the mapping.
Configure AI agent
To help Platform Engineering teams understand and improve software delivery flow using engineering signals stored in Port's Context Lake, we'll configure an AI agent that provides data-driven insights and actionable recommendations.
-
Go to the AI Agents page of your portal.
-
Click on
+ AI Agent. -
Toggle
Json modeon. -
Copy and paste the following JSON configuration:
Delivery Performance Agent configuration (click to expand)
{"identifier": "delivery_performance_agent","title": "Delivery Performance Agent","icon": "Details","team": [],"properties": {"status": "active","tools": ["^(list|search|track|describe)_.*"],"prompt": "You're the Delivery Performance Agent.\nYour purpose is to help Platform Engineering understand and improve software delivery flow using engineering signals stored in Port's Context Lake. You provide accurate, data-driven insights and actionable recommendations that make flow improvements visible, prioritised, and easy to act on.\nAvailable Data\nUse any relevant blueprints and properties available in the Context Lake (for example: Pull Requests, Repositories, Domains, Services, Workflow Runs, Deployments, Teams, or future signals).\n Do not assume a fixed schema. Use only available data.\nYour Task\nInterpret the user's question and determine the appropriate scope (single metric, comparison, trend, ranking, root cause, or systemic pattern).\n\n\nRetrieve and analyse relevant flow signals, such as:\n\n\nLead time, cycle time, throughput\n\n\nReview wait time, PR aging, stalled or stale PRs\n\n\nWorkflow stability and CI reliability\n\n\nVolume and trend changes over time\n\n\nProvide clear, concise insights that directly answer the question.\n\n\nWhen improvement opportunities exist, include recommendations in a structured table.\n\n\nHow to Think\nStay objective and data-based.\n\n\nPrefer organisational and structural patterns over individual examples.\n\n\nAdapt depth to the scope (team, domain, service, or organisation).\n\n\nAvoid speculation; rely only on available signals.\n\n\nIf the question is unclear, ask one targeted follow-up.\n\n\nOutput Format (only top 10 findings)\nDirect Answer\nShort, precise response to the question.\nSupporting Insights\nKey data patterns or trends explaining the outcome.\nRecommendations (Table)\nInclude when relevant:\nRecommendation\nPriority\nExpected Impact\nImplementation Complexity\nRelated Entities\nActionable improvement\nHigh / Medium / Low\nImpact on flow, speed, or predictability\nLow / Medium / High\nURLs to relevant entities if available (otherwise N/A)\n\nRelevant Port Guides (Optional)\nWhen applicable, reference one or more Port guides that help implement the recommendation (for example: scorecards, dashboards, automation, or data model setup).\nInclude only guides that are directly actionable; if none are relevant, omit this section.\nBe concise, accurate, and aligned with Engineering Intelligence principles: flow, visibility, platform foundations, and actionable clarity.\n","execution_mode": "Automatic","conversation_starters": ["What needs attention right now?","What are the top 3 actions we should take to improve PR throughput?","Which three top issues should we resolve for the quickest wins to improve delivery speed?","What best practices are top-performing teams using to improve software delivery?"],"model": ""},"relations": {}} -
Click on
Createto save the agent.
The AI agent uses MCP (Model Context Protocol) enhanced capabilities to automatically discover important and relevant blueprint entities via its tools. The ^(list|search|track|describe)_.* pattern is the standard data-access pattern in the tools list (used directly when working in Advanced mode (regex)), and allows the agent to access and analyze related entities in your software catalog for richer contextual understanding.
Visualize metrics
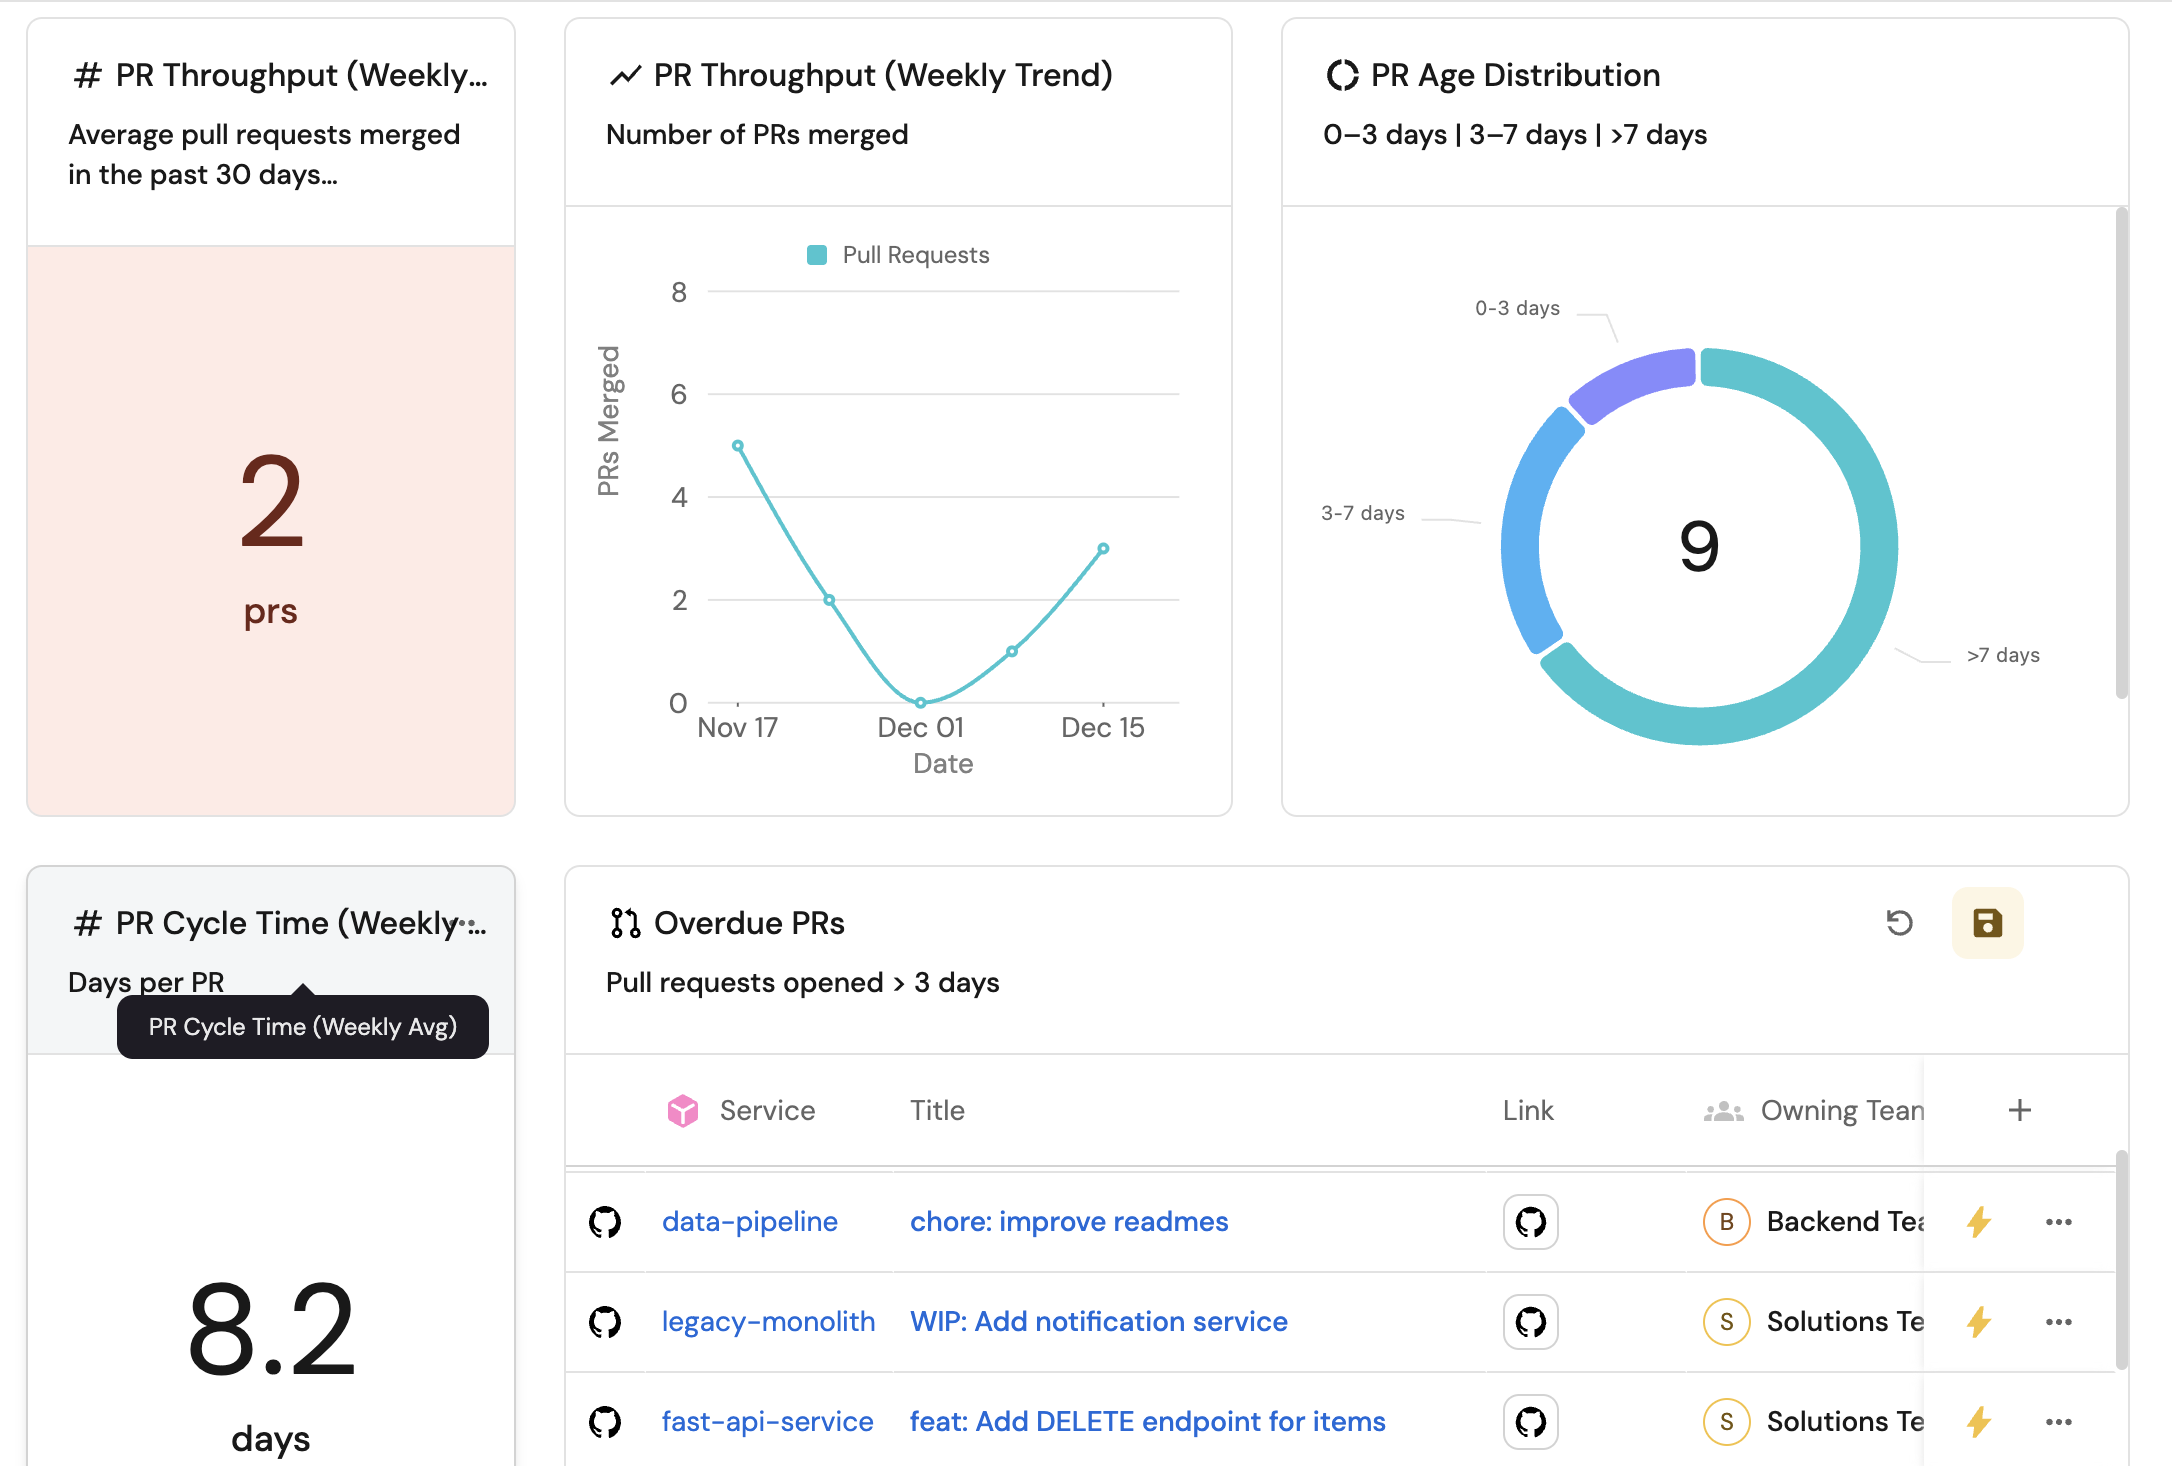
Once the data is synced, we can create a dedicated dashboard in Port to monitor and analyze delivery performance using customizable widgets.
Create a dashboard
- Navigate to your software catalog.
- Click on the
+button in the left sidebar. - Select New dashboard.
- Name the dashboard Delivery Performance.
- Click
Create.
We now have a blank dashboard where we can start adding widgets to visualize delivery performance metrics.
Add widgets
- GitHub
- Azure DevOps
In the new dashboard, create the following widgets: Click Title: Description: Select Select Select Select Add this JSON to the Dataset filter editor: Select Click Click Title: Set X axis: Set Y axis title: Click + Line and configure: Title: Chart type: Blueprint: Function: Measure time by: Add this JSON to the Additional filters editor: Click Click Title: Select Select Select Select Select Add this JSON to the Additional filters editor: Select Click Click Title: Set X axis: Set Y axis title: Click + Line and configure: Title: Chart type: Blueprint: Property: Function: Measure time by: Add this JSON to the Additional filters editor: Click Click Title: Description: Select Select Add this JSON to the Dataset filter editor: Select Click Click Title: Description: Choose the Pull Request blueprint. Under Add this JSON to the Additional filters editor: Click Click Title the widget Overdue PRs. Choose the Pull Request blueprint. Add this JSON to the Initial filters editor: Click Click on the In the top right corner of the table, click on Click on the save icon in the top right corner of the widget to save the customized table.Delivery Performance Agent (click to expand)
+ Widget and select AI Agent.Delivery Performance Agent.Save.PR throughput (weekly avg) (click to expand)
+ Widget and select Number Chart.PR Throughput (Weekly Avg).Average pull requests merged in the past 30 days.Count entities Chart type and choose Pull Request as the Blueprint.average for the Function.week for Average of.createdAt for Measure time by.custom as the Unit and input prs as the Custom unit.Save.PR throughput (weekly trend) (click to expand)
+ Widget and select Line Chart.PR Throughput (Weekly Trend).
Date.Week.In the past 30 days.PR merged.
PRs merged.Count entities.Pull Request.Count.createdAt.Save.PR cycle time (weekly avg) (click to expand)
+ Widget and select Number Chart.PR Cycle Time (Weekly Avg).Aggregate Property (All Entities) Chart type and choose Pull Request as the Blueprint.cycle_time as the Property.average for the Function.week for Average of.createdAt for Measure time by.custom as the Unit and input days as the Custom unit.Save.PR cycle time (weekly trend) (click to expand)
+ Widget and select Line Chart.PR Cycle Time (Weekly Trend).
Date.Week.In the past 30 days.Cycle Time (days).
Cycle time.Aggregate by property.Pull Request.cycle_time.Average.createdAt.Save.Deployment frequency (click to expand)
+ Widget and select Number Chart.Deployment Frequency.Count entities Chart type and choose Deployment as the Blueprint.count for the Function.custom as the Unit and input deployments as the Custom unit.Save.Deployment frequency (weekly trend) (click to expand)
+ Widget and select Line Chart.Deployment Frequency (Weekly Trend).
Date.Week.In the past 30 days.Deployments.
Deployments.Count entities.Deployment.Count.createdAt.Save.Overdue PRs (click to expand)
+ Widget and select Number Chart.Overdue PRs.PRs opened longer than 3 days.Count entities Chart type and choose Pull Request as the Blueprint.count for the Function.custom as the Unit and input prs as the Custom unit.Save.PR age distribution (click to expand)
+ Widget and select Pie chart.PR Age Distribution.0–3 days | 3–7 days | >7 days.Breakdown by property, select the PR Age property.Save.Overdue PRs table (click to expand)
+ Widget and select Table.Save to add the widget to the dashboard.... button in the top right corner of the table and select Customize table.Manage Properties and add the following properties:
In the new dashboard, create the following widgets: Click Title: Description: Select Select Select Select Add this JSON to the Dataset filter editor: Select Click Click Title: Set X axis: Set Y axis title: Click + Line and configure: Title: Chart type: Blueprint: Function: Measure time by: Add this JSON to the Additional filters editor: Click Click Title: Select Select Select Select Select Add this JSON to the Additional filters editor: Select Click Click Title: Set X axis: Set Y axis title: Click + Line and configure: Title: Chart type: Blueprint: Property: Function: Measure time by: Add this JSON to the Additional filters editor: Click Click Title: Select Select Add this JSON to the Dataset editor: Select Click Click Title: Set X axis: Set Y axis title: Click + Line and configure: Title: Chart type: Blueprint: Function: Measure time by: Add this JSON to the Additional filters editor: Click Click Title: Description: Select Select Add this JSON to the Dataset filter editor: Select Click Click Title: Description: Choose the Pull Request blueprint. Under Add this JSON to the Additional filters editor: Click Click Title the widget Overdue PRs. Choose the Pull Request blueprint. Add this JSON to the Initial filters editor: Click Save to add the widget to the dashboard. Click on the In the top right corner of the table, click on Click on the save icon in the top right corner of the widget to save the customized table.Delivery Performance Agent (click to expand)
+ Widget and select AI Agent.Delivery Performance Agent.Save.PR throughput (weekly avg) (click to expand)
+ Widget and select Number Chart.PR Throughput (Weekly Avg).Average pull requests completed in the past 30 days.Count entities Chart type and choose Pull Request as the Blueprint.average for the Function.week for Average of.createdAt for Measure time by.custom as the Unit and input prs as the Custom unit.Save.PR throughput (weekly trend) (click to expand)
+ Widget and select Line Chart.PR Throughput (Weekly Trend).
Date.Week.In the past 30 days.PR completed.
PRs completed.Count entities.Pull Request.Count.createdAt.Save.PR cycle time (weekly avg) (click to expand)
+ Widget and select Number Chart.PR Cycle Time (Weekly Avg).Aggregate Property (All Entities) Chart type and choose Pull Request as the Blueprint.cycle_time as the Property.average for the Function.week for Average of.createdAt for Measure time by.custom as the Unit and input days as the Custom unit.Save.PR cycle time (weekly trend) (click to expand)
+ Widget and select Line Chart.PR Cycle Time (Weekly Trend).
Date.Week.In the past 30 days.Cycle Time (days).
Cycle time.Aggregate by property.Pull Request.cycle_time.Average.createdAt.Save.Deployment frequency (click to expand)
+ Widget and select Number Chart.Deployment Frequency.Count entities Chart type and choose Azure Devops PipelineDeployment as the Blueprint.count for the Function.custom as the Unit and input deployments as the Custom unit.Save.Deployment frequency (weekly trend) (click to expand)
+ Widget and select Line Chart.Deployment Frequency (Weekly Trend).
Date.Week.In the past 30 days.Deployments.
Deployments.Count entities.Azure Devops PipelineDeployment.Count.startTime.Save.Overdue PRs (click to expand)
+ Widget and select Number Chart.Overdue PRs.PRs opened longer than 3 days.Count entities Chart type and choose Pull Request as the Blueprint.count for the Function.custom as the Unit and input prs as the Custom unit.Save.PR age distribution (click to expand)
+ Widget and select Pie chart.PR Age Distribution.0–3 days | 3–7 days | >7 days.Breakdown by property, select the PR Age property.Save.Overdue PRs table (click to expand)
+ Widget and select Table.... button in the top right corner of the table and select Customize table.Manage Properties and add the following properties: