Ingest Swarmia metrics into Port
As an Agentic Engineering Platform, Port provides built-in Engineering Intelligence that natively tracks DORA metrics, delivery performance, developer productivity, AI adoption, and much more — all connected to the services, teams, and infrastructure already in your catalog. Port goes beyond dashboards by closing the end-to-end feedback loop from insight to execution and back to measurable impact, combining metrics with scorecards, agentic workflows, automations, and AI-powered recommendations.
If you're currently using Swarmia, this guide shows how to bring those metrics into Port so you can consolidate on a single platform. Once ingested, you can compare Swarmia data against Port's native metrics, validate parity, and transition to Port as your single source of truth for engineering performance.
Port can calculate the same engineering metrics without any external tool. To learn more about how Port differs from standalone analytics tools, see Why Port for Engineering Intelligence.
Common use cases
- Migrate from Swarmia to a centralized Agentic Engineering Platform with built-in Engineering Intelligence.
- Compare Swarmia metrics against Port's built-in calculations to validate data parity.
- Use Port AI agents to analyze ingested data, uncover insights, and surface actionable recommendations across your engineering organization.
- Apply Port scorecards to ingested data to measure quality and standards adherence.
- Trigger workflows and automations in Port based on ingested metrics (e.g. alert on rising cycle time or declining deployment frequency).
Prerequisites
This guide assumes the following:
- You have a Port account and have completed the onboarding process.
- You have a Swarmia workspace with API access and a Swarmia API token from Settings > API tokens.
- You have a GitHub repository you can use to host the ingestion workflow.
- GitHub (Ocean)
- GitHub (Sunset)
- GitHub Ocean is installed in your account.
- Port's GitHub app is installed for your repository.
We recommend creating a dedicated repository for the workflows that are used by Port actions.
Set up data model
Port's flexible data model lets you define blueprints that fit your exact needs. Here we'll create a single generic engineering_metric blueprint — all metrics, regardless of source or category, are stored in one place and tagged with source and category fields. This design means you can later extend the same blueprint to ingest metrics from other tools (e.g. LinearB, GetDX) without changing your data model. PR metrics are related to your Port teams, giving you cross-entity visibility and the ability to validate parity between Swarmia and the rest of your catalog.
-
Go to the Builder page of your portal.
-
Click on
+ Blueprint. -
Click on the
{...}button in the top right corner, and chooseEdit JSON. -
Add this JSON schema and click
Save:Engineering metric blueprint (click to expand)
{"identifier": "engineering_metric","description": "A time-windowed snapshot of engineering performance metrics. Source-tagged to enable multi-provider ingestion and data parity validation.","title": "Engineering Metric","icon": "Analytics","schema": {"properties": {"source": {"type": "string","title": "Source","description": "The tool this metric was ingested from","enum": ["swarmia"],"enumColors": {"swarmia": "blue"}},"category": {"type": "string","title": "Category","description": "The metric category","enum": ["dora", "pull_request"],"enumColors": {"dora": "purple","pull_request": "green"}},"window": {"type": "string","title": "Window","description": "The time window this snapshot covers","enum": ["7d", "30d"]},"start_date": {"type": "string","format": "date-time","title": "Start date"},"end_date": {"type": "string","format": "date-time","title": "End date"},"team_name": {"type": "string","title": "Team name","description": "Raw team name from the source system, used to match Port teams"},"deployment_frequency": {"type": "number","title": "Deployment frequency (per day)"},"change_lead_time_minutes": {"type": "number","title": "Change lead time (minutes)"},"change_failure_rate": {"type": "number","title": "Change failure rate (%)"},"mttr_minutes": {"type": "number","title": "Mean time to recovery (minutes)"},"deployment_count": {"type": "number","title": "Deployment count"},"cycle_time_seconds": {"type": "number","title": "Cycle time (seconds)"},"review_rate": {"type": "number","title": "Review rate (%)"},"time_to_first_review_seconds": {"type": "number","title": "Time to first review (seconds)"},"prs_merged_per_week": {"type": "number","title": "PRs merged per week"},"merge_time_seconds": {"type": "number","title": "Merge time (seconds)"},"prs_in_progress": {"type": "number","title": "PRs in progress"},"contributors": {"type": "number","title": "Contributors"},"review_time_seconds": {"type": "number","title": "Review time (seconds)"}},"required": ["source", "category", "window", "end_date"]},"mirrorProperties": {"team_identifier": {"title": "Team identifier","path": "team.$identifier"}},"calculationProperties": {"cycle_time_hours": {"title": "Cycle time (hours)","calculation": "if .properties.cycle_time_seconds then (.properties.cycle_time_seconds / 3600) else null end","type": "number"}},"aggregationProperties": {},"relations": {"team": {"title": "Team","target": "_team","required": false,"many": false}}}Relating metrics to teamsFor the relation to resolve, your Port team identifiers should match the slugified Swarmia team names (e.g. a Swarmia team named
Active contributorsmaps to a Port team with identifieractive-contributors).
Set up GitHub action
We'll use a GitHub Actions workflow that runs on a schedule to fetch both DORA and PR metrics from Swarmia's Export API, parse the CSV responses, and upsert entities into Port.
Add GitHub secrets
In your GitHub repository, go to Settings > Secrets and variables > Actions and add the following secrets:
PORT_CLIENT_ID— Your Port client ID. Learn more.PORT_CLIENT_SECRET— Your Port client secret. Learn more.SWARMIA_API_TOKEN— Your Swarmia API token from Settings > API tokens.
Create the GitHub workflow
Create the file .github/workflows/sync_swarmia_metrics.yml in your repository:
Swarmia metrics sync workflow (click to expand)
name: Sync Swarmia metrics to Port

on:
  workflow_dispatch:
  schedule:
    - cron: '0 6 * * *'

jobs:
  sync:
    runs-on: ubuntu-latest
    steps:
      - name: Sync Swarmia metrics
        env:
          SWARMIA_API_TOKEN: ${{ secrets.SWARMIA_API_TOKEN }}
          PORT_CLIENT_ID: ${{ secrets.PORT_CLIENT_ID }}
          PORT_CLIENT_SECRET: ${{ secrets.PORT_CLIENT_SECRET }}
        run: |
          python3 - <<'EOF'
          import csv
          import io
          import json
          import os
          import re
          import urllib.request
          import urllib.error

          SWARMIA_TOKEN = os.environ["SWARMIA_API_TOKEN"]
          PORT_CLIENT_ID = os.environ["PORT_CLIENT_ID"]
          PORT_CLIENT_SECRET = os.environ["PORT_CLIENT_SECRET"]
          PORT_BASE_URL = "https://api.getport.io"
          SWARMIA_BASE_URL = "https://app.swarmia.com/api/v0"
          BLUEPRINT = "engineering_metric"

          def slugify(text):
              return re.sub(r"[^a-z0-9]+", "-", text.lower()).strip("-")

          def parse_number(value):
              if not value or not value.strip():
                  return None
              cleaned = value.strip().rstrip("%")
              try:
                  return float(cleaned)
              except ValueError:
                  return None

          def get_port_token():
              data = json.dumps({
                  "clientId": PORT_CLIENT_ID,
                  "clientSecret": PORT_CLIENT_SECRET
              }).encode()
              req = urllib.request.Request(
                  f"{PORT_BASE_URL}/v1/auth/access_token",
                  data=data, method="POST"
              )
              req.add_header("Content-Type", "application/json")
              with urllib.request.urlopen(req) as resp:
                  return json.loads(resp.read())["accessToken"]

          def check_team_exists(token, team_id):
              url = f"{PORT_BASE_URL}/v1/blueprints/_team/entities/{team_id}"
              req = urllib.request.Request(url, method="GET")
              req.add_header("Authorization", f"Bearer {token}")
              try:
                  urllib.request.urlopen(req)
                  return True
              except urllib.error.HTTPError:
                  return False

          def upsert_entity(token, entity):
              url = f"{PORT_BASE_URL}/v1/blueprints/{BLUEPRINT}/entities?upsert=true&merge=true"
              req = urllib.request.Request(
                  url, json.dumps(entity).encode(), method="POST"
              )
              req.add_header("Authorization", f"Bearer {token}")
              req.add_header("Content-Type", "application/json")
              try:
                  urllib.request.urlopen(req)
                  print(f"  OK  {entity['identifier']}")
              except urllib.error.HTTPError as e:
                  print(f"  ERR {entity['identifier']}: {e.code} {e.read().decode()}")

          def fetch_csv(endpoint, timeframe):
              url = f"{SWARMIA_BASE_URL}/{endpoint}?timeframe={timeframe}"
              req = urllib.request.Request(url)
              req.add_header("Authorization", f"Bearer {SWARMIA_TOKEN}")
              with urllib.request.urlopen(req) as resp:
                  return list(csv.DictReader(io.StringIO(resp.read().decode("utf-8-sig"))))

          token = get_port_token()

          for timeframe in ["last_30_days", "last_7_days"]:
              window = "30d" if timeframe == "last_30_days" else "7d"

              print(f"\n--- DORA metrics ({window}) ---")
              for row in fetch_csv("reports/dora", timeframe):
                  end_date = row.get("End Date", "").strip()
                  start_date = row.get("Start Date", "").strip()
                  upsert_entity(token, {
                      "identifier": f"swarmia-dora-{window}-{end_date}",
                      "title": f"DORA metrics ({window}) - {end_date}",
                      "properties": {
                          "source": "swarmia",
                          "category": "dora",
                          "window": window,
                          "start_date": f"{start_date}T00:00:00Z",
                          "end_date": f"{end_date}T00:00:00Z",
                          "deployment_frequency": parse_number(row.get("Deployment Frequency (per day)")),
                          "change_lead_time_minutes": parse_number(row.get("Change Lead Time Minutes")),
                          "change_failure_rate": parse_number(row.get("Change Failure Rate (%)")),
                          "mttr_minutes": parse_number(row.get("Mean Time to Recovery Minutes")),
                          "deployment_count": parse_number(row.get("Deployment Count")),
                      },
                      "relations": {}
                  })

              print(f"\n--- PR metrics ({window}) ---")
              for row in fetch_csv("reports/pullRequests", timeframe):
                  team = row.get("Team", "").strip()
                  if not team:
                      continue
                  end_date = row.get("End Date", "").strip()
                  start_date = row.get("Start Date", "").strip()
                  team_slug = slugify(team)

                  relations = {}
                  if check_team_exists(token, team_slug):
                      relations["team"] = team_slug
                      print(f"  Linked team: {team_slug}")

                  upsert_entity(token, {
                      "identifier": f"swarmia-pr-{team_slug}-{window}-{end_date}",
                      "title": f"{team} - PR metrics ({window})",
                      "properties": {
                          "source": "swarmia",
                          "category": "pull_request",
                          "window": window,
                          "start_date": f"{start_date}T00:00:00Z",
                          "end_date": f"{end_date}T00:00:00Z",
                          "team_name": team,
                          "cycle_time_seconds": parse_number(row.get("Cycle Time (s)")),
                          "review_rate": parse_number(row.get("Review Rate (%)")),
                          "time_to_first_review_seconds": parse_number(row.get("Time to first review (s)")),
                          "prs_merged_per_week": parse_number(row.get("PRs merged / week")),
                          "merge_time_seconds": parse_number(row.get("Merge Time (s)")),
                          "prs_in_progress": parse_number(row.get("PRs in Progress")),
                          "contributors": parse_number(row.get("Contributors")),
                          "review_time_seconds": parse_number(row.get("Review Time (s)")),
                      },
                      "relations": relations
                  })

          print("\nSync complete.")
          EOF
The workflow runs daily at 06:00 UTC and can also be triggered manually from the Actions tab. It syncs both last_30_days and last_7_days windows on every run, so you always have up-to-date snapshots for both timeframes in Port.
You can change the cron expression to control how often metrics are synced. For example, '0 */6 * * *' syncs every 6 hours.
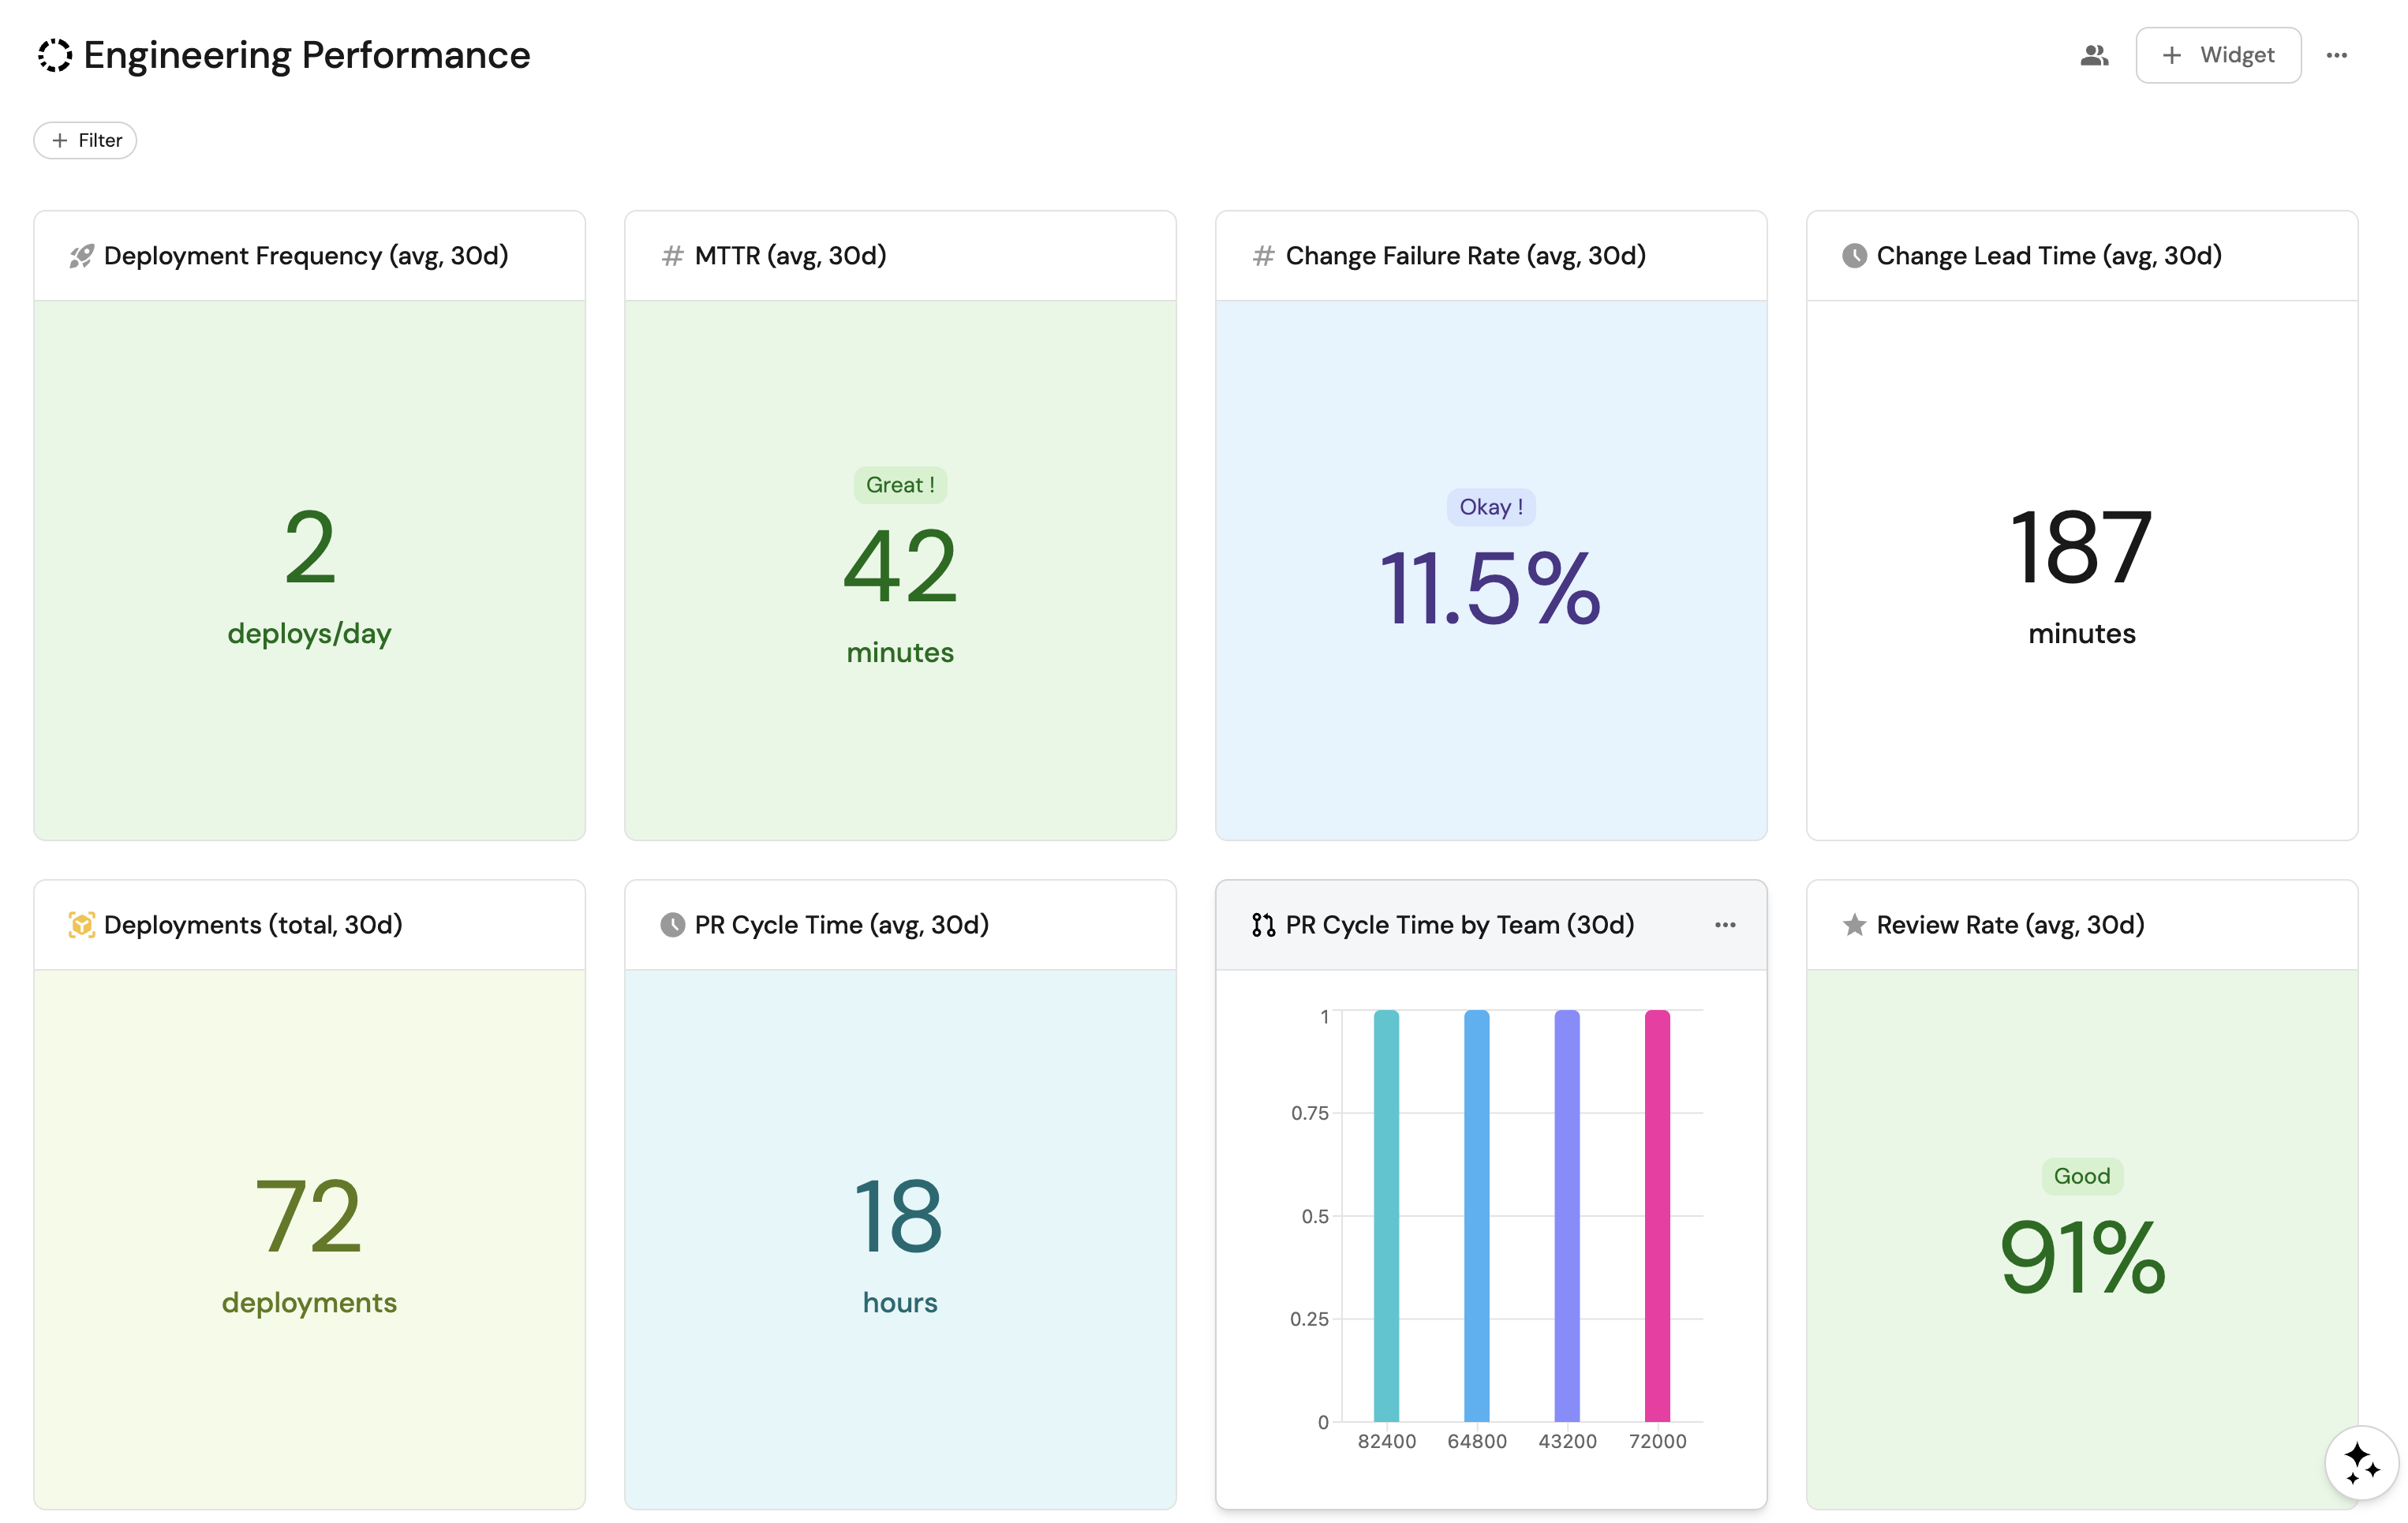
Visualize metrics
Once the workflow has run at least once, build a dashboard in Port to track engineering performance over time.
Create a dashboard
-
Navigate to the Catalog page of your portal.
-
Click on the
+button in the left sidebar. -
Select New dashboard.
-
Name the dashboard Engineering Performance.
-
Input
Track DORA and PR metrics from Swarmia across teamsunder Description. -
Select the
Analyticsicon. -
Click Create.
Add widgets
Deployment frequency widget (click to expand)
-
Click
+ Widgetand select Number Chart. -
Fill in the following details:
- Title:
Deployment Frequency (avg, 30d). - Icon:
Rocket. - Blueprint:
engineering_metric. - Chart type:
Aggregate by property. - Property:
deployment_frequency. - Function:
Average. - Average of:
total. - Custom unit:
deploys/day. - Add a filter:
category=doraandwindow=30d.
- Title:
-
Click Save.
Change lead time widget (click to expand)
-
Click
+ Widgetand select Number Chart. -
Fill in the following details:
- Title:
Change Lead Time (avg, 30d). - Icon:
Clock. - Blueprint:
engineering_metric. - Chart type:
Aggregate by property. - Property:
change_lead_time_minutes. - Function:
Average. - Average of:
total. - Custom unit:
minutes. - Add a filter:
category=doraandwindow=30d.
- Title:
-
Click Save.
Change failure rate widget (click to expand)
-
Click
+ Widgetand select Number Chart. -
Fill in the following details:
- Title:
Change Failure Rate (avg, 30d). - Icon:
Alert. - Blueprint:
engineering_metric. - Chart type:
Aggregate by property. - Property:
change_failure_rate. - Function:
Average. - Average of:
total. - Unit:
%. - Add a filter:
category=doraandwindow=30d.
- Title:
-
Click Save.
MTTR widget (click to expand)
-
Click
+ Widgetand select Number Chart. -
Fill in the following details:
- Title:
MTTR (avg, 30d). - Icon:
Metrics. - Blueprint:
engineering_metric. - Chart type:
Aggregate by property. - Property:
mttr_minutes. - Function:
Average. - Average of:
total. - Custom unit:
minutes. - Add a filter:
category=doraandwindow=30d.
- Title:
-
Click Save.
Deployment count widget (click to expand)
-
Click
+ Widgetand select Number Chart. -
Fill in the following details:
- Title:
Deployments (total, 30d). - Icon:
Deployment. - Blueprint:
engineering_metric. - Chart type:
Aggregate by property. - Property:
deployment_count. - Function:
Sum. - Custom unit:
deployments. - Add a filter:
category=doraandwindow=30d.
- Title:
-
Click Save.
Average cycle time widget (click to expand)
-
Click
+ Widgetand select Number Chart. -
Fill in the following details:
- Title:
PR Cycle Time (avg, 30d). - Icon:
Clock. - Blueprint:
engineering_metric. - Chart type:
Aggregate by property. - Property:
cycle_time_hours. - Function:
Average. - Average of:
total. - Custom unit:
hours. - Add a filter:
category=pull_requestandwindow=30d.
- Title:
-
Click Save.
Average review rate widget (click to expand)
-
Click
+ Widgetand select Number Chart. -
Fill in the following details:
- Title:
Review Rate (avg, 30d). - Icon:
Star. - Blueprint:
engineering_metric. - Chart type:
Aggregate by property. - Property:
review_rate. - Function:
Average. - Average of:
total. - Unit:
%. - Add a filter:
category=pull_requestandwindow=30d.
- Title:
-
Click Save.
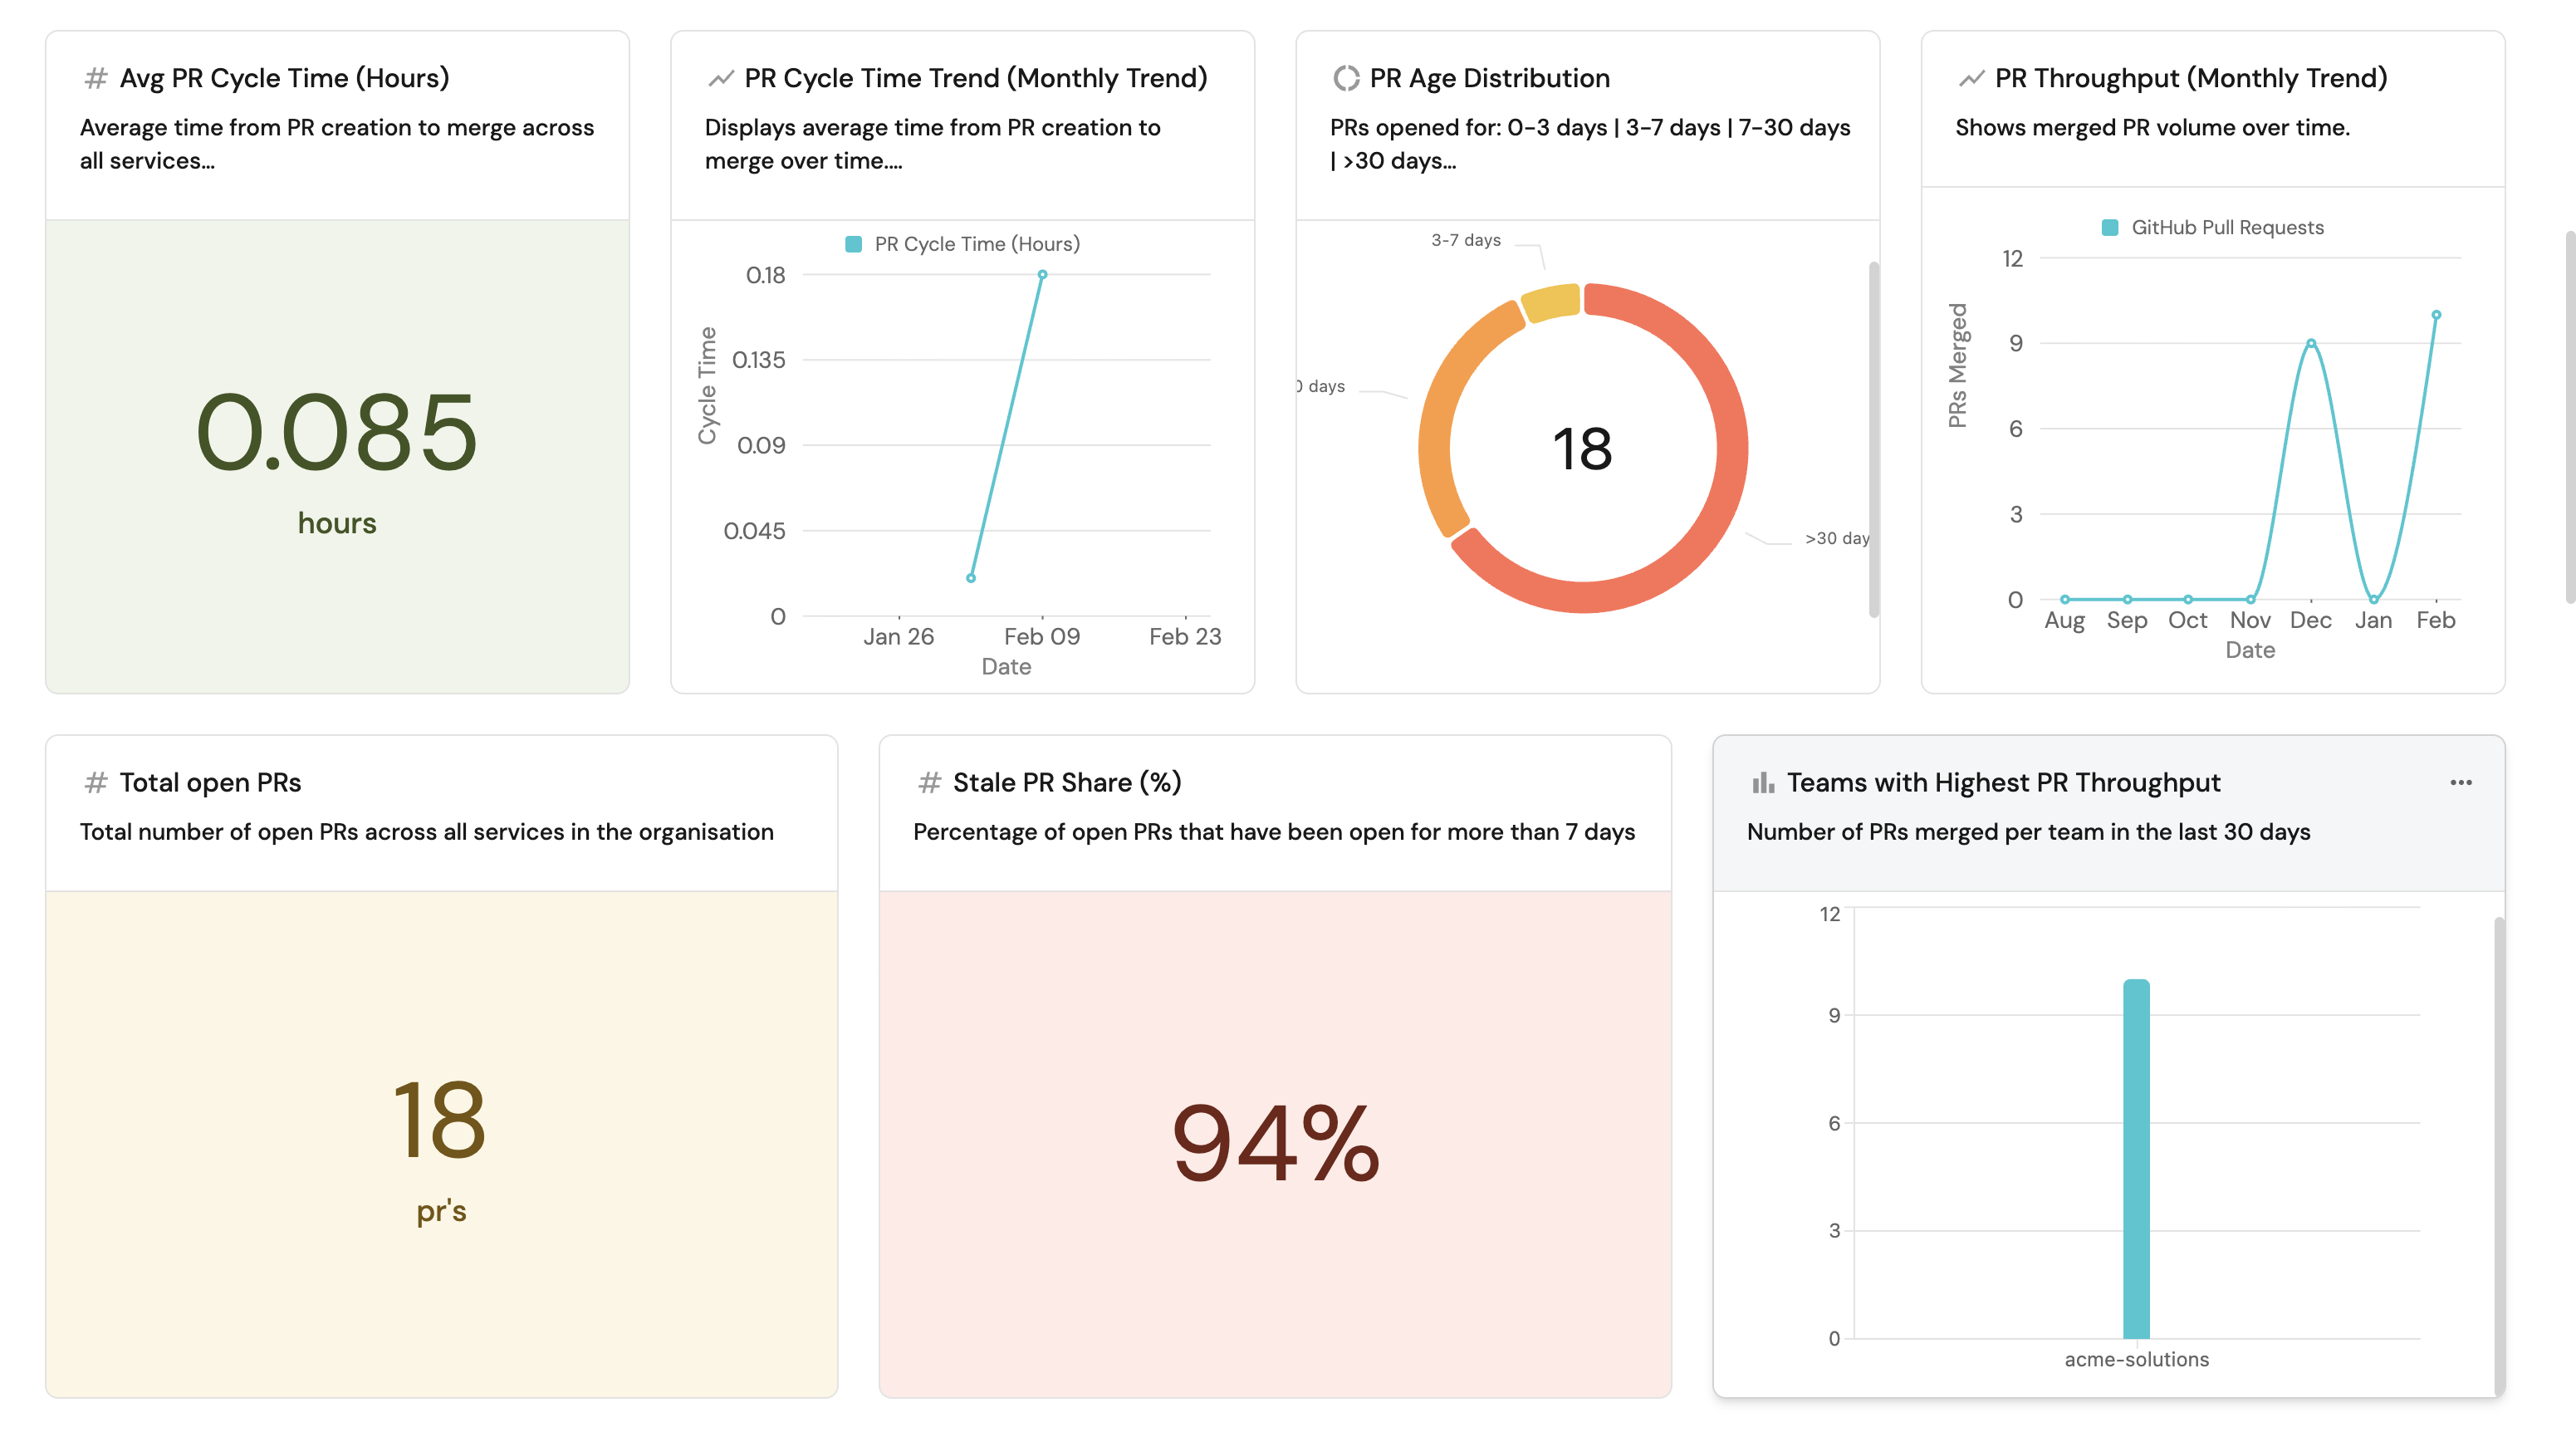
Metrics by team pie chart (click to expand)
-
Click
+ Widgetand select Pie chart. -
Fill in the following details:
- Title:
PR Metrics by Team (30d). - Icon:
Team. - Blueprint:
engineering_metric. - Breakdown by property:
team_name. - Add a filter:
category=pull_requestandwindow=30d.
- Title:
-
Click Save.
Metrics by category bar chart (click to expand)
-
Click
+ Widgetand select Bar Chart. -
Fill in the following details:
- Title:
Metrics by Category. - Icon:
Analytics. - Blueprint:
engineering_metric. - Breakdown by property:
category.
- Title:
-
Click Save.
Engineering metrics table (click to expand)
-
Click
+ Widgetand select Table. -
Fill in the following details:
- Title:
Engineering Metrics. - Blueprint:
engineering_metric.
- Title:
-
Click Save.
-
Click
...on the widget and select Customize table. -
Under Manage Properties, add:
source.category.window.team_name.deployment_frequency.change_lead_time_minutes.change_failure_rate.mttr_minutes.cycle_time_hours.review_rate.prs_merged_per_week.end_date.
-
Click the save icon in the top right corner of the widget.
Create metrics natively in Port
While ingesting Swarmia data is useful for consolidation, Port can compute the same engineering metrics natively without any external analytics tool. Using Port's built-in integrations and flexible data model, you can derive engineering metrics directly from your source control, CI/CD, project management, and AI tooling data.
Port automatically calculates engineering metrics such as PR throughput, cycle time, deployment frequency, and review health using data from Port integrations. Metrics can be aggregated at different levels (service, team, group, or organization), and relate with your service catalog, ownership data, Jira metrics, AI adoption data, and more. Port's aggregation properties and calculation properties handle this directly on your catalog data with no external tool or CSV export needed.
Supported integrations
Port supports a wide range of integrations spanning the end-to-end SDLC source control, planning, security, infrastructure, CI/CD, and AI coding tools. Data syncs into Port's catalog automatically, where you can enrich it with calculation properties, build scorecards, trigger automations, and create dashboards without writing custom ingestion scripts.
Example guides
For step-by-step walkthroughs of building native metrics in Port, see:
- Measure PR delivery metrics — track cycle time, throughput, review health, overdue PRs, and deployment frequency using Port's GitHub, GitLab, or Azure DevOps integration.
- Set up DORA metrics — measure deployment frequency, lead time, change failure rate, and MTTR natively in Port.
- Track AI adoption and impact — measure adoption rates, productivity impact, and quality outcomes for tools like Claude, Cursor, and Copilot across teams.
- Enforce AI coding security standards — ensure AI-generated code meets your organization's security and quality standards.
Next steps
- Why Port for Engineering Intelligence — learn how Port's context lake, scorecards, workflow automations, and AI agents close the end-to-end feedback loop from insight to action.