Ingest GitLab security vulnerabilities into Port
This integration was created using the custom Ocean integration framework.
Please note that:
- This integration will not be listed in the
Data sourcespage of your Port application, and must be installed manually using the instructions on this page. - This integration will not create components (e.g.
blueprints,mapping, etc.) in your portal automatically, you will need to create them manually using the instructions on this page.
Port's GitLab integration ingests projects, merge requests, pipelines, and other core resources, but does not cover security vulnerability findings. This guide adds that missing piece using a lightweight Ocean Custom Integration that calls GitLab's Vulnerability Findings API and relates each finding back to the gitlabRepository entities your existing integration already creates.
The result is centralized visibility into SAST, DAST, dependency scanning, and container scanning findings per project and team alongside your existing engineering data.
Common use cases
- See security findings per project and team to identify ownership gaps and risk areas.
- Build scorecards tracking which projects have security scanning enabled and meet vulnerability thresholds.
- Provide leadership with dashboards showing security posture alongside Engineering Intelligence metrics.
Prerequisites
This guide assumes the following:
- You have a Port account and have completed the onboarding process.
- Port's GitLab integration is installed and syncing projects (this provides the
gitlabRepositoryentities that vulnerabilities relate to). - You have a GitLab account on the Ultimate tier (both GitLab.com and self-managed). The Vulnerability Findings API is only available on this tier.
- You have a GitLab Personal Access Token with the
read_apiscope.
Install the custom integration
Since the existing GitLab integration does not support vulnerability findings as a resource kind, we use a separate Ocean Custom Integration that targets the same GitLab API but fetches only security data. It uses the same GitLab Personal Access Token.
The Ocean custom integration can be installed in two ways:
- Hosted by Port — Port manages the infrastructure; configure the connection in the Port UI.
- Self-hosted — Run the integration in your own infrastructure using Helm or Docker.
Choose one of the following options:
- Hosted by Port
- Helm
- Docker
-
Go to your Data sources page.
-
Click
+ Data sourceand select Custom Integration. -
Fill in the connection settings:
Setting Value Base URL https://gitlab.com(or your self-managed URL)Auth Type bearer_tokenAPI Token Your GitLab Personal Access Token Pagination Type pageIdentifier my-ocean-gitlab-vul -
Click Save & Continue.
Prerequisites
-
A Kubernetes cluster - the integration's container chart will be deployed to this cluster.
-
kubectlandhelmmust be installed on your machine. YourkubectlCLI must be connected to the Kubernetes cluster where you plan to install the integration.
Installation
Add Port's Helm repo and install the Ocean Custom Integration:
Replace YOUR_PORT_CLIENT_ID, YOUR_PORT_CLIENT_SECRET, YOUR_GITLAB_TOKEN, and the base URL if using a self-managed GitLab instance.
helm repo add --force-update port-labs https://port-labs.github.io/helm-charts
helm upgrade --install my-ocean-gitlab-vulnerabilities port-labs/port-ocean \
  --set port.clientId="YOUR_PORT_CLIENT_ID" \
  --set port.clientSecret="YOUR_PORT_CLIENT_SECRET" \
  --set port.baseUrl="https://api.port.io" \
  --set initializePortResources=true \
  --set scheduledResyncInterval=120 \
  --set integration.identifier="my-ocean-gitlab-vul" \
  --set integration.type="custom" \
  --set integration.eventListener.type="POLLING" \
  --set integration.config.baseUrl="https://gitlab.com" \
  --set integration.config.authType="bearer_token" \
  --set integration.config.paginationType="page" \
  --set integration.config.pageSize="100" \
  --set integration.secrets.apiToken="YOUR_GITLAB_TOKEN"
The port_region, port.baseUrl, portBaseUrl, port_base_url and OCEAN__PORT__BASE_URL parameters select which Port API instance to use:
- EU (app.port.io) →
https://api.port.io - US (app.us.port.io) →
https://api.us.port.io
For advanced configuration such as proxies or self-signed certificates, click here.
To run the integration using Docker for a one-time sync:
Replace YOUR_PORT_CLIENT_ID, YOUR_PORT_CLIENT_SECRET, YOUR_GITLAB_TOKEN, and the base URL if using a self-managed GitLab instance.
docker run -i --rm --platform=linux/amd64 \
  -e OCEAN__EVENT_LISTENER='{"type":"ONCE"}' \
  -e OCEAN__INITIALIZE_PORT_RESOURCES=true \
  -e OCEAN__SEND_RAW_DATA_EXAMPLES=true \
  -e OCEAN__INTEGRATION__CONFIG__BASE_URL="https://gitlab.com" \
  -e OCEAN__INTEGRATION__CONFIG__AUTH_TYPE="bearer_token" \
  -e OCEAN__INTEGRATION__CONFIG__PAGINATION_TYPE="page" \
  -e OCEAN__INTEGRATION__CONFIG__PAGE_SIZE="100" \
  -e OCEAN__INTEGRATION__SECRETS__API_TOKEN="YOUR_GITLAB_TOKEN" \
  -e OCEAN__PORT__CLIENT_ID="YOUR_PORT_CLIENT_ID" \
  -e OCEAN__PORT__CLIENT_SECRET="YOUR_PORT_CLIENT_SECRET" \
  -e OCEAN__PORT__BASE_URL="https://api.port.io" \
  ghcr.io/port-labs/port-ocean-custom:latest
The port_region, port.baseUrl, portBaseUrl, port_base_url and OCEAN__PORT__BASE_URL parameters select which Port API instance to use:
- EU (app.port.io) →
https://api.port.io - US (app.us.port.io) →
https://api.us.port.io
For advanced configuration such as proxies or self-signed certificates, click here.
Set up data model
Create a gitlab_vulnerability blueprint that relates each finding to a gitlabRepository entity from your existing GitLab integration.
-
Go to the Builder page of your portal.
-
Click on
+ Blueprint, then the{...} Edit JSONbutton in the top right corner of the modal. -
Add the JSON schema below and click Save:
GitLab vulnerability blueprint (click to expand)
{"identifier": "gitlab_vulnerability","description": "A security vulnerability finding detected by GitLab's security scanners (SAST, DAST, dependency scanning, container scanning).","title": "GitLab Vulnerability","icon": "GitLab","schema": {"properties": {"report_type": {"type": "string","title": "Report type","description": "The type of security scan that detected this vulnerability","enum": ["sast", "dast", "dependency_scanning", "container_scanning"],"enumColors": {"sast": "blue","dast": "turquoise","dependency_scanning": "orange","container_scanning": "purple"}},"severity": {"type": "string","title": "Severity","enum": ["critical", "high", "medium", "low", "info", "unknown"],"enumColors": {"critical": "red","high": "orange","medium": "yellow","low": "green","info": "blue","unknown": "lightGray"}},"state": {"type": "string","title": "State","description": "The current state of the vulnerability finding","enum": ["detected", "confirmed", "dismissed", "resolved"],"enumColors": {"detected": "yellow","confirmed": "red","dismissed": "lightGray","resolved": "green"}},"scanner_name": {"type": "string","title": "Scanner"},"description": {"type": "string","title": "Description"},"solution": {"type": "string","title": "Solution"},"file_path": {"type": "string","title": "File path"},"start_line": {"type": "number","title": "Start line"},"false_positive": {"type": "boolean","title": "False positive"},"identifiers": {"type": "array","title": "Identifiers","description": "CVE, CWE, and other vulnerability identifiers"},"project_name": {"type": "string","title": "Project name"},"url": {"type": "string","format": "url","title": "URL"}},"required": ["report_type", "severity"]},"mirrorProperties": {},"calculationProperties": {},"aggregationProperties": {},"relations": {"project": {"title": "Project","target": "gitlabRepository","required": false,"many": false}}}
Configure the mapping
The mapping uses nested endpoints to iterate over all GitLab projects and fetch vulnerability findings for each one.
-
Go to your data sources page and open the GitLab vulnerabilities integration.
-
Add the resource mapping below.
Vulnerability findings mapping (click to expand)
resources:- kind: /api/v4/projects/{project_id}/vulnerability_findingsselector:query: .uuid != nullquery_params:scope: allper_page: '100'path_parameters:project_id:endpoint: /api/v4/groups/<group_name>/projectsmethod: GETquery_params:include_subgroups: 'true'data_path: .field: .idfilter: .id > 0port:entity:mappings:identifier: .uuidtitle: .nameblueprint: '"gitlab_vulnerability"'properties:report_type: .report_typeseverity: .severitystate: .statescanner_name: .scanner.namedescription: .descriptionsolution: .solutionfile_path: .location.filestart_line: .location.start_line // 0false_positive: .false_positiveidentifiers: >-[.identifiers[] | {type: .external_type, id: .external_id, name:.name, url: .url}]project_name: .project.nameurl: '"https://gitlab.com" + (.blob_path // "")'relations:project: .project.full_path | ltrimstr("/")Mapping and scopeReplace
group_namein the endpoint with your GitLab group's URL-encoded path. Theinclude_subgroups=trueparameter includes projects from nested subgroups. Thefilteruses.id > 0instead oftruebecause the Port backend can parse the YAML literal'true'as a booleanTrue, which is not valid JQ. UsingGET /api/v4/projectsorGET /api/v4/projects?membership=trueis not recommended because they return projects across all groups and tiers, and non-Ultimate projects will return 403 on the vulnerability findings endpoint.
Add aggregation properties to gitlabRepository
Scorecard rules that count related vulnerabilities use aggregation properties on the gitlabRepository blueprint. Add these so the scorecard conditions have valid properties to reference.
-
Go to the Builder page and select gitlabRepository.
-
Click
{...}and choose Edit JSON. -
Locate the
aggregationPropertiesobject (add it if missing). Merge in the following three properties so each repository can expose counts of related vulnerabilities by scan type and severity:Aggregation properties JSON (click to expand)
{"sast_findings_count": {"title": "SAST findings count","target": "gitlab_vulnerability","pathFilter": [{ "path": ["project"], "fromBlueprint": "gitlab_vulnerability" }],"calculationSpec": { "calculationBy": "entities", "func": "count" },"query": {"combinator": "and","rules": [{ "property": "report_type", "operator": "=", "value": "sast" }]}},"dependency_scanning_findings_count": {"title": "Dependency scanning findings count","target": "gitlab_vulnerability","pathFilter": [{ "path": ["project"], "fromBlueprint": "gitlab_vulnerability" }],"calculationSpec": { "calculationBy": "entities", "func": "count" },"query": {"combinator": "and","rules": [{ "property": "report_type", "operator": "=", "value": "dependency_scanning" }]}},"critical_unresolved_vulns_count": {"title": "Critical unresolved vulnerabilities count","target": "gitlab_vulnerability","pathFilter": [{ "path": ["project"], "fromBlueprint": "gitlab_vulnerability" }],"calculationSpec": { "calculationBy": "entities", "func": "count" },"query": {"combinator": "and","rules": [{ "property": "severity", "operator": "=", "value": "critical" },{ "property": "state", "operator": "!=", "value": "resolved" },{ "property": "state", "operator": "!=", "value": "dismissed" }]}}} -
Save the blueprint.
Set up scorecards
Add a scorecard to the gitlabRepository blueprint to track scanning adoption and vulnerability health.
-
Go to the Builder page and select gitlabRepository.
-
Click the Scorecards tab, then
+ New scorecard. -
Paste the JSON below (it uses the aggregation properties from the previous section). Click Save.
Security scanning coverage scorecard (click to expand)
{"identifier": "security_scanning_coverage","title": "Security Scanning Coverage","levels": [{ "title": "Basic", "color": "paleBlue" },{ "title": "Bronze", "color": "bronze" },{ "title": "Silver", "color": "silver" },{ "title": "Gold", "color": "gold" }],"rules": [{"identifier": "has_sast_findings","title": "SAST scanning enabled","description": "Project has SAST scanning configured and producing findings","level": "Gold","query": {"combinator": "and","conditions": [{"operator": ">","property": "sast_findings_count","value": 0}]}},{"identifier": "has_dependency_scanning","title": "Dependency scanning enabled","description": "Project has dependency scanning configured and producing findings","level": "Silver","query": {"combinator": "and","conditions": [{"operator": ">","property": "dependency_scanning_findings_count","value": 0}]}},{"identifier": "no_critical_vulns","title": "No critical vulnerabilities","description": "Project has zero unresolved critical-severity findings","level": "Gold","query": {"combinator": "and","conditions": [{"operator": "=","property": "critical_unresolved_vulns_count","value": 0}]}}]}
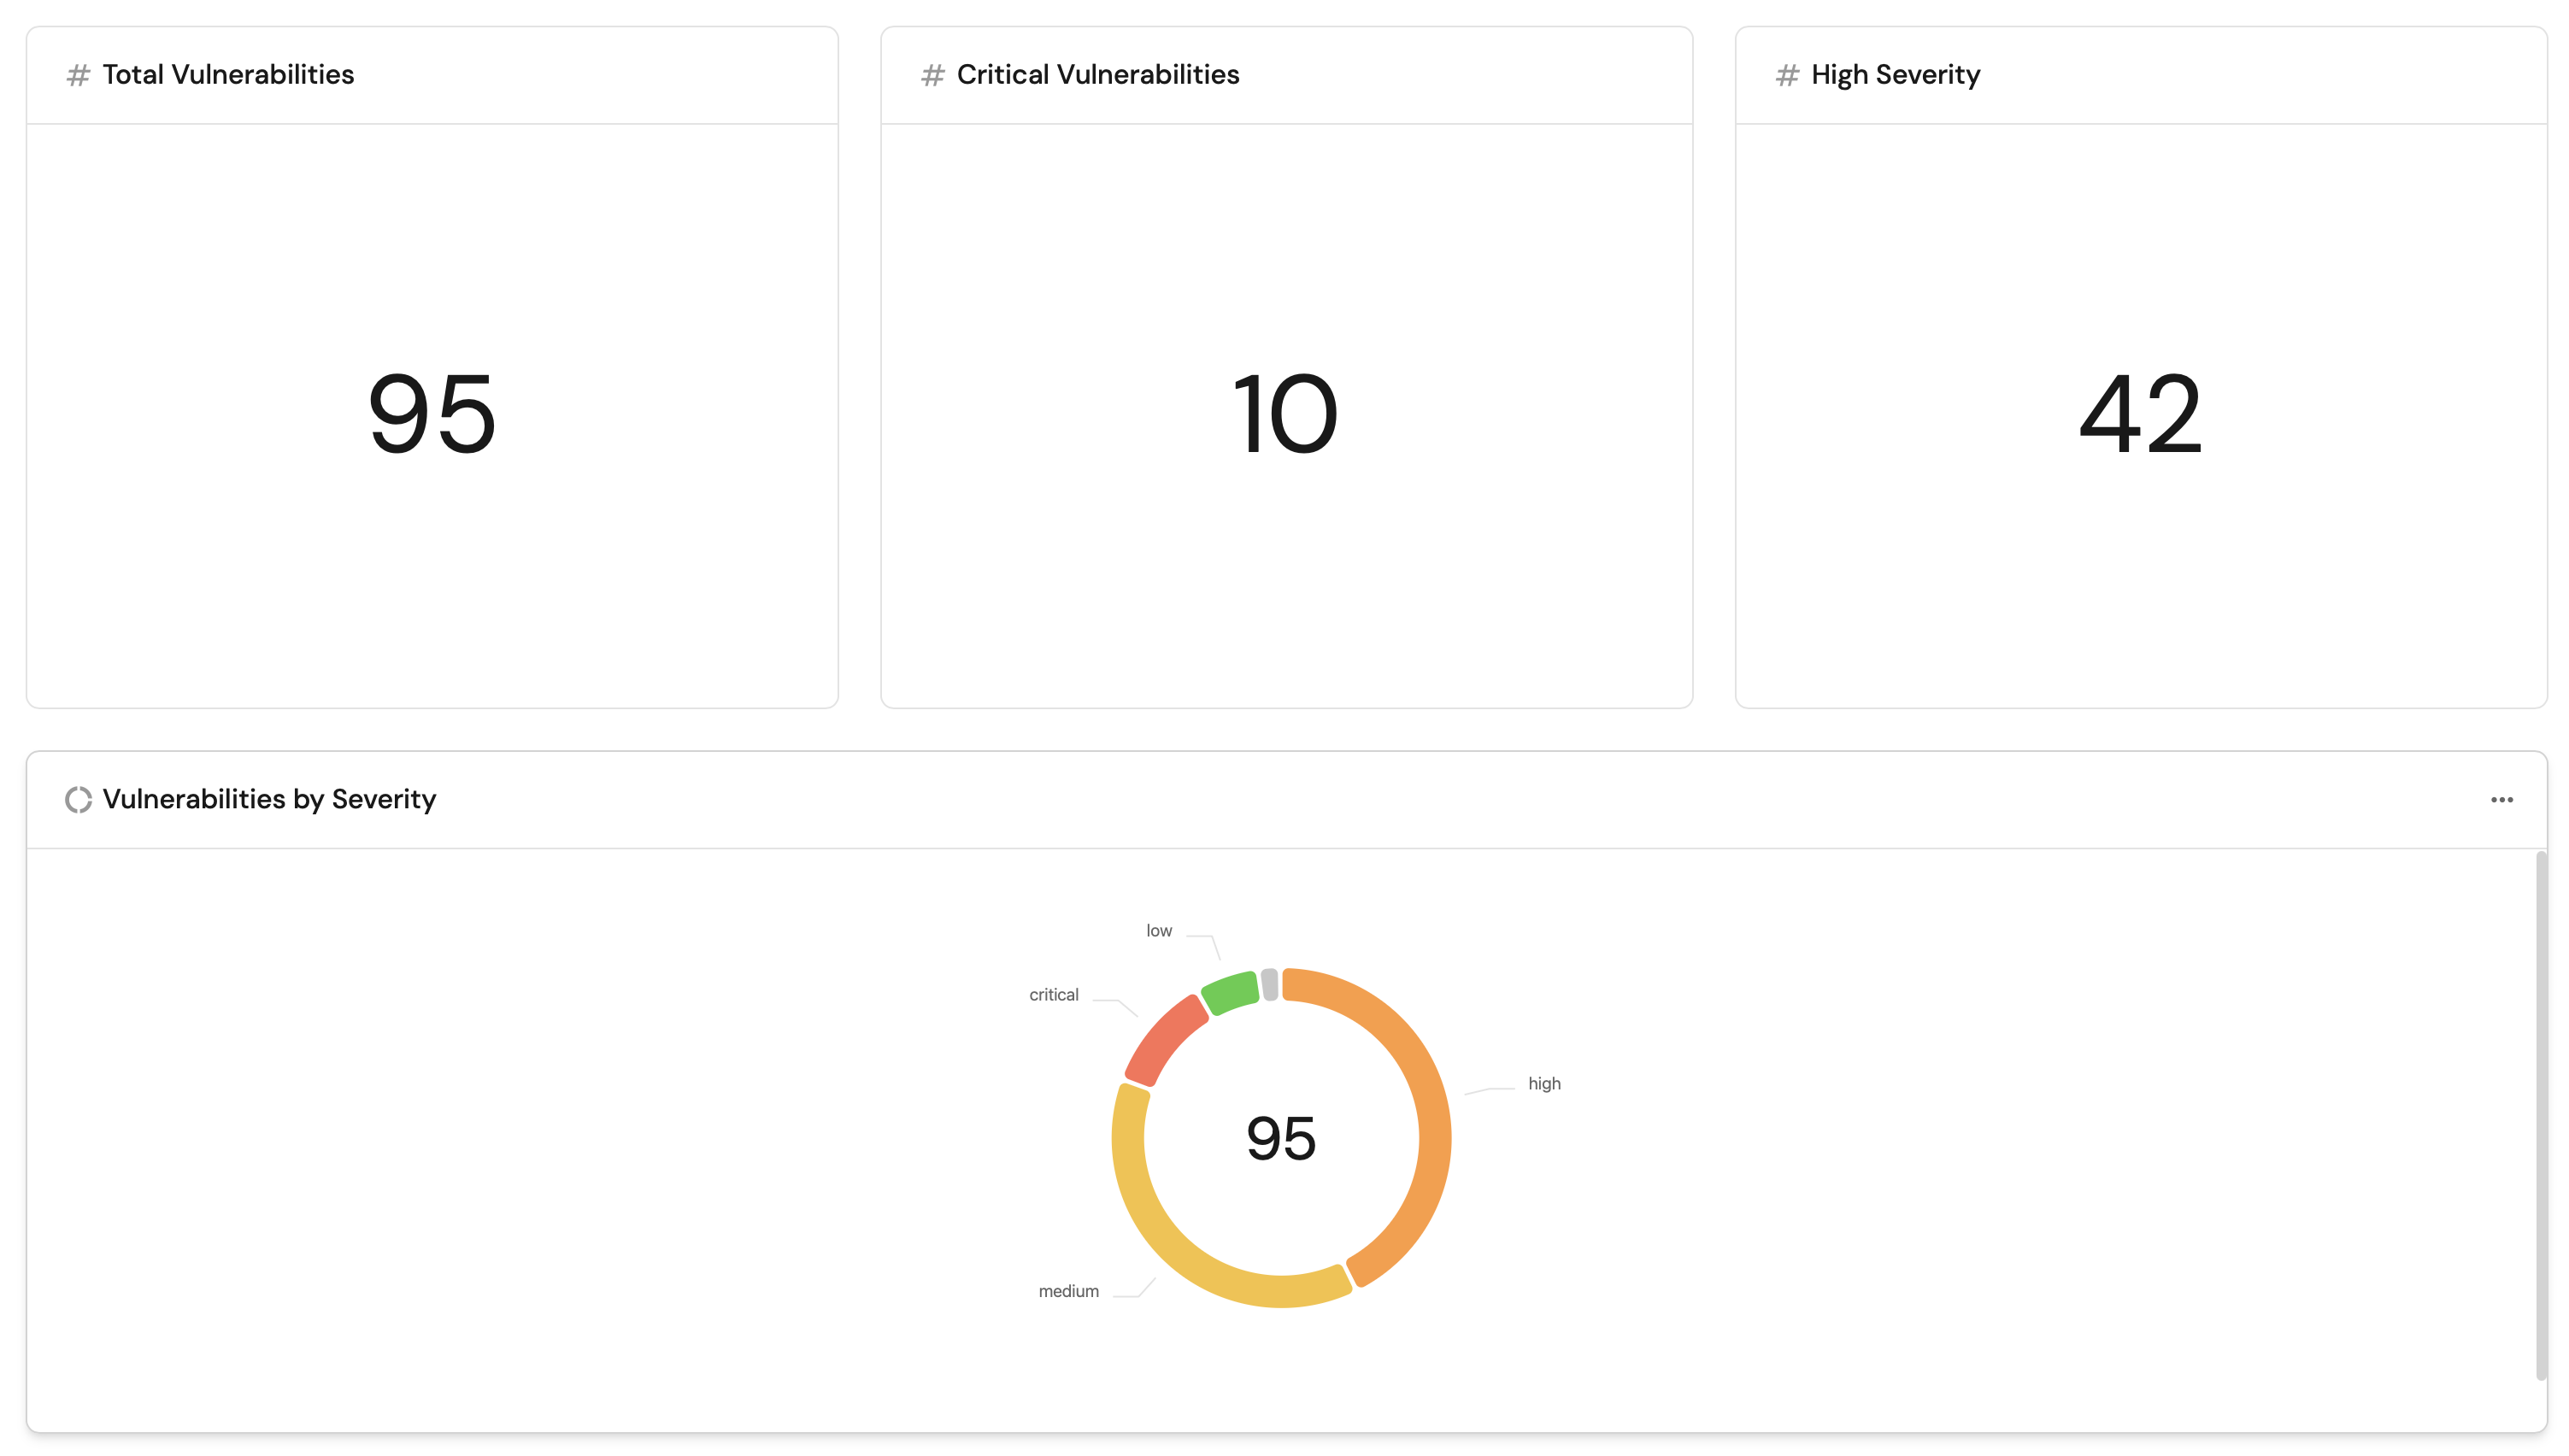
Visualize security posture
After data is ingested, we can create a dashboard to visualize the security posture of our GitLab repositories.
Create a dashboard
-
Go to the Catalog page and click
+> New dashboard. -
Name it GitLab Security Posture, add a description, and click Create.
Add widgets
Total vulnerabilities widget (click to expand)
-
Click
+ Widgetand select Number Chart. -
Fill in the following details:
- Title:
Total Vulnerabilities. - Icon:
Alert. - Blueprint:
gitlab_vulnerability. - Chart type:
Count entities. - Function:
count.
- Title:
-
Click Save.
Critical vulnerabilities widget (click to expand)
-
Click
+ Widgetand select Number Chart. -
Fill in the following details:
- Title:
Critical Vulnerabilities. - Icon:
Alert. - Blueprint:
gitlab_vulnerability. - Chart type:
Count entities. - Function:
count. - Add a filter:
severity=criticalandstate!=resolvedandstate!=dismissed.
- Title:
-
Click Save.
High severity vulnerabilities widget (click to expand)
-
Click
+ Widgetand select Number Chart. -
Fill in the following details:
- Title:
High Severity. - Icon:
Alert. - Blueprint:
gitlab_vulnerability. - Chart type:
Count entities. - Function:
count. - Add a filter:
severity=highandstate!=resolvedandstate!=dismissed.
- Title:
-
Click Save.
Vulnerabilities by severity pie chart (click to expand)
-
Click
+ Widgetand select Pie chart. -
Fill in the following details:
- Title:
Vulnerabilities by Severity. - Icon:
Alert. - Blueprint:
gitlab_vulnerability. - Breakdown by property:
severity.
- Title:
-
Click Save.
Vulnerabilities by scan type pie chart (click to expand)
-
Click
+ Widgetand select Pie chart. -
Fill in the following details:
- Title:
Vulnerabilities by Scan Type. - Icon:
GitLab. - Blueprint:
gitlab_vulnerability. - Breakdown by property:
report_type.
- Title:
-
Click Save.
Vulnerabilities by state bar chart (click to expand)
-
Click
+ Widgetand select Bar Chart. -
Fill in the following details:
- Title:
Vulnerabilities by State. - Icon:
DefaultProperty. - Blueprint:
gitlab_vulnerability. - Breakdown by property:
state.
- Title:
-
Click Save.
Vulnerabilities by project bar chart (click to expand)
-
Click
+ Widgetand select Bar Chart. -
Fill in the following details:
- Title:
Vulnerabilities by Project. - Icon:
GitLab. - Blueprint:
gitlab_vulnerability. - Breakdown by property:
project_name.
- Title:
-
Click Save.
Vulnerability findings table (click to expand)
-
Click
+ Widgetand select Table. -
Fill in the following details:
- Title:
All Vulnerability Findings. - Blueprint:
gitlab_vulnerability.
- Title:
-
Click Save.
-
Click
...on the widget and select Customize table. -
Under Manage Properties, add:
report_type.severity.state.scanner_name.project_name.file_path.false_positive.solution.
-
Click the save icon in the top right corner of the widget.
Next steps
- Automate on critical findings: Set up automations that create a Jira ticket or send a Slack notification when critical vulnerabilities are detected.
- Build team-level views: Use Port's team ownership to group vulnerabilities by team and surface security debt per squad.