Create surveys in your portal
This guide is designed to help you implement and manage a complete survey experience within your organization using Port.
With surveys, you can collect structured feedback, track user responses, and visualize the results in a custom dashboard.
In this guide, we will build the core components:
- Blueprints for surveys, questions, and responses.
- A webhook datasource to capture survey data.
- A self-service action for survey participation.
- A dashboard to monitor survey metrics.
This guide includes various examples of survey implementations for different use cases.
These are great starting points for your own surveys.
You can find them in the Set up a survey action section.
Prerequisites
- Complete the onboarding process.
- Admin access to your Port environment.
Set up the data model
First, let's create the necessary blueprints to store survey data.
We will create several blueprints: Survey Template, Survey, Question, Question Template, and Response.
Survey template blueprint
-
Navigate to your Port Builder page.
-
Click the
+ Blueprintbutton to create a new blueprint. -
Click on the
Edit JSONbutton. -
Copy the definition below and paste it in the editor:
Survey Template blueprint (click to expand)
{"identifier": "survey_template","title": "Survey Template","icon": "GroupBy","schema": {"properties": {"description": {"type": "string","title": "Description"}},"required": []},"mirrorProperties": {},"calculationProperties": {},"aggregationProperties": {},"relations": {}}
Survey blueprint
Create a blueprint for survey:
Survey blueprint (click to expand)
{
  "identifier": "survey",
  "title": "Survey",
  "icon": "Bar",
  "schema": {
    "properties": {
      "description": {
        "type": "string",
        "title": "Description",
        "format": "markdown"
      },
      "version": {
        "icon": "DefaultProperty",
        "type": "string",
        "title": "Version"
      },
      "start_date": {
        "type": "string",
        "title": "Start date",
        "format": "date-time"
      },
      "end_date": {
        "type": "string",
        "title": "End date",
        "format": "date-time"
      }
    },
    "required": []
  },
  "mirrorProperties": {},
  "calculationProperties": {},
  "aggregationProperties": {},
  "relations": {
    "survey_template": {
      "title": "Survey Template",
      "target": "survey_template",
      "required": false,
      "many": false
    }
  }
}
Question template blueprint
Create a blueprint for question templates:
Question Template blueprint (click to expand)
{
  "identifier": "question_template",
  "title": "Question Template",
  "icon": "Template",
  "schema": {
    "properties": {
      "numeric_question": {
        "type": "boolean",
        "title": "Numeric Question"
      }
    },
    "required": []
  },
  "mirrorProperties": {},
  "calculationProperties": {},
  "aggregationProperties": {},
  "relations": {
    "survey_template": {
      "title": "Survey Template",
      "target": "survey_template",
      "required": false,
      "many": false
    }
  }
}
Question blueprint
Create another blueprint for survey questions:
Question blueprint (click to expand)
{
  "identifier": "question",
  "title": "Question",
  "icon": "Bulb",
  "schema": {
    "properties": {
      "numeric_question": {
        "type": "boolean",
        "title": "Numeric Question"
      }
    },
    "required": [
      "numeric_question"
    ]
  },
  "mirrorProperties": {},
  "calculationProperties": {},
  "aggregationProperties": {},
  "relations": {
    "question_template": {
      "title": "Question Template",
      "target": "question_template",
      "required": false,
      "many": false
    },
    "survey": {
      "title": "Survey",
      "target": "survey",
      "required": false,
      "many": false
    }
  }
}
Response blueprint
Finally, create a blueprint for survey responses:
Response blueprint (click to expand)
{
  "identifier": "response",
  "title": "Response",
  "icon": "Register",
  "schema": {
    "properties": {
      "value": {
        "icon": "DefaultProperty",
        "type": "string",
        "title": "Answer"
      }
    },
    "required": []
  },
  "mirrorProperties": {
    "team": {
      "title": "Team",
      "path": "user.$team.$identifier"
    },
    "question_template_identifier": {
      "title": "Question Template Identifier",
      "path": "question.question_template.$identifier"
    },
    "survey_title": {
      "title": "Survey Title",
      "path": "question.survey.$title"
    }
  },
  "calculationProperties": {
    "numeric_value": {
      "title": "Numeric Value",
      "icon": "DefaultProperty",
      "calculation": ".properties.value | (tonumber // null)",
      "type": "number"
    }
  },
  "aggregationProperties": {},
  "relations": {
    "user": {
      "title": "User",
      "target": "_user",
      "required": false,
      "many": false
    },
    "current_team": {
      "title": "Current Team",
      "target": "_team",
      "required": false,
      "many": true
    },
    "question": {
      "title": "Question",
      "target": "question",
      "required": false,
      "many": false
    }
  }
}
Add calculation and aggregation properties
Now that we have our basic blueprints set up, let's add calculation and aggregation properties to enable advanced metrics and analytics for our surveys.
Add score tracking to question template
Go to the builder page, find and expand the Question Template blueprint.
Click on the ... button and select Edit blueprint, then click on the Edit JSON button.
-
Let's add a calculation property to create a scorecard based on average scores.
Under thecalculationPropertieskey, paste the following JSON:"calculationProperties": {"avg_score_scorecard": {"title": "Score Standards","icon": "DefaultProperty","calculation": "if (.properties.avg_score == null) then null else if (.properties.avg_score < 3) then \"low\" elif (.properties.avg_score <= 4) then \"medium\" else \"high\" end end","type": "string","colorized": true,"colors": {"low": "red","medium": "yellow","high": "green"}}}This calculation property creates a color-coded scorecard that categorizes average scores into three levels:
- Low (red): scores below 3
- Medium (yellow): scores between 3 and 4
- High (green): scores above 4
-
Let's add an aggregation property to calculate the average score from responses.
Under theaggregationPropertieskey, paste the following JSON:"aggregationProperties": {"avg_score": {"title": "Avg. Score","type": "number","target": "response","calculationSpec": {"func": "average","averageOf": "total","property": "numeric_value","calculationBy": "property","measureTimeBy": "$createdAt"}}}This aggregation property:
- Calculates the average of all numeric responses
- Uses the
numeric_valuefrom responses - Updates in real-time as new responses are submitted
Add score tracking to question
Go to the builder page, find and expand the Question blueprint.
Click on the ... button and select Edit blueprint, then click on the Edit JSON button.
-
Under the
calculationPropertieskey, paste the following JSON:"calculationProperties": {"avg_score_scorecard": {"title": "Score Standards","icon": "DefaultProperty","calculation": "if (.properties.avg_score == null) then null else if (.properties.avg_score < 3) then \"low\" elif (.properties.avg_score <= 4) then \"medium\" else \"high\" end end","type": "string","colorized": true,"colors": {"low": "red","medium": "yellow","high": "green"}}} -
Under the
aggregationPropertieskey, paste the following JSON:"aggregationProperties": {"avg_score": {"title": "Avg. Score","icon": "DefaultProperty","type": "number","target": "response","calculationSpec": {"func": "average","averageOf": "total","property": "numeric_value","calculationBy": "property","measureTimeBy": "$createdAt"}}}
Add mirror properties to response
Go to the builder page, find and expand the Response blueprint.
Click on the ... button and select Edit blueprint, then click on the Edit JSON button.
Under the mirrorProperties key, paste the following JSON:
"mirrorProperties": {
  "avg_score": {
    "title": "Avg Score",
    "path": "question.avg_score"
  }
}
This mirror property allows responses to reflect the average score from their related questions, providing easy access to this metric at the response level.
Create a webhook datasource
To capture survey responses, let's set up a webhook datasource:
-
Go to the Data Sources page of your portal.
-
Click
+ Data Source. -
Select
Webhook. -
Select
Custom Integration. -
Title it
Calculate Survey Response. -
Configure the webhook with the following mapping:
Webhook configuration (click to expand)
[{"blueprint": "survey_template","operation": "create","filter": "true","entity": {"identifier": ".body.port_context.actionId","title": ".body.port_context.actionId"}},{"blueprint": "survey","operation": "create","filter": "true","entity": {"identifier": "[(.body.port_context.actionId | ascii_downcase | gsub(\" \"; \"_\")), (.body.port_context.version | ascii_downcase | gsub(\" \"; \"_\"))] | join(\"_\")","title": "[.body.port_context.actionId, .body.port_context.version] | join(\" \")","properties": {"version": ".body.port_context.version"},"relations": {"survey_template": ".body.port_context.actionId"}}},{"blueprint": "question","operation": "create","itemsToParse": ".body.responses","entity": {"identifier": "[.item.key,(.body.port_context.actionId | ascii_downcase | gsub(\" \"; \"_\")), (.body.port_context.version | ascii_downcase | gsub(\" \"; \"_\"))] | join (\"_\")","title": "[.item.key,(.body.port_context.actionId | ascii_downcase | gsub(\" \"; \"_\")), (.body.port_context.version | ascii_downcase | gsub(\" \"; \"_\"))] | join (\"_\")","properties": {"numeric_question": ".item.value | type == \"number\""},"relations": {"question_template": ".item.key","survey": "[(.body.port_context.actionId | ascii_downcase | gsub(\" \"; \"_\")), (.body.port_context.version | ascii_downcase | gsub(\" \"; \"_\"))] | join(\"_\")"}}},{"blueprint": "question_template","operation": "create","itemsToParse": ".body.responses","entity": {"identifier": ".item.key","title": ".item.key","properties": {"numeric_question": ".item.value | type == \"number\""},"relations": {"survey_template": "(.body.port_context.actionId | ascii_downcase | gsub(\" \"; \"_\"))"}}},{"blueprint": "response","operation": "create","itemsToParse": ".body.responses","entity": {"identifier": "[.headers.run_id, .item.key, .item.value] | join(\"_\") | gsub(\" |/|,|\\\\.|\\\\(|\\\\)\"; \"\")","title": "[.headers.run_id, .item.key, .item.value] | join(\" \") | gsub(\" |/|,|\\\\.|\\\\(|\\\\)\"; \"\")","properties": {"value": ".item.value"},"relations": {"question": "[.item.key,(.body.port_context.actionId | ascii_downcase | gsub(\" \"; \"_\")), (.body.port_context.version | ascii_downcase | gsub(\" \"; \"_\"))] | join (\"_\")","user": ".body.port_context.user","current_team": ".body.port_context.teams"}}}]Webhook URLMake sure to copy and save the webhook URL - you'll need it when configuring the survey action in the next section.
Understanding survey versions
The version property in the survey configuration enables you to run the same survey multiple times and track responses over time. This is particularly useful for:
- Running periodic surveys (e.g., quarterly developer satisfaction surveys).
- Comparing results across different time periods.
- Tracking trends and improvements.
When you create a new instance of a survey:
- The survey template remains the same.
- A new survey entity is created with a unique version (e.g., "Q1 2024", "Q2 2024").
- All responses are linked to this specific version.
- The aggregation properties will show metrics both per version and across all versions.
For example, you can:
- Compare average scores between Q1 and Q2.
- Track improvement trends over multiple quarters.
- View combined statistics across all versions of the survey.
The distinction between Question Templates and Questions is similar:
- Question Templates define the base structure of questions that can be reused across different survey versions.
- Questions are specific instances of these templates, linked to a particular survey version.
- This allows you to track responses to the same question across different survey versions while maintaining the connection to the original template.
Use a consistent versioning format (e.g., "Q1 2024", "Q2 2024") to make it easier to organize and compare survey results.
Set up a survey action
Below are various examples of survey actions, covering common use cases.
You can use these examples for your own survey actions, or modify them to fit your specific needs.
To create a survey action in your portal:
-
Go to the self-service page.
-
Click
+ Actionbutton to create a new action. -
Click on the
Edit JSONbutton. -
Copy the definition of the relevant survey action and paste it in the editor:
- Custom survey
- Developer experience
- Incident & on-call
- Milestone & project
- New hire onboarding
- Tooling & error
Survey action configuration (click to expand)
{
  "identifier": "example_survey",
  "title": "Example Survey",
  "icon": "Chat",
  "trigger": {
    "type": "self-service",
    "operation": "CREATE",
    "userInputs": {
      "properties": {
        "how_would_you_rate_this_rating": {
          "type": "number",
          "title": "Example Rating Question (0-5)",
          "enum": [
            5,
            4,
            3,
            2,
            1,
            0
          ],
          "enumColors": {
            "0": "lightGray",
            "1": "red",
            "2": "orange",
            "3": "yellow",
            "4": "blue",
            "5": "green"
          }
        },
        "select_from_options": {
          "type": "string",
          "title": "Example Selection Question",
          "enum": [
            "Option A",
            "Option B",
            "Option C",
            "Option D"
          ]
        },
        "what_do_you_think_on_this_open": {
          "type": "string",
          "title": "Example Open-Ended Question"
        },
        "version": {
          "title": "Version",
          "icon": "DefaultProperty",
          "type": "string",
          "default": "Q1 2025",
          "visible": false
        },
        "user": {
          "type": "string",
          "title": "user",
          "blueprint": "_user",
          "format": "entity",
          "default": {
            "jqQuery": ".user.email"
          },
          "visible": false
        }
      },
      "required": [],
      "steps": [
        {
          "title": "First Step",
          "order": [
            "how_would_you_rate_this_rating",
            "select_from_options"
          ]
        },
        {
          "title": "Second Step",
          "order": [
            "what_do_you_think_on_this_open"
          ]
        },
        {
          "title": "Final",
          "order": [
            "version",
            "user"
          ]
        }
      ]
    }
  },
  "invocationMethod": {
    "type": "WEBHOOK",
    "url": "https://example.com",
    "agent": false,
    "synchronized": true,
    "method": "POST",
    "headers": {
      "RUN_ID": "{{ .run.id }}"
    },
    "body": {
      "responses": "{{ .inputs | del(.[\"user\"]) | to_entries | map( if (.value | type) == \"array\" then (. as {key: $k, value: $vals} | $vals | map({\"key\": $k, \"value\": .})) else {\"key\": .key, \"value\": .value} end ) | flatten }}",
      "port_context": {
        "runId": "{{ .run.id }}",
        "actionId": "{{.action.identifier}}",
        "user": "{{.trigger.by.user.email}}",
        "teams": "{{ .inputs.user.team }}",
        "version": "{{ .inputs.version }}"
      }
    }
  },
  "requiredApproval": false
}
- Developer experience
- Developer satisfaction
- Portal feedback
Survey action configuration (click to expand)
{
  "identifier": "devex_survey",
  "title": "Developer Experience Survey",
  "icon": "Rocket",
  "trigger": {
    "type": "self-service",
    "operation": "CREATE",
    "userInputs": {
      "properties": {
        "time_allocation": {
          "type": "array",
          "title": "Which tasks take up the most time in your workflow?",
          "items": {
            "type": "string",
            "enum": [
              "Reviewing PRs",
              "Writing new features",
              "Managing incidents",
              "Solving bugs",
              "Ops-related tasks",
              "Refactoring code",
              "Attending meetings"
            ]
          },
          "uniqueItems": true
        },
        "bottlenecks": {
          "type": "array",
          "title": "Which blockers most impact your productivity?",
          "items": {
            "type": "string",
            "enum": [
              "Waiting for PR reviews",
              "Pending DevOps support",
              "Locating service owners",
              "CI/CD inefficiencies",
              "Security approvals"
            ]
          },
          "uniqueItems": true
        },
        "code_review_feedback": {
          "icon": "DefaultProperty",
          "title": "I receive timely feedback during code reviews (5 - Strongly Agree, 1 - Strongly Disagree)",
          "type": "number",
          "enum": [
            1,
            2,
            3,
            4,
            5
          ],
          "enumColors": {
            "1": "red",
            "2": "orange",
            "3": "yellow",
            "4": "blue",
            "5": "green"
          }
        },
        "automation_speed": {
          "icon": "DefaultProperty",
          "title": "The automated tests in our development process are fast and reliable (5 - Strongly Agree, 1 - Strongly Disagree)",
          "type": "number",
          "enum": [
            1,
            2,
            3,
            4,
            5
          ],
          "enumColors": {
            "1": "red",
            "2": "orange",
            "3": "yellow",
            "4": "blue",
            "5": "green"
          }
        },
        "task_ownership": {
          "icon": "DefaultProperty",
          "title": "The objectives and ownership for my tasks are clearly defined (5 - Strongly Agree, 1 - Strongly Disagree)",
          "type": "number",
          "enum": [
            1,
            2,
            3,
            4,
            5
          ],
          "enumColors": {
            "1": "red",
            "2": "orange",
            "3": "yellow",
            "4": "blue",
            "5": "green"
          }
        },
        "independence": {
          "icon": "DefaultProperty",
          "title": "I can confidently troubleshoot production issues on my own (5 - Strongly Agree, 1 - Strongly Disagree)",
          "type": "number",
          "enum": [
            1,
            2,
            3,
            4,
            5
          ],
          "enumColors": {
            "1": "red",
            "2": "orange",
            "3": "yellow",
            "4": "blue",
            "5": "green"
          }
        },
        "documentation_clarity": {
          "icon": "DefaultProperty",
          "title": "I can easily find and understand documentation (5 - Strongly Agree, 1 - Strongly Disagree)",
          "type": "number",
          "enum": [
            1,
            2,
            3,
            4,
            5
          ],
          "enumColors": {
            "1": "red",
            "2": "orange",
            "3": "yellow",
            "4": "blue",
            "5": "green"
          }
        },
        "guidance_access": {
          "icon": "DefaultProperty",
          "title": "I can quickly get useful technical guidance when needed (5 - Strongly Agree, 1 - Strongly Disagree)",
          "type": "number",
          "enum": [
            1,
            2,
            3,
            4,
            5
          ],
          "enumColors": {
            "1": "red",
            "2": "orange",
            "3": "yellow",
            "4": "blue",
            "5": "green"
          }
        },
        "uninterrupted_work": {
          "icon": "DefaultProperty",
          "title": "I am able to work for extended periods without interruption (5 - Strongly Agree, 1 - Strongly Disagree)",
          "type": "number",
          "enum": [
            1,
            2,
            3,
            4,
            5
          ],
          "enumColors": {
            "1": "red",
            "2": "orange",
            "3": "yellow",
            "4": "blue",
            "5": "green"
          }
        },
        "disruptions": {
          "icon": "DefaultProperty",
          "title": "My planned work is rarely disrupted by unexpected requests (5 - Strongly Agree, 1 - Strongly Disagree)",
          "type": "number",
          "enum": [
            1,
            2,
            3,
            4,
            5
          ],
          "enumColors": {
            "1": "red",
            "2": "orange",
            "3": "yellow",
            "4": "blue",
            "5": "green"
          }
        },
        "oncall_balance": {
          "icon": "DefaultProperty",
          "title": "I can effectively balance on-call duties with other work (5 - Strongly Agree, 1 - Strongly Disagree)",
          "type": "number",
          "enum": [
            1,
            2,
            3,
            4,
            5
          ],
          "enumColors": {
            "1": "red",
            "2": "orange",
            "3": "yellow",
            "4": "blue",
            "5": "green"
          }
        },
        "integration_testing": {
          "icon": "DefaultProperty",
          "title": "Our integration and testing process is smooth and efficient (5 - Strongly Agree, 1 - Strongly Disagree)",
          "type": "number",
          "enum": [
            1,
            2,
            3,
            4,
            5
          ],
          "enumColors": {
            "1": "red",
            "2": "orange",
            "3": "yellow",
            "4": "blue",
            "5": "green"
          }
        },
        "repetitive_tasks": {
          "icon": "DefaultProperty",
          "title": "Repetitive, manual tasks rarely slow down my development (5 - Strongly Agree, 1 - Strongly Disagree)",
          "type": "number",
          "enum": [
            1,
            2,
            3,
            4,
            5
          ],
          "enumColors": {
            "1": "red",
            "2": "orange",
            "3": "yellow",
            "4": "blue",
            "5": "green"
          }
        },
        "process_updates": {
          "icon": "DefaultProperty",
          "title": "I regularly see improvements to documentation and processes (5 - Strongly Agree, 1 - Strongly Disagree)",
          "type": "number",
          "enum": [
            1,
            2,
            3,
            4,
            5
          ],
          "enumColors": {
            "1": "red",
            "2": "orange",
            "3": "yellow",
            "4": "blue",
            "5": "green"
          }
        },
        "open_feedback": {
          "type": "string",
          "title": "What would make your work more efficient and satisfying?",
          "description": "Please provide your suggestions"
        },
        "version": {
          "icon": "DefaultProperty",
          "type": "string",
          "title": "Version",
          "default": "Q1 2025",
          "visible": false
        },
        "user": {
          "type": "string",
          "title": "User",
          "blueprint": "_user",
          "format": "entity",
          "default": {
            "jqQuery": ".user.email"
          },
          "visible": false
        }
      },
      "required": [],
      "steps": [
        {
          "title": "Time & Bottlenecks",
          "order": [
            "time_allocation",
            "bottlenecks"
          ]
        },
        {
          "title": "Workflow & Process",
          "order": [
            "code_review_feedback",
            "automation_speed",
            "task_ownership",
            "independence"
          ]
        },
        {
          "title": "Documentation & Support",
          "order": [
            "documentation_clarity",
            "guidance_access"
          ]
        },
        {
          "title": "Focus & Balance",
          "order": [
            "uninterrupted_work",
            "disruptions",
            "oncall_balance"
          ]
        },
        {
          "title": "Process Efficiency",
          "order": [
            "integration_testing",
            "repetitive_tasks",
            "process_updates"
          ]
        },
        {
          "title": "Additional Feedback",
          "order": [
            "open_feedback"
          ]
        },
        {
          "title": "Final",
          "order": [
            "version",
            "user"
          ]
        }
      ]
    },
    "blueprintIdentifier": "survey_template"
  },
  "invocationMethod": {
    "type": "WEBHOOK",
    "url": "https://ingest.port.io/YourWebhookUrl",
    "agent": false,
    "synchronized": true,
    "method": "POST",
    "headers": {
      "RUN_ID": "{{ .run.id }}"
    },
    "body": {
      "responses": "{{ .inputs | del(.[\"user\"]) | to_entries | map( if ((.value | type) == \"array\") then (. as {key: $k, value: $vals} | $vals | map({\"key\": $k, \"value\": .})) else {\"key\": .key, \"value\": .value} end ) | flatten }}",
      "port_context": {
        "runId": "{{ .run.id }}",
        "actionId": "{{ .action.identifier }}",
        "user": "{{ .trigger.by.user.email }}",
        "teams": "{{ .inputs.user.team }}",
        "version": "{{ .inputs.version }}"
      }
    }
  },
  "requiredApproval": false
}
Survey action configuration (click to expand)
{
  "identifier": "developer_satisfaction_survey",
  "title": "Developer Satisfaction Survey",
  "icon": "Health",
  "trigger": {
    "type": "self-service",
    "operation": "CREATE",
    "userInputs": {
      "properties": {
        "overall_role_satisfaction": {
          "icon": "DefaultProperty",
          "title": "How satisfied are you with your current role? (1 = Lowest, 5 = Highest)",
          "type": "number",
          "enum": [
            1,
            2,
            3,
            4,
            5
          ],
          "enumColors": {
            "1": "lightGray",
            "2": "lightGray",
            "3": "lightGray",
            "4": "lightGray",
            "5": "lightGray"
          }
        },
        "work_life_balance": {
          "icon": "DefaultProperty",
          "title": "How would you rate your work-life balance? (1 = Lowest, 5 = Highest)",
          "type": "number",
          "enum": [
            1,
            2,
            3,
            4,
            5
          ],
          "enumColors": {
            "1": "lightGray",
            "2": "lightGray",
            "3": "lightGray",
            "4": "lightGray",
            "5": "lightGray"
          }
        },
        "daily_motivation": {
          "icon": "DefaultProperty",
          "title": "How motivated do you feel about your work on a typical day? (1 = Lowest, 5 = Highest)",
          "type": "number",
          "enum": [
            1,
            2,
            3,
            4,
            5
          ],
          "enumColors": {
            "1": "lightGray",
            "2": "lightGray",
            "3": "lightGray",
            "4": "lightGray",
            "5": "lightGray"
          }
        },
        "stress_level": {
          "icon": "DefaultProperty",
          "title": "How would you rate your overall stress level at work? (1 = Lowest, 5 = Highest)",
          "type": "number",
          "enum": [
            1,
            2,
            3,
            4,
            5
          ],
          "enumColors": {
            "1": "lightGray",
            "2": "lightGray",
            "3": "lightGray",
            "4": "lightGray",
            "5": "lightGray"
          }
        },
        "stress_factors": {
          "icon": "DefaultProperty",
          "type": "string",
          "title": "What factors contribute most to your stress?",
          "description": "Please elaborate if your stress level is below 5.",
          "visible": {
            "jqQuery": ".form.stress_level < 5 and .form.stress_level != null"
          }
        },
        "key_influencers": {
          "icon": "DefaultProperty",
          "type": "string",
          "title": "What are the main factors that currently affect your job satisfaction? Please list up to three.",
          "enum": [
            "Work-life balance",
            "Compensation & benefits",
            "Career growth opportunities",
            "Management & leadership support",
            "Team collaboration and communication",
            "Work environment and culture",
            "Recognition and rewards",
            "Technical challenges"
          ],
          "enumColors": {}
        },
        "additional_comments_section1": {
          "icon": "DefaultProperty",
          "type": "string",
          "title": "Any further information regarding your overall satisfaction & well-being?"
        },
        "process_efficiency": {
          "icon": "DefaultProperty",
          "type": "number",
          "title": "How effective are our current development processes (e.g., code reviews, agile ceremonies) in supporting your work?",
          "enum": [
            1,
            2,
            3,
            4,
            5
          ]
        },
        "tool_quality": {
          "icon": "DefaultProperty",
          "title": "How satisfied are you with the quality and usability of the tools provided? (1 = Lowest, 5 = Highest)",
          "type": "number",
          "enum": [
            1,
            2,
            3,
            4,
            5
          ],
          "enumColors": {
            "1": "lightGray",
            "2": "lightGray",
            "3": "lightGray",
            "4": "lightGray",
            "5": "lightGray"
          }
        },
        "recurring_issues": {
          "icon": "DefaultProperty",
          "type": "array",
          "title": "Do you experience recurring issues with any tools or processes? (Select all that apply)",
          "items": {
            "type": "string",
            "enum": [
              "Code Reviews",
              "Agile Ceremonies",
              "Tool Quality",
              "Documentation",
              "Other"
            ]
          }
        },
        "recurring_issues_other_specify": {
          "icon": "DefaultProperty",
          "type": "string",
          "title": "If Other, please specify:",
          "visible": {
            "jqQuery": ".form.recurring_issues | index(\"Other\") != null"
          }
        },
        "improvement_suggestions_process": {
          "icon": "DefaultProperty",
          "type": "string",
          "title": "What is one improvement you would suggest to enhance our tools or processes?"
        },
        "additional_comments_section2": {
          "icon": "DefaultProperty",
          "type": "string",
          "title": "Any further comments on process & tooling effectiveness?"
        },
        "team_communication": {
          "icon": "DefaultProperty",
          "title": "How effective is the communication within your team? (1 = Lowest, 5 = Highest)",
          "type": "number",
          "enum": [
            1,
            2,
            3,
            4,
            5
          ],
          "enumColors": {
            "1": "lightGray",
            "2": "lightGray",
            "3": "lightGray",
            "4": "lightGray",
            "5": "lightGray"
          }
        },
        "collaboration": {
          "icon": "DefaultProperty",
          "title": "How would you rate the level of collaboration on projects within your team? (1 = Lowest, 5 = Highest)",
          "type": "number",
          "enum": [
            1,
            2,
            3,
            4,
            5
          ],
          "enumColors": {
            "1": "lightGray",
            "2": "lightGray",
            "3": "lightGray",
            "4": "lightGray",
            "5": "lightGray"
          }
        },
        "peer_feedback": {
          "icon": "DefaultProperty",
          "title": "How satisfied are you with the feedback and recognition you receive from your peers? (1 = Lowest, 5 = Highest)",
          "type": "number",
          "enum": [
            1,
            2,
            3,
            4,
            5
          ],
          "enumColors": {
            "1": "lightGray",
            "2": "lightGray",
            "3": "lightGray",
            "4": "lightGray",
            "5": "lightGray"
          }
        },
        "collaboration_enhancements": {
          "icon": "DefaultProperty",
          "type": "string",
          "title": "What change could most improve collaboration within your team?"
        },
        "additional_comments_section3": {
          "icon": "DefaultProperty",
          "type": "string",
          "title": "Any further thoughts on team collaboration & communication?"
        },
        "support_for_development": {
          "icon": "DefaultProperty",
          "title": "How supported do you feel in your professional development? (1 = Lowest, 5 = Highest)",
          "type": "number",
          "enum": [
            1,
            2,
            3,
            4,
            5
          ],
          "enumColors": {
            "1": "lightGray",
            "2": "lightGray",
            "3": "lightGray",
            "4": "lightGray",
            "5": "lightGray"
          }
        },
        "learning_opportunities": {
          "icon": "DefaultProperty",
          "title": "How satisfied are you with the opportunities for learning and advancement provided by the organization? (1 = Lowest, 5 = Highest)",
          "type": "number",
          "enum": [
            1,
            2,
            3,
            4,
            5
          ],
          "enumColors": {
            "1": "lightGray",
            "2": "lightGray",
            "3": "lightGray",
            "4": "lightGray",
            "5": "lightGray"
          }
        },
        "resource_needs": {
          "icon": "DefaultProperty",
          "type": "string",
          "title": "What additional training or resources would help you grow professionally?"
        },
        "career_path_clarity": {
          "icon": "DefaultProperty",
          "title": "How clear is your career progression path within the organization? (1 = Lowest, 5 = Highest)",
          "type": "number",
          "enum": [
            1,
            2,
            3,
            4,
            5
          ],
          "enumColors": {
            "1": "lightGray",
            "2": "lightGray",
            "3": "lightGray",
            "4": "lightGray",
            "5": "lightGray"
          }
        },
        "additional_comments_section4": {
          "icon": "DefaultProperty",
          "type": "string",
          "title": "Any further comments on career growth & professional development?"
        },
        "manager_communication": {
          "icon": "DefaultProperty",
          "title": "How effectively does your manager communicate expectations and provide feedback? (1 = Lowest, 5 = Highest)",
          "type": "number",
          "enum": [
            1,
            2,
            3,
            4,
            5
          ],
          "enumColors": {
            "1": "lightGray",
            "2": "lightGray",
            "3": "lightGray",
            "4": "lightGray",
            "5": "lightGray"
          }
        },
        "cultural_alignment": {
          "icon": "DefaultProperty",
          "title": "How aligned do you feel with the company’s vision and values? (1 = Lowest, 5 = Highest)",
          "type": "number",
          "enum": [
            1,
            2,
            3,
            4,
            5
          ],
          "enumColors": {
            "1": "lightGray",
            "2": "lightGray",
            "3": "lightGray",
            "4": "lightGray",
            "5": "lightGray"
          }
        },
        "organizational_improvements": {
          "icon": "DefaultProperty",
          "type": "string",
          "title": "What is one suggestion you have for improving our overall organizational culture?"
        },
        "additional_comments_section5": {
          "icon": "DefaultProperty",
          "type": "string",
          "title": "Any further feedback on management & organizational culture?"
        },
        "top_change_request": {
          "icon": "DefaultProperty",
          "type": "string",
          "title": "What is one change that would most improve your overall satisfaction at work?"
        },
        "additional_comments_section6": {
          "icon": "DefaultProperty",
          "type": "string",
          "title": "Any additional comments or suggestions?"
        },
        "version": {
          "icon": "DefaultProperty",
          "type": "string",
          "title": "Version",
          "default": "Q1 2025",
          "visible": false
        },
        "user": {
          "type": "string",
          "title": "User",
          "blueprint": "_user",
          "format": "entity",
          "default": {
            "jqQuery": ".user.email"
          },
          "visible": false
        }
      },
      "required": [
        "version"
      ],
      "steps": [
        {
          "title": "Overall Satisfaction",
          "order": [
            "overall_role_satisfaction",
            "work_life_balance",
            "daily_motivation",
            "stress_level",
            "stress_factors",
            "key_influencers",
            "additional_comments_section1"
          ]
        },
        {
          "title": "Process Effectiveness",
          "order": [
            "process_efficiency",
            "tool_quality",
            "recurring_issues",
            "recurring_issues_other_specify",
            "improvement_suggestions_process",
            "additional_comments_section2"
          ]
        },
        {
          "title": "Team Collaboration",
          "order": [
            "team_communication",
            "collaboration",
            "peer_feedback",
            "collaboration_enhancements",
            "additional_comments_section3"
          ]
        },
        {
          "title": "Professional Development",
          "order": [
            "support_for_development",
            "learning_opportunities",
            "resource_needs",
            "career_path_clarity",
            "additional_comments_section4"
          ]
        },
        {
          "title": "Organizational Culture",
          "order": [
            "manager_communication",
            "cultural_alignment",
            "organizational_improvements",
            "additional_comments_section5"
          ]
        },
        {
          "title": "Open Feedback",
          "order": [
            "top_change_request",
            "additional_comments_section6"
          ]
        },
        {
          "title": "Final",
          "order": [
            "version",
            "user"
          ]
        }
      ]
    },
    "blueprintIdentifier": "survey_template"
  },
  "invocationMethod": {
    "type": "WEBHOOK",
    "url": "https://ingest.port.io/YourWebhookUrl",
    "agent": false,
    "synchronized": true,
    "method": "POST",
    "headers": {
      "RUN_ID": "{{ .run.id }}"
    },
    "body": {
      "responses": "{{ .inputs | del(.[\"user\"]) | to_entries | map( if ((.value | type) == \"array\") then (. as {key: $k, value: $vals} | $vals | map({\"key\": $k, \"value\": .})) else {\"key\": .key, \"value\": .value} end ) | flatten }}",
      "port_context": {
        "runId": "{{ .run.id }}",
        "actionId": "{{ .action.identifier }}",
        "user": "{{ .trigger.by.user.email }}",
        "teams": "{{ .inputs.user.team }}",
        "version": "{{ .inputs.version }}"
      }
    }
  },
  "requiredApproval": false
}
Survey action configuration (click to expand)
{
"identifier": "internal_developer_portal_feedback_survey",
"title": "Internal Developer Portal Feedback Survey",
"icon": "Port",
"trigger": {
"type": "self-service",
"operation": "CREATE",
"userInputs": {
"properties": {
"frequency_of_use": {
"icon": "DefaultProperty",
"type": "string",
"title": "How often do you use the internal developer portal?",
"enum": [
"Daily",
"Several times a week",
"Once a week",
"Rarely",
"Never"
]
},
"primary_tasks": {
"icon": "DefaultProperty",
"type": "array",
"title": "Which of the following tasks do you primarily use the portal for?",
"description": "Select all that apply",
"items": {
"type": "string",
"enum": [
"Accessing documentation",
"Requesting services",
"Monitoring deployments",
"Finding APIs",
"Onboarding new services",
"Reporting issues",
"Other"
]
}
},
"primary_tasks_other_specify": {
"icon": "DefaultProperty",
"type": "string",
"title": "If Other, please specify",
"visible": {
"jqQuery": ".form.primary_tasks | index(\"Other\") != null"
}
},
"role_context": {
"icon": "DefaultProperty",
"type": "string",
"title": "What is your primary role?",
"enum": [
"Front-end developer",
"Back-end developer",
"DevOps/SRE",
"QA",
"Manager",
"Other"
]
},
"role_context_other_specify": {
"icon": "DefaultProperty",
"type": "string",
"title": "If Other, please specify",
"visible": {
"jqQuery": ".form.role_context == \"Other\""
}
},
"ease_of_navigation": {
"icon": "DefaultProperty",
"title": "How easy is it to navigate the portal? (1 = Lowest, 5 = Highest)",
"type": "number",
"enum": [
1,
2,
3,
4,
5
],
"enumColors": {
"1": "lightGray",
"2": "lightGray",
"3": "lightGray",
"4": "lightGray",
"5": "lightGray"
}
},
"user_interface_design": {
"icon": "DefaultProperty",
"title": "How would you rate the overall design and layout of the portal? (1 = Lowest, 5 = Highest)",
"type": "number",
"enum": [
1,
2,
3,
4,
5
],
"enumColors": {
"1": "lightGray",
"2": "lightGray",
"3": "lightGray",
"4": "lightGray",
"5": "lightGray"
}
},
"design_improvements": {
"icon": "DefaultProperty",
"type": "string",
"title": "What design changes or improvements would you suggest?"
},
"api_catalog_rating": {
"icon": "DefaultProperty",
"title": "How satisfied are you with the API catalog? (1 = Lowest, 5 = Highest)",
"type": "number",
"enum": [
1,
2,
3,
4,
5
],
"enumColors": {
"1": "lightGray",
"2": "lightGray",
"3": "lightGray",
"4": "lightGray",
"5": "lightGray"
}
},
"monitoring_dashboards_rating": {
"icon": "DefaultProperty",
"title": "How satisfied are you with the monitoring dashboards? (1 = Lowest, 5 = Highest)",
"type": "number",
"enum": [
1,
2,
3,
4,
5
],
"enumColors": {
"1": "lightGray",
"2": "lightGray",
"3": "lightGray",
"4": "lightGray",
"5": "lightGray"
}
},
"integration_ci_cd_rating": {
"icon": "DefaultProperty",
"title": "How satisfied are you with the integration with CI/CD? (1 = Lowest, 5 = Highest)",
"type": "number",
"enum": [
1,
2,
3,
4,
5
],
"enumColors": {
"1": "lightGray",
"2": "lightGray",
"3": "lightGray",
"4": "lightGray",
"5": "lightGray"
}
},
"on_call_management_rating": {
"icon": "DefaultProperty",
"title": "How satisfied are you with the on-call management features? (1 = Lowest, 5 = Highest)",
"type": "number",
"enum": [
1,
2,
3,
4,
5
],
"enumColors": {
"1": "lightGray",
"2": "lightGray",
"3": "lightGray",
"4": "lightGray",
"5": "lightGray"
}
},
"documentation_access_rating": {
"icon": "DefaultProperty",
"title": "How satisfied are you with the documentation access? (1 = Lowest, 5 = Highest)",
"type": "number",
"enum": [
1,
2,
3,
4,
5
],
"enumColors": {
"1": "lightGray",
"2": "lightGray",
"3": "lightGray",
"4": "lightGray",
"5": "lightGray"
}
},
"feature_gaps": {
"icon": "DefaultProperty",
"type": "string",
"title": "Are there any features or functionalities that you feel are missing?"
},
"customizability_rating": {
"icon": "DefaultProperty",
"title": "How well does the portal adapt to your specific workflow or needs? (1 = Lowest, 5 = Highest))",
"type": "number",
"enum": [
1,
2,
3,
4,
5
],
"enumColors": {
"1": "lightGray",
"2": "lightGray",
"3": "lightGray",
"4": "lightGray",
"5": "lightGray"
}
},
"customization_options": {
"icon": "DefaultProperty",
"type": "string",
"title": "What additional customization options would be valuable?"
},
"workflow_integration": {
"icon": "DefaultProperty",
"title": "How seamlessly does the portal integrate with your daily development tools and processes? (1 = Lowest, 5 = Highest)",
"type": "number",
"enum": [
1,
2,
3,
4,
5
],
"enumColors": {
"1": "lightGray",
"2": "lightGray",
"3": "lightGray",
"4": "lightGray",
"5": "lightGray"
}
},
"productivity_impact": {
"icon": "DefaultProperty",
"title": "To what extent has the portal improved your overall productivity? (1 = Lowest, 5 = Highest)",
"type": "number",
"enum": [
1,
2,
3,
4,
5
],
"enumColors": {
"1": "lightGray",
"2": "lightGray",
"3": "lightGray",
"4": "lightGray",
"5": "lightGray"
}
},
"workflow_example": {
"icon": "DefaultProperty",
"type": "string",
"title": "Can you share an example where the portal significantly helped (or hindered) your workflow?"
},
"training_improvements": {
"icon": "DefaultProperty",
"type": "string",
"title": "What additional resources or improvements would help new users get up to speed faster?"
},
"documentation_quality": {
"icon": "DefaultProperty",
"title": "How would you rate the quality and clarity of the portal’s documentation? (1 = Lowest, 5 = Highest)",
"type": "number",
"enum": [
1,
2,
3,
4,
5
],
"enumColors": {
"1": "lightGray",
"2": "lightGray",
"3": "lightGray",
"4": "lightGray",
"5": "lightGray"
}
},
"documentation_improvements": {
"icon": "DefaultProperty",
"type": "string",
"title": "What changes would improve the documentation?"
},
"support_experience": {
"icon": "DefaultProperty",
"title": "When issues arise, how satisfied are you with the support provided (e.g., internal helpdesk, self-service troubleshooting)? (1 = Lowest, 5 = Highest)",
"type": "number",
"enum": [
1,
2,
3,
4,
5
],
"enumColors": {
"1": "lightGray",
"2": "lightGray",
"3": "lightGray",
"4": "lightGray",
"5": "lightGray"
}
},
"overall_satisfaction": {
"icon": "DefaultProperty",
"title": "Overall, how satisfied are you with the internal developer portal? (1 = Lowest, 5 = Highest)",
"type": "number",
"enum": [
1,
2,
3,
4,
5
],
"enumColors": {
"1": "lightGray",
"2": "lightGray",
"3": "lightGray",
"4": "lightGray",
"5": "lightGray"
}
},
"comparative_reflection": {
"icon": "DefaultProperty",
"title": "Compared to your initial expectations, how has the portal met your needs? (1 = Lowest, 5 = Highest)",
"type": "number",
"enum": [
1,
2,
3,
4,
5
],
"enumColors": {
"1": "lightGray",
"2": "lightGray",
"3": "lightGray",
"4": "lightGray",
"5": "lightGray"
}
},
"top_improvement_request": {
"icon": "DefaultProperty",
"type": "string",
"title": "What is the one change you believe would most improve the portal?"
},
"additional_feedback": {
"icon": "DefaultProperty",
"type": "string",
"title": "Do you have any other comments or suggestions regarding the internal developer portal?"
},
"devops_specific_feedback": {
"icon": "DefaultProperty",
"type": "string",
"title": "As a DevOps/SRE, what additional features or integrations would you like to see in the portal?",
"visible": {
"jqQuery": ".form.role_context == \"DevOps/SRE\""
}
},
"version": {
"icon": "DefaultProperty",
"type": "string",
"title": "Version",
"default": "Q1 2025",
"visible": false
},
"user": {
"type": "string",
"title": "User",
"blueprint": "_user",
"format": "entity",
"default": {
"jqQuery": ".user.email"
},
"visible": false
},
"self_service_rating": {
"icon": "DefaultProperty",
"title": "How satisfied are you with the Self-service capabilities of the portal? (1 = Lowest, 5 = Highest)",
"type": "number",
"enum": [
1,
2,
3,
4,
5
],
"enumColors": {
"1": "lightGray",
"2": "lightGray",
"3": "lightGray",
"4": "lightGray",
"5": "lightGray"
}
},
"onboarding_effectiveness": {
"icon": "DefaultProperty",
"title": "How effective was the training/onboarding process for the portal when you first started using it? (1 = Lowest, 5 = Highest)",
"type": "number",
"enum": [
1,
2,
3,
4,
5
],
"enumColors": {
"1": "lightGray",
"2": "lightGray",
"3": "lightGray",
"4": "lightGray",
"5": "lightGray"
}
}
},
"required": [
"version"
],
"steps": [
{
"title": "Usage & Overview",
"order": [
"frequency_of_use",
"primary_tasks",
"primary_tasks_other_specify",
"role_context",
"role_context_other_specify"
]
},
{
"title": "Usability & Navigation",
"order": [
"ease_of_navigation",
"user_interface_design",
"design_improvements"
]
},
{
"title": "Features & Functionality",
"order": [
"self_service_rating",
"api_catalog_rating",
"monitoring_dashboards_rating",
"integration_ci_cd_rating",
"on_call_management_rating",
"documentation_access_rating",
"feature_gaps",
"customizability_rating",
"customization_options"
]
},
{
"title": "Integration & Workflow",
"order": [
"workflow_integration",
"productivity_impact",
"workflow_example",
"onboarding_effectiveness",
"training_improvements"
]
},
{
"title": "Documentation & Support",
"order": [
"documentation_quality",
"documentation_improvements",
"support_experience"
]
},
{
"title": "Overall Satisfaction",
"order": [
"overall_satisfaction",
"comparative_reflection",
"top_improvement_request",
"additional_feedback"
]
},
{
"title": "Role-Specific Feedback",
"order": [
"devops_specific_feedback"
]
},
{
"title": "Final",
"order": [
"version",
"user"
]
}
]
},
"blueprintIdentifier": "survey_template"
},
"invocationMethod": {
"type": "WEBHOOK",
"url": "https://ingest.port.io/YourWebhookUrl",
"agent": false,
"synchronized": true,
"method": "POST",
"headers": {
"RUN_ID": "{{ .run.id }}"
},
"body": {
"responses": "{{ .inputs | del(.[\"user\"]) | to_entries | map( if ((.value | type) == \"array\") then (. as {key: $k, value: $vals} | $vals | map({\"key\": $k, \"value\": .})) else {\"key\": .key, \"value\": .value} end ) | flatten }}",
"port_context": {
"runId": "{{ .run.id }}",
"actionId": "{{ .action.identifier }}",
"user": "{{ .trigger.by.user.email }}",
"teams": "{{ .inputs.user.team }}",
"version": "{{ .inputs.version }}"
}
}
},
"requiredApproval": false
}
- Post on-call shift
- Post incident/outage
Survey action configuration (click to expand)
{
  "identifier": "post_oncall_shift_pulse",
  "title": "Post On-Call Shift Pulse Survey",
  "icon": "Clock",
  "trigger": {
    "type": "self-service",
    "operation": "CREATE",
    "userInputs": {
      "properties": {
        "escalation_procedures_clarity": {
          "icon": "DefaultProperty",
          "type": "number",
          "title": "How clear were the escalation procedures during your shift?",
          "enum": [
            1,
            2,
            3,
            4,
            5
          ],
          "enumColors": {
            "1": "red",
            "2": "orange",
            "3": "yellow",
            "4": "blue",
            "5": "green"
          }
        },
        "process_delays": {
          "icon": "DefaultProperty",
          "type": "string",
          "title": "Did you experience any process delays or bottlenecks?",
          "enum": [
            "Yes",
            "No"
          ]
        },
        "process_delays_comment": {
          "icon": "DefaultProperty",
          "type": "string",
          "title": "Optional: Please comment on the process delays or bottlenecks",
          "visible": {
            "jqQuery": ".form.process_delays == \"Yes\""
          }
        },
        "overwhelmed_feeling": {
          "icon": "DefaultProperty",
          "type": "number",
          "title": "How overwhelmed did you feel during the peak of your shift?",
          "enum": [
            1,
            2,
            3,
            4,
            5
          ],
          "enumColors": {
            "1": "red",
            "2": "orange",
            "3": "yellow",
            "4": "blue",
            "5": "green"
          }
        },
        "overall_stress_rating": {
          "icon": "DefaultProperty",
          "type": "number",
          "title": "Rate your overall stress level during the shift.",
          "enum": [
            1,
            2,
            3,
            4,
            5
          ],
          "enumColors": {
            "1": "red",
            "2": "orange",
            "3": "yellow",
            "4": "blue",
            "5": "green"
          }
        },
        "stress_contributor": {
          "icon": "DefaultProperty",
          "type": "string",
          "title": "What factor contributed most to your stress?",
          "visible": {
            "jqQuery": ".form.overall_stress_rating >= 4"
          }
        },
        "retrospective_experience": {
          "icon": "DefaultProperty",
          "type": "number",
          "title": "In retrospect, how did your actual experience compare to what you expected before the shift?",
          "description": "1 = Much Worse Than Expected, 5 = Much Better Than Expected",
          "enum": [
            1,
            2,
            3,
            4,
            5
          ],
          "enumColors": {
            "1": "red",
            "2": "orange",
            "3": "yellow",
            "4": "blue",
            "5": "green"
          }
        },
        "expectation_discrepancy": {
          "icon": "DefaultProperty",
          "type": "string",
          "title": "What was the biggest discrepancy between your expectations and what actually happened?"
        },
        "oncall_process_improvement": {
          "icon": "DefaultProperty",
          "type": "string",
          "title": "What one change would most improve the on-call process?"
        },
        "support_effectiveness": {
          "icon": "DefaultProperty",
          "type": "number",
          "title": "How effective was the support provided during your shift?",
          "enum": [
            1,
            2,
            3,
            4,
            5
          ],
          "enumColors": {
            "1": "red",
            "2": "orange",
            "3": "yellow",
            "4": "blue",
            "5": "green"
          }
        },
        "version": {
          "icon": "DefaultProperty",
          "type": "string",
          "title": "Version",
          "default": "Q1 2025",
          "visible": false
        },
        "user": {
          "type": "string",
          "title": "User",
          "blueprint": "_user",
          "format": "entity",
          "default": {
            "jqQuery": ".user.email"
          },
          "visible": false
        }
      },
      "required": [
        "version"
      ],
      "steps": [
        {
          "title": "During-Shift Experience",
          "order": [
            "escalation_procedures_clarity",
            "process_delays",
            "process_delays_comment",
            "overwhelmed_feeling",
            "overall_stress_rating",
            "stress_contributor"
          ]
        },
        {
          "title": "Retrospective Reflection",
          "order": [
            "retrospective_experience",
            "expectation_discrepancy"
          ]
        },
        {
          "title": "Post-Shift Improvement",
          "order": [
            "oncall_process_improvement",
            "support_effectiveness"
          ]
        },
        {
          "title": "Final",
          "order": [
            "version",
            "user"
          ]
        }
      ]
    },
    "blueprintIdentifier": "survey_template"
  },
  "invocationMethod": {
    "type": "WEBHOOK",
    "url": "https://ingest.port.io/YourWebhookUrl",
    "agent": false,
    "synchronized": true,
    "method": "POST",
    "headers": {
      "RUN_ID": "{{ .run.id }}"
    },
    "body": {
      "responses": "{{ .inputs | del(.[\"user\"]) | to_entries | map( if (.value | type) == \"array\" then (. as {key: $k, value: $vals} | $vals | map({\"key\": $k, \"value\": .})) else {\"key\": .key, \"value\": .value} end ) | flatten }}",
      "port_context": {
        "runId": "{{ .run.id }}",
        "actionId": "{{ .action.identifier }}",
        "user": "{{ .trigger.by.user.email }}",
        "teams": "{{ .inputs.user.team }}",
        "version": "{{ .inputs.version }}"
      }
    }
  },
  "requiredApproval": false
}
Survey action configuration (click to expand)
{
  "identifier": "post_incident_outage_survey",
  "title": "Post-Incident/Outage Survey",
  "icon": "Alert",
  "trigger": {
    "type": "self-service",
    "operation": "CREATE",
    "userInputs": {
      "properties": {
        "instructions_clarity": {
          "icon": "DefaultProperty",
          "type": "number",
          "title": "How clear were the instructions during the incident?",
          "enum": [
            1,
            2,
            3,
            4,
            5
          ],
          "enumColors": {
            "1": "red",
            "2": "orange",
            "3": "yellow",
            "4": "blue",
            "5": "green"
          }
        },
        "communication_effectiveness": {
          "icon": "DefaultProperty",
          "type": "number",
          "title": "How effective was the communication during the outage?",
          "enum": [
            1,
            2,
            3,
            4,
            5
          ],
          "enumColors": {
            "1": "red",
            "2": "orange",
            "3": "yellow",
            "4": "blue",
            "5": "green"
          }
        },
        "support_channels_adequate": {
          "icon": "DefaultProperty",
          "type": "string",
          "title": "Were the support channels adequate during the incident?",
          "enum": [
            "Yes",
            "No"
          ]
        },
        "support_channels_comment": {
          "icon": "DefaultProperty",
          "type": "string",
          "title": "Optional: Please elaborate on the support channels",
          "visible": {
            "jqQuery": ".form.support_channels_adequate == \"No\""
          }
        },
        "incident_stress": {
          "icon": "DefaultProperty",
          "type": "number",
          "title": "How stressful was the incident overall?",
          "enum": [
            1,
            2,
            3,
            4,
            5
          ],
          "enumColors": {
            "1": "red",
            "2": "orange",
            "3": "yellow",
            "4": "blue",
            "5": "green"
          }
        },
        "incident_response_comparison": {
          "icon": "DefaultProperty",
          "type": "number",
          "title": "In retrospect, how did the actual incident response compare to what you expected before the incident began?",
          "description": "1 = Much Worse, 5 = Much Better",
          "enum": [
            1,
            2,
            3,
            4,
            5
          ],
          "enumColors": {
            "1": "red",
            "2": "orange",
            "3": "yellow",
            "4": "blue",
            "5": "green"
          }
        },
        "biggest_gap_expectations": {
          "icon": "DefaultProperty",
          "type": "string",
          "title": "What was the biggest gap between your expectations and reality?"
        },
        "incident_response_improvement": {
          "icon": "DefaultProperty",
          "type": "string",
          "title": "What one change would you recommend to improve our incident response?"
        },
        "recovery_speed": {
          "icon": "DefaultProperty",
          "type": "number",
          "title": "How quickly did you feel you recovered post-incident?",
          "enum": [
            1,
            2,
            3,
            4,
            5
          ],
          "enumColors": {
            "1": "red",
            "2": "orange",
            "3": "yellow",
            "4": "blue",
            "5": "green"
          }
        },
        "version": {
          "icon": "DefaultProperty",
          "type": "string",
          "title": "Version",
          "default": "Q1 2025",
          "visible": false
        },
        "user": {
          "type": "string",
          "title": "User",
          "blueprint": "_user",
          "format": "entity",
          "default": {
            "jqQuery": ".user.email"
          },
          "visible": false
        }
      },
      "required": [
        "version"
      ],
      "steps": [
        {
          "title": "Incident Response Ex",
          "order": [
            "instructions_clarity",
            "communication_effectiveness",
            "support_channels_adequate",
            "support_channels_comment"
          ]
        },
        {
          "title": "Emotional Impact",
          "order": [
            "incident_stress",
            "incident_response_comparison",
            "biggest_gap_expectations"
          ]
        },
        {
          "title": "Improvement Suggestions",
          "order": [
            "incident_response_improvement",
            "recovery_speed"
          ]
        },
        {
          "title": "Final",
          "order": [
            "version",
            "user"
          ]
        }
      ]
    },
    "blueprintIdentifier": "survey_template"
  },
  "invocationMethod": {
    "type": "WEBHOOK",
    "url": "https://ingest.port.io/YourWebhookUrl",
    "agent": false,
    "synchronized": true,
    "method": "POST",
    "headers": {
      "RUN_ID": "{{ .run.id }}"
    },
    "body": {
      "responses": "{{ .inputs | del(.[\"user\"]) | to_entries | map( if (.value | type) == \"array\" then (. as {key: $k, value: $vals} | $vals | map({\"key\": $k, \"value\": .})) else {\"key\": .key, \"value\": .value} end ) | flatten }}",
      "port_context": {
        "runId": "{{ .run.id }}",
        "actionId": "{{ .action.identifier }}",
        "user": "{{ .trigger.by.user.email }}",
        "teams": "{{ .inputs.user.team }}",
        "version": "{{ .inputs.version }}"
      }
    }
  },
  "requiredApproval": false
}
- After 10 PRs milestone
- Sprint/project retro
Survey action configuration (click to expand)
{
  "identifier": "pr_milestone_survey",
  "title": "After 10th PR Milestone Survey",
  "icon": "Github",
  "trigger": {
    "type": "self-service",
    "operation": "CREATE",
    "userInputs": {
      "properties": {
        "feedback_satisfaction": {
          "icon": "DefaultProperty",
          "type": "number",
          "title": "How satisfied are you with the feedback you received during code reviews?",
          "enum": [
            1,
            2,
            3,
            4,
            5
          ],
          "enumColors": {
            "1": "red",
            "2": "orange",
            "3": "yellow",
            "4": "blue",
            "5": "green"
          }
        },
        "review_comments_helpfulness": {
          "icon": "DefaultProperty",
          "type": "number",
          "title": "How helpful were the review comments in improving your code quality?",
          "enum": [
            1,
            2,
            3,
            4,
            5
          ],
          "enumColors": {
            "1": "red",
            "2": "orange",
            "3": "yellow",
            "4": "blue",
            "5": "green"
          }
        },
        "understanding_best_practices": {
          "icon": "DefaultProperty",
          "type": "string",
          "title": "Did the review process help you understand best practices better?",
          "enum": [
            "Yes",
            "No"
          ]
        },
        "understanding_best_practices_comment": {
          "icon": "DefaultProperty",
          "type": "string",
          "title": "Optional: Please share any additional comments on the review process and best practices"
        },
        "pr_reviews_comparison": {
          "icon": "DefaultProperty",
          "type": "number",
          "title": "Thinking back, how did the experience of your recent PR reviews compare to what you expected when you started contributing?",
          "description": "1 = Much Worse, 5 = Much Better",
          "enum": [
            1,
            2,
            3,
            4,
            5
          ],
          "enumColors": {
            "1": "red",
            "2": "orange",
            "3": "yellow",
            "4": "blue",
            "5": "green"
          }
        },
        "review_process_surprise": {
          "icon": "DefaultProperty",
          "type": "string",
          "title": "What surprised you the most about the review process?"
        },
        "review_onboarding_improvement": {
          "icon": "DefaultProperty",
          "type": "string",
          "title": "What improvements would you suggest for the PR review or onboarding process?"
        },
        "coding_confidence": {
          "icon": "DefaultProperty",
          "type": "number",
          "title": "How confident do you feel about your coding and contribution process now?",
          "enum": [
            1,
            2,
            3,
            4,
            5
          ],
          "enumColors": {
            "1": "red",
            "2": "orange",
            "3": "yellow",
            "4": "blue",
            "5": "green"
          }
        },
        "version": {
          "icon": "DefaultProperty",
          "type": "string",
          "title": "Version",
          "default": "Q1 2025",
          "visible": false
        },
        "user": {
          "type": "string",
          "title": "User",
          "blueprint": "_user",
          "format": "entity",
          "default": {
            "jqQuery": ".user.email"
          },
          "visible": false
        }
      },
      "required": [
        "version"
      ],
      "steps": [
        {
          "title": "Code Review Experience",
          "order": [
            "feedback_satisfaction",
            "review_comments_helpfulness",
            "understanding_best_practices",
            "understanding_best_practices_comment"
          ]
        },
        {
          "title": "Retrospective Comparison",
          "order": [
            "pr_reviews_comparison",
            "review_process_surprise"
          ]
        },
        {
          "title": "Improvement & Onboarding",
          "order": [
            "review_onboarding_improvement",
            "coding_confidence"
          ]
        },
        {
          "title": "Final",
          "order": [
            "version",
            "user"
          ]
        }
      ]
    },
    "blueprintIdentifier": "survey_template"
  },
  "invocationMethod": {
    "type": "WEBHOOK",
    "url": "https://ingest.port.io/YourWebhookUrl",
    "agent": false,
    "synchronized": true,
    "method": "POST",
    "headers": {
      "RUN_ID": "{{ .run.id }}"
    },
    "body": {
      "responses": "{{ .inputs | del(.[\"user\"]) | to_entries | map( if (.value | type) == \"array\" then (. as {key: $k, value: $vals} | $vals | map({\"key\": $k, \"value\": .})) else {\"key\": .key, \"value\": .value} end ) | flatten }}",
      "port_context": {
        "runId": "{{ .run.id }}",
        "actionId": "{{ .action.identifier }}",
        "user": "{{ .trigger.by.user.email }}",
        "teams": "{{ .inputs.user.team }}",
        "version": "{{ .inputs.version }}"
      }
    }
  },
  "requiredApproval": false
}
Survey action configuration (click to expand)
{
  "identifier": "sprint_project_retro_survey",
  "title": "Sprint/Project Retro Survey",
  "icon": "IaC",
  "trigger": {
    "type": "self-service",
    "operation": "CREATE",
    "userInputs": {
      "properties": {
        "team_collaboration": {
          "icon": "DefaultProperty",
          "type": "number",
          "title": "How would you rate the team collaboration during this sprint/project?",
          "enum": [
            1,
            2,
            3,
            4,
            5
          ],
          "enumColors": {
            "1": "red",
            "2": "orange",
            "3": "yellow",
            "4": "blue",
            "5": "green"
          }
        },
        "process_effectiveness": {
          "icon": "DefaultProperty",
          "type": "number",
          "title": "How effective were our processes in enabling smooth execution?",
          "enum": [
            1,
            2,
            3,
            4,
            5
          ],
          "enumColors": {
            "1": "red",
            "2": "orange",
            "3": "yellow",
            "4": "blue",
            "5": "green"
          }
        },
        "bottlenecks_productivity": {
          "icon": "DefaultProperty",
          "type": "string",
          "title": "Were there any bottlenecks that impacted productivity?",
          "enum": [
            "Yes",
            "No"
          ]
        },
        "bottlenecks_comment": {
          "icon": "DefaultProperty",
          "type": "string",
          "title": "Optional: Please elaborate on the bottlenecks",
          "visible": {
            "jqQuery": ".form.bottlenecks_productivity == \"Yes\""
          }
        },
        "retrospective_outcome_rating": {
          "icon": "DefaultProperty",
          "type": "number",
          "title": "Compared to your initial expectations for this sprint/project, how did the outcome measure up?",
          "description": "1 = Much Worse, 5 = Much Better",
          "enum": [
            1,
            2,
            3,
            4,
            5
          ],
          "enumColors": {
            "1": "red",
            "2": "orange",
            "3": "yellow",
            "4": "blue",
            "5": "green"
          }
        },
        "process_difference_followup": {
          "icon": "DefaultProperty",
          "type": "string",
          "title": "What aspect of the process differed most from what you anticipated?"
        },
        "workload_balance": {
          "icon": "DefaultProperty",
          "type": "number",
          "title": "How balanced was your workload during this period?",
          "enum": [
            1,
            2,
            3,
            4,
            5
          ],
          "enumColors": {
            "1": "red",
            "2": "orange",
            "3": "yellow",
            "4": "blue",
            "5": "green"
          }
        },
        "sprint_process_improvement": {
          "icon": "DefaultProperty",
          "type": "string",
          "title": "What one change would most improve our sprint process?"
        },
        "imbalance_factor": {
          "icon": "DefaultProperty",
          "type": "string",
          "title": "What factor contributed most to the imbalance?",
          "visible": {
            "jqQuery": ".form.workload_balance <= 2"
          }
        },
        "version": {
          "icon": "DefaultProperty",
          "type": "string",
          "title": "Version",
          "default": "Q1 2025",
          "visible": false
        },
        "user": {
          "type": "string",
          "title": "User",
          "blueprint": "_user",
          "format": "entity",
          "default": {
            "jqQuery": ".user.email"
          },
          "visible": false
        }
      },
      "required": [
        "version"
      ],
      "steps": [
        {
          "title": "Sprint Execution",
          "order": [
            "team_collaboration",
            "process_effectiveness",
            "bottlenecks_productivity",
            "bottlenecks_comment"
          ]
        },
        {
          "title": "Retrospective Reflection",
          "order": [
            "retrospective_outcome_rating",
            "process_difference_followup"
          ]
        },
        {
          "title": "Improvement & Feedback",
          "order": [
            "workload_balance",
            "sprint_process_improvement",
            "imbalance_factor"
          ]
        },
        {
          "title": "Final",
          "order": [
            "version",
            "user"
          ]
        }
      ]
    },
    "blueprintIdentifier": "survey_template"
  },
  "invocationMethod": {
    "type": "WEBHOOK",
    "url": "https://ingest.port.io/YourWebhookUrl",
    "agent": false,
    "synchronized": true,
    "method": "POST",
    "headers": {
      "RUN_ID": "{{ .run.id }}"
    },
    "body": {
      "responses": "{{ .inputs | del(.[\"user\"]) | to_entries | map( if (.value | type) == \"array\" then (. as {key: $k, value: $vals} | $vals | map({\"key\": $k, \"value\": .})) else {\"key\": .key, \"value\": .value} end ) | flatten }}",
      "port_context": {
        "runId": "{{ .run.id }}",
        "actionId": "{{ .action.identifier }}",
        "user": "{{ .trigger.by.user.email }}",
        "teams": "{{ .inputs.user.team }}",
        "version": "{{ .inputs.version }}"
      }
    }
  },
  "requiredApproval": false
}
- New hire onboarding: day 1
- New hire onboarding: week 1
- New hire onboarding: month 1
- New hire onboarding: quarter 1
Survey action configuration (click to expand)
{
  "identifier": "new_hire_day1_survey",
  "title": "New Hire Onboarding: Day 1 Survey",
  "icon": "User",
  "trigger": {
    "type": "self-service",
    "operation": "CREATE",
    "userInputs": {
      "properties": {
        "pre_arrival_communication": {
          "icon": "DefaultProperty",
          "title": "How well did the pre-arrival information prepare you for your first day? (1 = Lowest, 5 = Highest)",
          "type": "number",
          "enum": [
            1,
            2,
            3,
            4,
            5
          ],
          "enumColors": {
            "1": "red",
            "2": "orange",
            "3": "yellow",
            "4": "blue",
            "5": "green"
          }
        },
        "setup_access": {
          "icon": "DefaultProperty",
          "title": "How satisfied are you with the readiness of your workstation and access to essential systems? (1 = Lowest, 5 = Highest)",
          "type": "number",
          "enum": [
            1,
            2,
            3,
            4,
            5
          ],
          "enumColors": {
            "1": "red",
            "2": "orange",
            "3": "yellow",
            "4": "blue",
            "5": "green"
          }
        },
        "role_clarity": {
          "icon": "DefaultProperty",
          "title": "How clear were your role and responsibilities on your first day? (1 = Lowest, 5 = Highest)",
          "type": "number",
          "enum": [
            1,
            2,
            3,
            4,
            5
          ],
          "enumColors": {
            "1": "red",
            "2": "orange",
            "3": "yellow",
            "4": "blue",
            "5": "green"
          }
        },
        "welcoming_experience": {
          "icon": "DefaultProperty",
          "title": "How welcomed did you feel by your colleagues on your first day? (1 = Lowest, 5 = Highest)",
          "type": "number",
          "enum": [
            1,
            2,
            3,
            4,
            5
          ],
          "enumColors": {
            "1": "red",
            "2": "orange",
            "3": "yellow",
            "4": "blue",
            "5": "green"
          }
        },
        "overall_experience": {
          "icon": "DefaultProperty",
          "title": "Overall, how satisfied are you with your first day? (1 = Lowest, 5 = Highest)",
          "type": "number",
          "enum": [
            1,
            2,
            3,
            4,
            5
          ],
          "enumColors": {
            "1": "red",
            "2": "orange",
            "3": "yellow",
            "4": "blue",
            "5": "green"
          }
        },
        "version": {
          "icon": "DefaultProperty",
          "type": "string",
          "title": "Version",
          "default": "Q1 2025",
          "visible": false
        },
        "user": {
          "type": "string",
          "title": "User",
          "blueprint": "_user",
          "format": "entity",
          "default": {
            "jqQuery": ".user.email"
          },
          "visible": false
        }
      },
      "required": [
        "version"
      ],
      "steps": [
        {
          "title": "First Day Experience",
          "order": [
            "pre_arrival_communication",
            "setup_access",
            "role_clarity",
            "welcoming_experience",
            "overall_experience"
          ]
        },
        {
          "title": "Final",
          "order": [
            "version",
            "user"
          ]
        }
      ]
    },
    "blueprintIdentifier": "survey_template"
  },
  "invocationMethod": {
    "type": "WEBHOOK",
    "url": "https://ingest.port.io/YourWebhookUrl",
    "agent": false,
    "synchronized": true,
    "method": "POST",
    "headers": {
      "RUN_ID": "{{ .run.id }}"
    },
    "body": {
      "responses": "{{ .inputs | del(.[\"user\"]) | to_entries | map( if ((.value | type) == \"array\") then (. as {key: $k, value: $vals} | $vals | map({\"key\": $k, \"value\": .})) else {\"key\": .key, \"value\": .value} end ) | flatten }}",
      "port_context": {
        "runId": "{{ .run.id }}",
        "actionId": "{{ .action.identifier }}",
        "user": "{{ .trigger.by.user.email }}",
        "teams": "{{ .inputs.user.team }}",
        "version": "{{ .inputs.version }}"
      }
    }
  },
  "requiredApproval": false
}
Survey action configuration (click to expand)
{
  "identifier": "new_hire_week1_survey",
  "title": "New Hire Onboarding: Week 1 Survey",
  "icon": "User",
  "trigger": {
    "type": "self-service",
    "operation": "CREATE",
    "userInputs": {
      "properties": {
        "role_description_clarity": {
          "icon": "DefaultProperty",
          "type": "number",
          "title": "How clear was your role description during your first week?",
          "enum": [
            1,
            2,
            3,
            4,
            5
          ]
        },
        "initial_training_effectiveness": {
          "icon": "DefaultProperty",
          "type": "number",
          "title": "How well did the initial training meet your needs?",
          "enum": [
            1,
            2,
            3,
            4,
            5
          ]
        },
        "first_week_reflection": {
          "icon": "DefaultProperty",
          "type": "number",
          "title": "Compared to what you anticipated, how did your first week measure up?",
          "enum": [
            1,
            2,
            3,
            4,
            5
          ]
        },
        "version": {
          "icon": "DefaultProperty",
          "type": "string",
          "title": "Version",
          "default": "Q1 2025",
          "visible": false
        },
        "user": {
          "type": "string",
          "title": "User",
          "blueprint": "_user",
          "format": "entity",
          "default": {
            "jqQuery": ".user.email"
          },
          "visible": false
        }
      },
      "required": [
        "version"
      ],
      "steps": [
        {
          "title": "Early Experience",
          "order": [
            "role_description_clarity",
            "initial_training_effectiveness",
            "first_week_reflection"
          ]
        },
        {
          "title": "Final",
          "order": [
            "version",
            "user"
          ]
        }
      ]
    },
    "blueprintIdentifier": "survey_template"
  },
  "invocationMethod": {
    "type": "WEBHOOK",
    "url": "https://ingest.port.io/YourWebhookUrl",
    "agent": false,
    "synchronized": true,
    "method": "POST",
    "headers": {
      "RUN_ID": "{{ .run.id }}"
    },
    "body": {
      "responses": "{{ .inputs | del(.[\"user\"]) | to_entries | map( if (.value | type) == \"array\" then (. as {key: $k, value: $vals} | $vals | map({\"key\": $k, \"value\": .})) else {\"key\": .key, \"value\": .value} end ) | flatten }}",
      "port_context": {
        "runId": "{{ .run.id }}",
        "actionId": "{{ .action.identifier }}",
        "user": "{{ .trigger.by.user.email }}",
        "teams": "{{ .inputs.user.team }}",
        "version": "{{ .inputs.version }}"
      }
    }
  },
  "requiredApproval": false
}
Survey action configuration (click to expand)
{
  "identifier": "new_hire_month1_survey",
  "title": "New Hire Onboarding: Month 1 Survey",
  "icon": "User",
  "trigger": {
    "type": "self-service",
    "operation": "CREATE",
    "userInputs": {
      "properties": {
        "task_confidence": {
          "icon": "DefaultProperty",
          "type": "number",
          "title": "How confident are you in performing your tasks after the first month?",
          "enum": [
            1,
            2,
            3,
            4,
            5
          ]
        },
        "ongoing_support_effectiveness": {
          "icon": "DefaultProperty",
          "type": "number",
          "title": "How effective was the ongoing support from your team?",
          "enum": [
            1,
            2,
            3,
            4,
            5
          ]
        },
        "onboarding_improvement": {
          "icon": "DefaultProperty",
          "type": "string",
          "title": "What’s one area of the onboarding process you’d improve?"
        },
        "additional_comments": {
          "icon": "DefaultProperty",
          "type": "string",
          "title": "Any additional comments or further information you'd like to share?"
        },
        "version": {
          "icon": "DefaultProperty",
          "type": "string",
          "title": "Version",
          "default": "Q1 2025",
          "visible": false
        },
        "user": {
          "type": "string",
          "title": "User",
          "blueprint": "_user",
          "format": "entity",
          "default": {
            "jqQuery": ".user.email"
          },
          "visible": false
        }
      },
      "required": [
        "version"
      ],
      "steps": [
        {
          "title": "Skill Assessment",
          "order": [
            "task_confidence",
            "ongoing_support_effectiveness",
            "onboarding_improvement",
            "additional_comments"
          ]
        },
        {
          "title": "Final",
          "order": [
            "version",
            "user"
          ]
        }
      ]
    },
    "blueprintIdentifier": "survey_template"
  },
  "invocationMethod": {
    "type": "WEBHOOK",
    "url": "https://ingest.port.io/YourWebhookUrl",
    "agent": false,
    "synchronized": true,
    "method": "POST",
    "headers": {
      "RUN_ID": "{{ .run.id }}"
    },
    "body": {
      "responses": "{{ .inputs | del(.[\"user\"]) | to_entries | map( if ((.value | type) == \"array\") then (. as {key: $k, value: $vals} | $vals | map({\"key\": $k, \"value\": .})) else {\"key\": .key, \"value\": .value} end ) | flatten }}",
      "port_context": {
        "runId": "{{ .run.id }}",
        "actionId": "{{ .action.identifier }}",
        "user": "{{ .trigger.by.user.email }}",
        "teams": "{{ .inputs.user.team }}",
        "version": "{{ .inputs.version }}"
      }
    }
  },
  "requiredApproval": false
}
Survey action configuration (click to expand)
{
  "identifier": "new_hire_quarter1_survey",
  "title": "New Hire Onboarding: Quarter 1 Survey",
  "icon": "User",
  "trigger": {
    "type": "self-service",
    "operation": "CREATE",
    "userInputs": {
      "properties": {
        "cultural_integration": {
          "icon": "DefaultProperty",
          "type": "number",
          "title": "How well do you feel integrated into the company culture now?",
          "enum": [
            1,
            2,
            3,
            4,
            5
          ]
        },
        "role_alignment": {
          "icon": "DefaultProperty",
          "type": "number",
          "title": "How aligned is your current role with your initial expectations?",
          "enum": [
            1,
            2,
            3,
            4,
            5
          ]
        },
        "onboarding_retrospective": {
          "icon": "DefaultProperty",
          "type": "number",
          "title": "Reflecting on your entire onboarding journey, how did your experience compare with your initial expectations?",
          "enum": [
            1,
            2,
            3,
            4,
            5
          ]
        },
        "additional_support": {
          "icon": "DefaultProperty",
          "type": "string",
          "title": "What additional support would have helped your transition?"
        },
        "additional_comments": {
          "icon": "DefaultProperty",
          "type": "string",
          "title": "Any additional comments or further information you'd like to share?"
        },
        "version": {
          "icon": "DefaultProperty",
          "type": "string",
          "title": "Version",
          "default": "Q1 2025",
          "visible": false
        },
        "user": {
          "type": "string",
          "title": "User",
          "blueprint": "_user",
          "format": "entity",
          "default": {
            "jqQuery": ".user.email"
          },
          "visible": false
        }
      },
      "required": [
        "version"
      ],
      "steps": [
        {
          "title": "Long-Term Alignment",
          "order": [
            "cultural_integration",
            "role_alignment",
            "onboarding_retrospective",
            "additional_support",
            "additional_comments"
          ]
        },
        {
          "title": "Final",
          "order": [
            "version",
            "user"
          ]
        }
      ]
    },
    "blueprintIdentifier": "survey_template"
  },
  "invocationMethod": {
    "type": "WEBHOOK",
    "url": "https://ingest.port.io/YourWebhookUrl",
    "agent": false,
    "synchronized": true,
    "method": "POST",
    "headers": {
      "RUN_ID": "{{ .run.id }}"
    },
    "body": {
      "responses": "{{ .inputs | del(.[\"user\"]) | to_entries | map( if ((.value | type) == \"array\") then (. as {key: $k, value: $vals} | $vals | map({\"key\": $k, \"value\": .})) else {\"key\": .key, \"value\": .value} end ) | flatten }}",
      "port_context": {
        "runId": "{{ .run.id }}",
        "actionId": "{{ .action.identifier }}",
        "user": "{{ .trigger.by.user.email }}",
        "teams": "{{ .inputs.user.team }}",
        "version": "{{ .inputs.version }}"
      }
    }
  },
  "requiredApproval": false
}
- Toolchain or error encounter
Survey action configuration (click to expand)
{
  "identifier": "toolchain_error_encounter_survey",
  "title": "Toolchain or Error Encounter Survey",
  "icon": "Bug",
  "trigger": {
    "type": "self-service",
    "operation": "CREATE",
    "userInputs": {
      "properties": {
        "error_clarity": {
          "icon": "DefaultProperty",
          "type": "number",
          "title": "How understandable was the error message you encountered?",
          "enum": [
            1,
            2,
            3,
            4,
            5
          ],
          "enumColors": {
            "1": "red",
            "2": "orange",
            "3": "yellow",
            "4": "blue",
            "5": "green"
          }
        },
        "documentation_help": {
          "icon": "DefaultProperty",
          "type": "string",
          "title": "Did you find the available documentation helpful in resolving the error?",
          "enum": [
            "Yes",
            "No"
          ]
        },
        "documentation_help_comment": {
          "icon": "DefaultProperty",
          "type": "string",
          "title": "Optional: Please share any additional comments on the documentation",
          "visible": {
            "jqQuery": ".form.documentation_help == \"No\""
          }
        },
        "error_experience_reflection": {
          "icon": "DefaultProperty",
          "type": "number",
          "title": "Reflecting on previous encounters, how has your experience with similar errors compared to your expectations?",
          "description": "1 = Much Worse, 5 = Much Better",
          "enum": [
            1,
            2,
            3,
            4,
            5
          ],
          "enumColors": {
            "1": "red",
            "2": "orange",
            "3": "yellow",
            "4": "blue",
            "5": "green"
          }
        },
        "error_message_actionable_change": {
          "icon": "DefaultProperty",
          "type": "string",
          "title": "What change would make these error messages more actionable?"
        },
        "toolchain_error_improvement": {
          "icon": "DefaultProperty",
          "type": "string",
          "title": "What one improvement would you suggest for our toolchain error messages?"
        },
        "version": {
          "icon": "DefaultProperty",
          "type": "string",
          "title": "Version",
          "default": "Q1 2025",
          "visible": false
        },
        "user": {
          "type": "string",
          "title": "User",
          "blueprint": "_user",
          "format": "entity",
          "default": {
            "jqQuery": ".user.email"
          },
          "visible": false
        }
      },
      "required": [
        "version"
      ],
      "steps": [
        {
          "title": "Error Encounter Exp",
          "order": [
            "error_clarity",
            "documentation_help",
            "documentation_help_comment"
          ]
        },
        {
          "title": "Retrospective Reflection",
          "order": [
            "error_experience_reflection",
            "error_message_actionable_change"
          ]
        },
        {
          "title": "Improvement Feedback",
          "order": [
            "toolchain_error_improvement"
          ]
        },
        {
          "title": "Final",
          "order": [
            "version",
            "user"
          ]
        }
      ]
    },
    "blueprintIdentifier": "survey_template"
  },
  "invocationMethod": {
    "type": "WEBHOOK",
    "url": "https://ingest.port.io/YourWebhookUrl",
    "agent": false,
    "synchronized": true,
    "method": "POST",
    "headers": {
      "RUN_ID": "{{ .run.id }}"
    },
    "body": {
      "responses": "{{ .inputs | del(.[\"user\"]) | to_entries | map( if (.value | type) == \"array\" then (. as {key: $k, value: $vals} | $vals | map({\"key\": $k, \"value\": .})) else {\"key\": .key, \"value\": .value} end ) | flatten }}",
      "port_context": {
        "runId": "{{ .run.id }}",
        "actionId": "{{ .action.identifier }}",
        "user": "{{ .trigger.by.user.email }}",
        "teams": "{{ .inputs.user.team }}",
        "version": "{{ .inputs.version }}"
      }
    }
  },
  "requiredApproval": false
}
It's important to define userInputs.properties.version and userInputs.properties.user as hidden inputs (see visible: false) in the form for versioning and tracking purposes.
Create a dashboard
Let's create a dashboard, where we will visualize survey data:
-
Go to your software catalog.
-
Click on the
+button in the left sidebar. -
Select
New dashboard. -
Name it "Survey Analytics".
-
Click
Create.
Add the following widgets to track survey metrics:
Action history widget (click to expand)
-
Click
+ Widgetand selectAction History. -
Click on the "Survey Response" self-service action we just created.
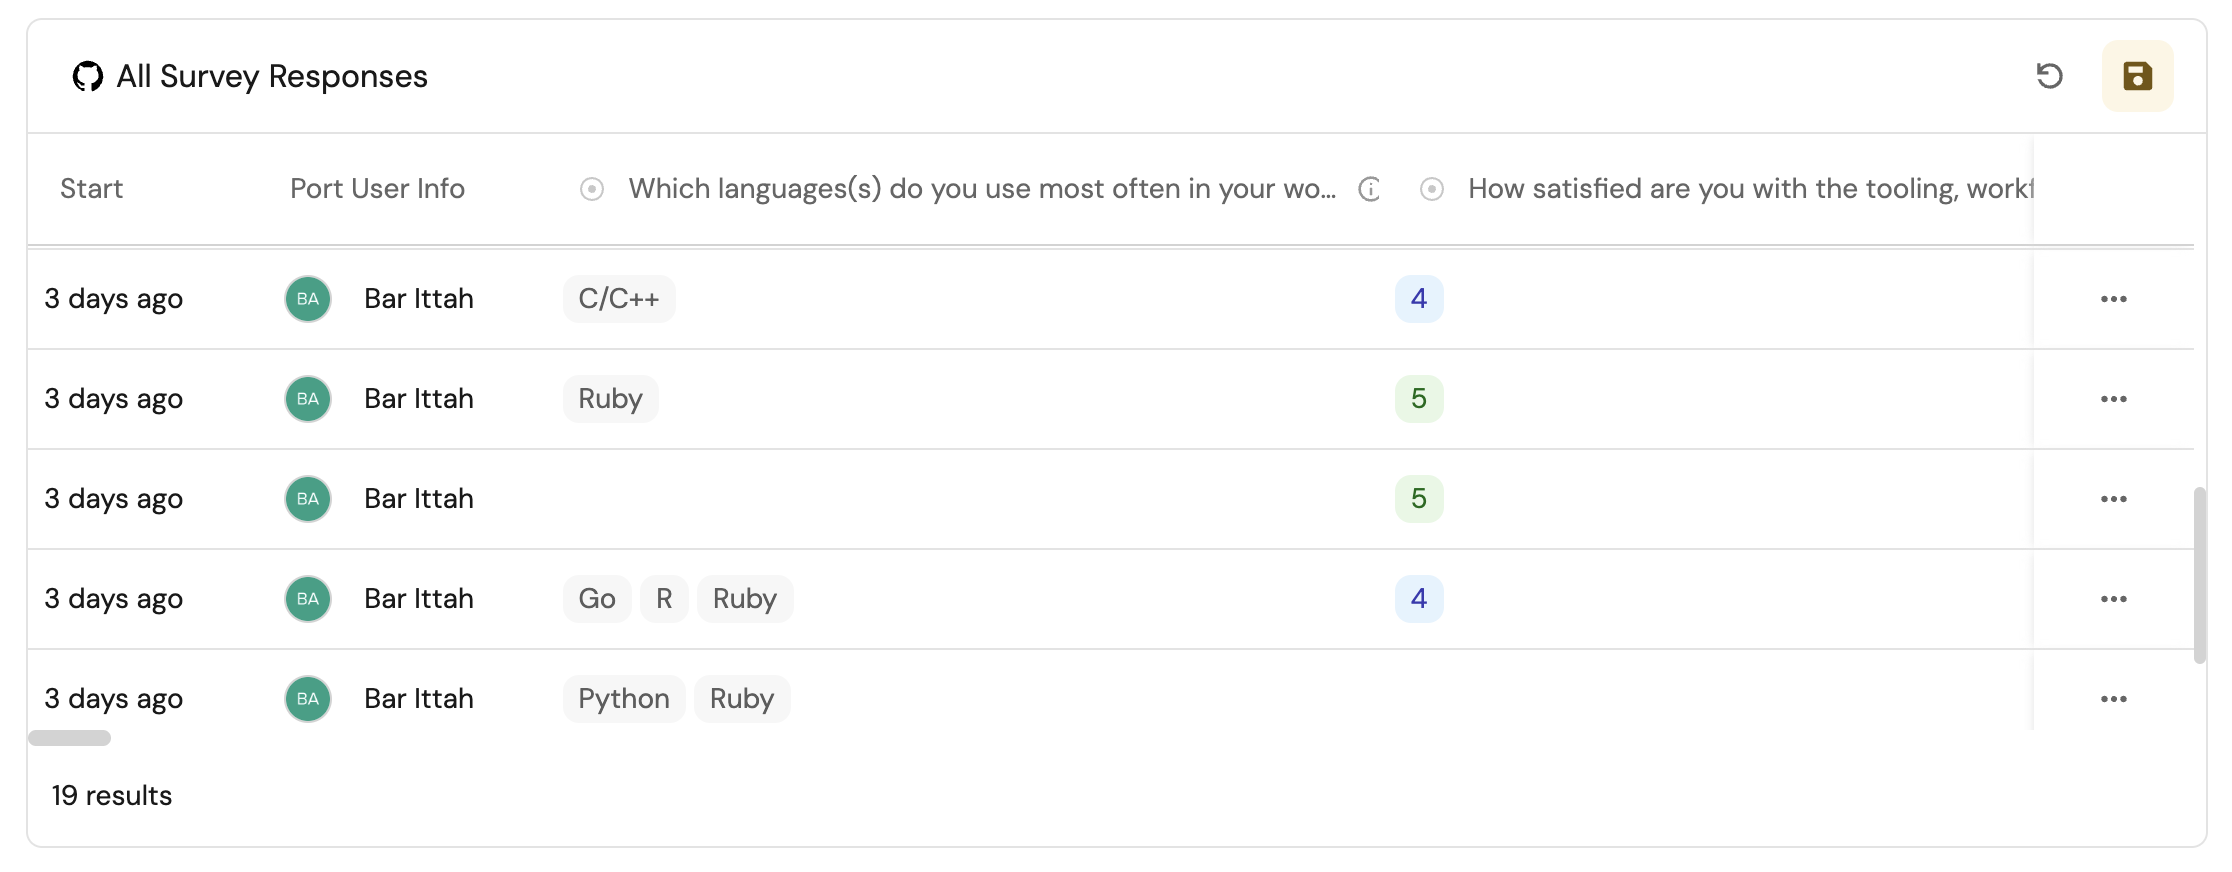
Average score widget (click to expand)
-
Click
+ Widgetand selectNumber Chart. -
Configure the widget as follows:
- Title: "{selected question} Avg. Score".
- Chart Type: Display single property.
- Blueprint: Question (can be omitted if configuring on the question entity page).
- Entity: The specific question you want to track (can be omitted if configuring on the question entity page).
- Property: Avg. Score.
This widget displays the average score calculated from all responses for the chosen question.
You can swap question for question_template if you want to see the distribution of answers from all versions of the survey.
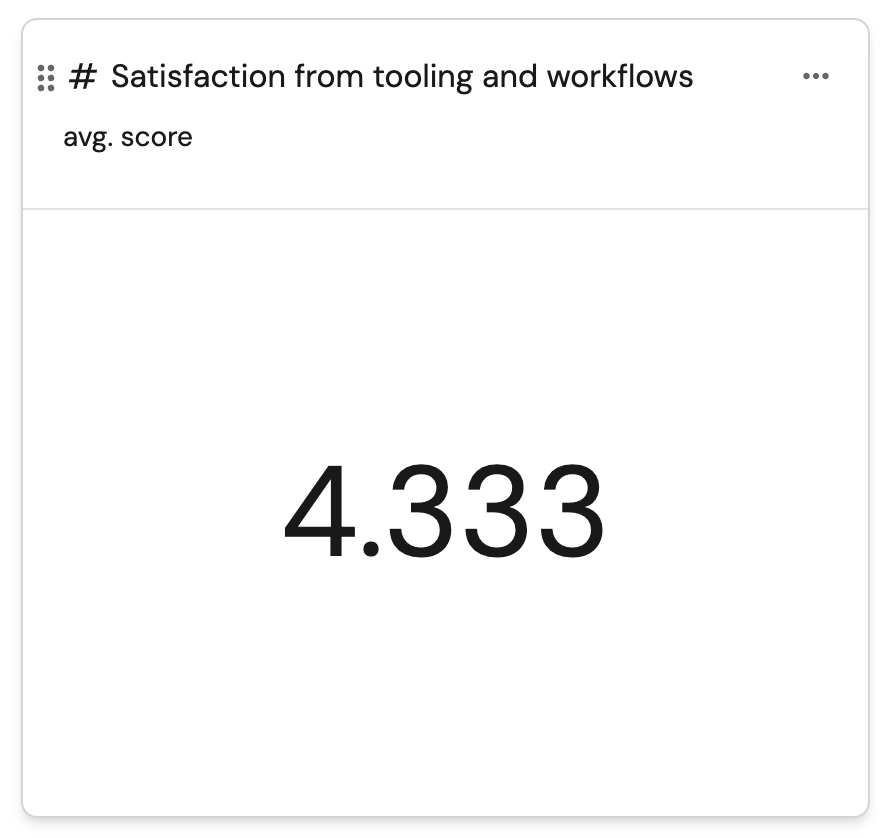
Response distribution widget (click to expand)
-
Click
+ Widgetand selectPie chart. -
Configure the widget as follows:
- Title: "{selected question} distribution".
- Blueprint: Response.
- Breakdown by property: Answer.
- Additional filters:
{"combinator": "and","rules": [{"operator": "relatedTo","blueprint": "question","value": "{question_identifier}"},{"operator": "=","value": "response","property": "$blueprint"}]}
This widget shows the distribution of answers across all responses for the selected question.
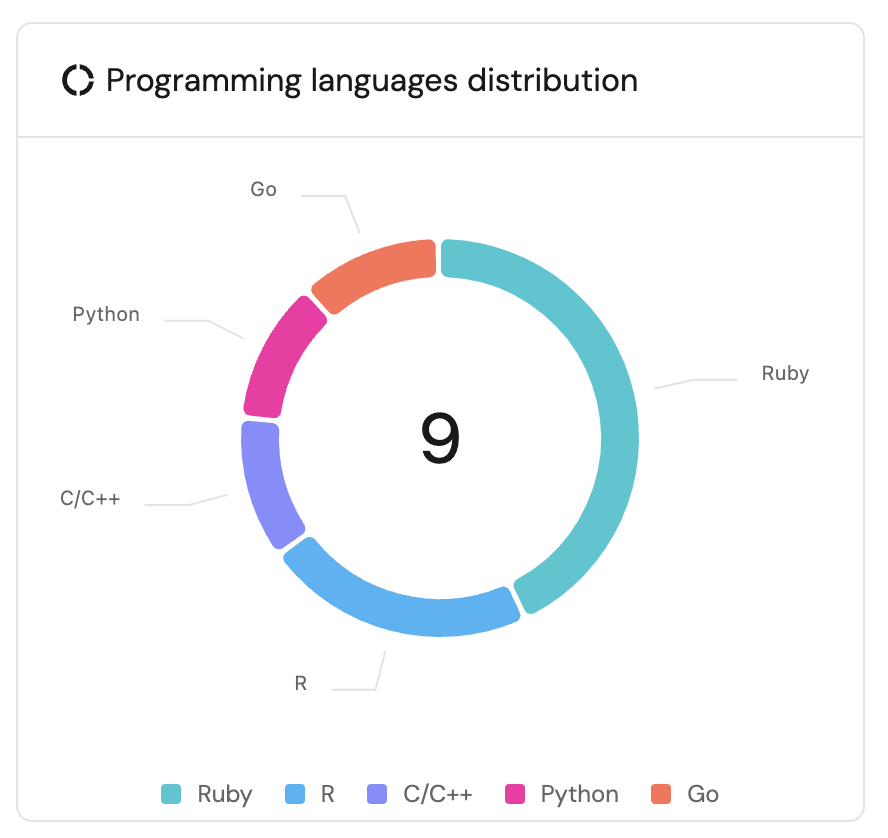
Response timeline visualization (click to expand)
-
Click
+ Widgetand select Line Chart. -
Title:
Response Timeline. -
Set X axis:
- Time interval: Set to your desired value.
- Time range: Set to your desired value.
-
Click
+ Lineand configure:- Title:
{specific_question} over time. - Chart type:
Aggregate by property. - Blueprint:
Question(can be omitted if configuring on the question entity page). - Entity:
{specific_question}(can be omitted if configuring on the question entity page). - Property:
Avg Score. - Function:
Average.
- Title:
-
Click
Save.
This widget shows the average score for the selected question over time.