Create Survey Intelligence
Survey Intelligence is a suite of three custom Port plugins (Survey Builder, Survey Forms, and Survey Analytics) for running engineering surveys and turning the responses into insights. This guide walks you through the setup and configuration process, so the experience works end to end in your Port platform.
Quantitative metrics (like PR Cycle Time) tell you what is happening, but not why, and the why can be hard to pin down from the numbers alone. Qualitative feedback from engineers captures the context behind the numbers: where they feel blocked, which tools actually help, and what slows them down day to day. Capturing both, the trend and the story behind it, lets you act on causes rather than symptoms, and confirm whether a change actually improved how engineers work.
By the end, we will have the blueprints, automations, permissions, and widgets in place to author surveys, distribute them to teams, collect responses, and view analytics.
Survey Intelligence is built from three custom plugins, a Port feature for embedding your own React-based widgets. The source is maintained in the port-experimental/port-plugins repository, see the repository for the code and its disclaimer.
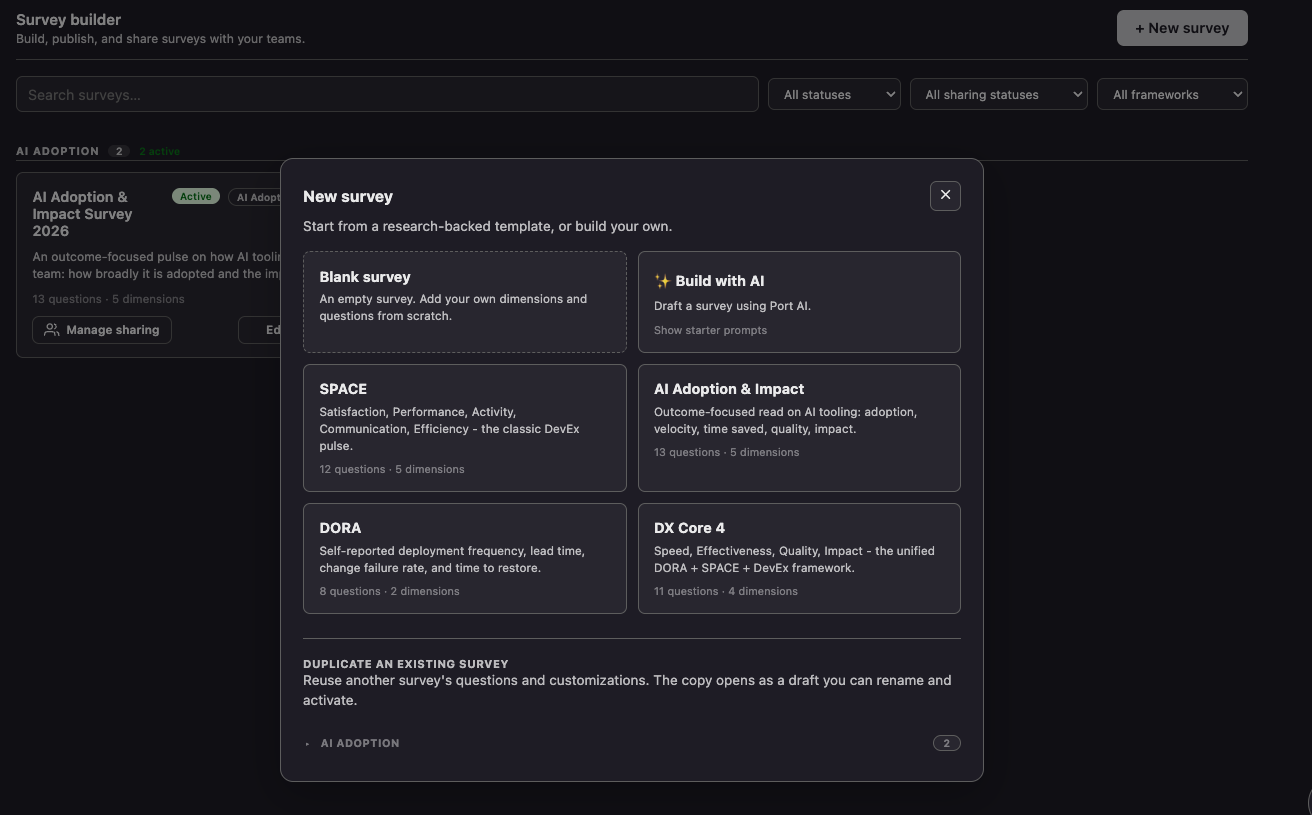
Survey Builder: creating a new survey. Screenshots are illustrative and do not reflect full dashboard layout.
Overview
The solution is made of three plugins that share a common data model:
- Survey Builder: author, publish, and share surveys with your teams.
- Survey Forms: the respondent-facing form where engineers fill out a survey shared with their team.
- Survey Analytics: scores, trends, participation, and benchmark comparison.
Common use cases
- Run a recurring DORA, SPACE, DX Core 4, or AI Adoption pulse and track results over time.
- Create a custom framework with your own dimensions and questions, then track its results in Survey Analytics like any built-in one.
- Generate a survey with AI, grounded in your existing environment (for example an AI agent that inspects your catalog, scorecards, and recent incidents), then refine and publish it in Survey Builder.
- Distribute a survey to all teams and follow response rates per team.
- Compare a survey against a previous one, or against the industry benchmarks.
- Send reminders to respondents (for example, a Slack notification driven by a workflow).
What each plugin offers
Survey Builder
- Author surveys from built-in frameworks (SPACE, DORA, DX Core 4, AI Adoption) or a custom framework.
- Draft a survey with AI from a single prompt, targeting the bottlenecks and inefficiencies you want to uncover.
- Edit dimensions, questions, and the rating scale, with a live respondent preview.
- Publish, then share with all teams, with an optional deadline.
- Search and filter the survey list by status, sharing, and framework.
Survey Forms
- Lists only the active surveys shared with the respondent's team.
- A guided form grouped by dimension, with a progress bar and required-field validation.
- Anonymous or attributed responses.
- Scores each submission (the response is anonymous when the survey has anonymity enabled).
Survey Analytics
- Per-team and overall scores, a team-by-dimension heatmap, and trends over time.
- Participation and response rates per team.
- A question-level breakdown and a per-response log.
- A breakdown of multi-select questions, showing which options respondents picked.
- Compare with a specific previous survey of the same framework, side by side (including percentage-point changes for multi-select options).
- A Benchmark tab comparing supported frameworks against an industry reference.
How it works
The plugins move a survey through its lifecycle, with each stage living in one widget. The Writes to column names which of the three Step 1 blueprints (survey, surveyCampaign, or surveyResponse) that stage writes to.
Build → Publish → Share → Respond → Close → Analyze
As it moves through these stages, the survey itself goes through three statuses: Draft when you build it, Active once you publish it, and Closed when you finish the cycle.
| Stage | Where | What happens | Writes to |
|---|---|---|---|
| Build | Survey Builder | Author a survey from a built-in framework (or a custom one) and save it as a draft. | survey blueprint |
| Publish | Survey Builder | Publish the survey so it becomes eligible for distribution. | survey blueprint |
| Share | Survey Builder | Share with all teams and set an optional deadline. | surveyCampaign blueprint |
| Respond | Survey Forms | Engineers fill in the active surveys shared with their team and submit. | surveyResponse blueprint |
| Close | Survey Builder | Close the survey when the cycle ends so it stops collecting responses (reopen anytime). | survey blueprint |
| Analyze | Survey Analytics | Review scores, trends, participation, and the benchmark comparison. You can view results at any time, including while the survey is still active, so you do not have to close it first. | reads all blueprints |
Prerequisites
- Admin permissions in your Port organization (you will create blueprints and add dashboard widgets).
- The three plugins uploaded to your organization:
survey-builder-port-plugin,survey-forms-port-plugin, andsurvey-analytics-port-plugin. See Upload the plugins below. - The native team and user blueprints, which Port provides by default. The respondent experience and reminder targeting rely on each user's team membership.
Upload the plugins
The plugin source lives in the port-experimental/port-plugins repository. Clone it, then build and upload each plugin with the Port plugins CLI. Run the upload from each plugin's directory, after building it:
# Build the plugin (produces dist/index.html)
npm run build

# Upload (or update) the plugin in your organization
npx @port-labs/port-plugins-cli upload --upsert \
  --identifier survey-builder-port-plugin \
  --title "Survey Builder" \
  --file dist/index.html \
  --params "$(cat upload-params.json)"
Repeat for all three plugins, using these identifiers and directory names:
| Plugin | Directory | Identifier | Title |
|---|---|---|---|
| Survey Builder | engineering-intelligence-survey-builder | survey-builder-port-plugin | Survey Builder |
| Survey Forms | engineering-intelligence-survey-forms | survey-forms-port-plugin | Survey Forms |
| Survey Analytics | engineering-intelligence-survey-analytics | survey-analytics-port-plugin | Survey Analytics |
After uploading, verify each plugin exists with npx @port-labs/port-plugins-cli list, or open the Plugins Manager in your portal (Builder in the top bar, then Plugins Manager in the left sidebar) to see every plugin uploaded to your organization.
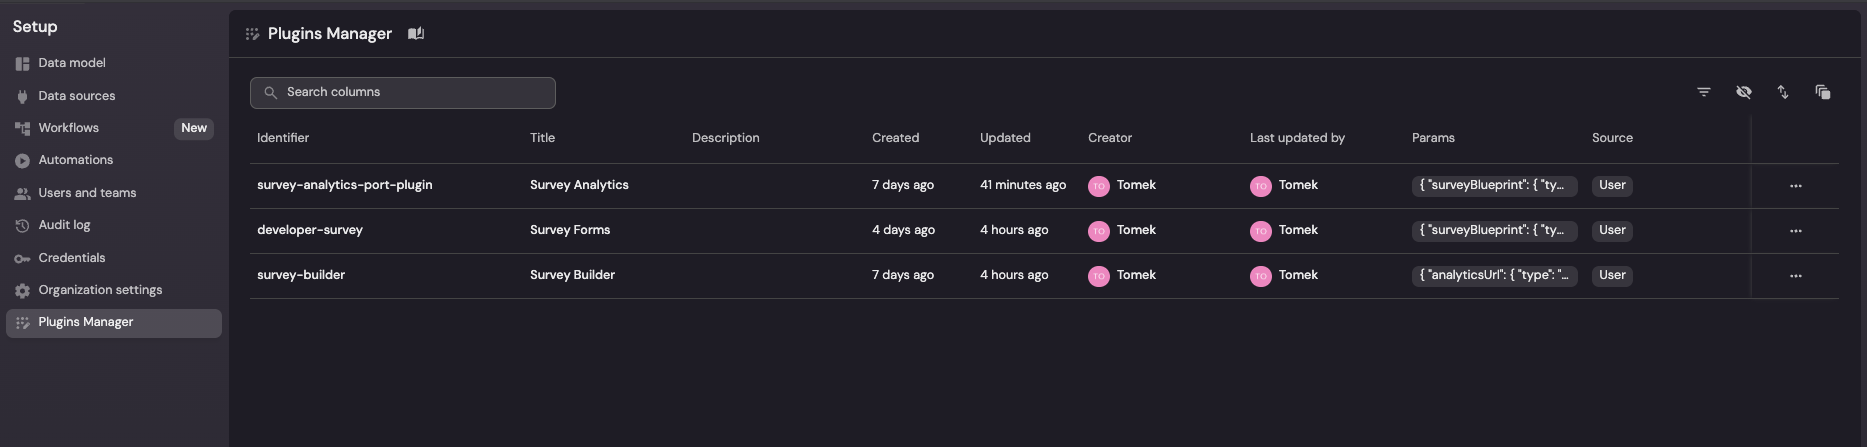
The Plugins Manager, listing the three uploaded plugins.
Step 1: Create the blueprints
The plugins read and write three blueprints. Create them in the order below, because each one relates to the blueprint above it.
To create a blueprint:
- Go to the Builder page of your portal.
- Click
+ Blueprint, then{...} Edit JSON. - Paste the JSON for the blueprint, then click
Create.
Survey blueprint
Holds each survey definition. The Survey Builder writes it; the Survey Forms and Survey Analytics plugins read it.
Survey blueprint (click to expand)
{
  "identifier": "survey",
  "title": "Survey",
  "icon": "Star",
  "ownership": { "type": "Direct" },
  "schema": {
    "properties": {
      "framework": {
        "type": "string",
        "title": "Framework",
        "description": "Survey framework. Selects the built-in template used when no inline definition is provided.",
        "enum": ["SPACE", "AI Adoption", "DORA", "DX Core 4", "custom"],
        "default": "SPACE",
        "enumColors": {
          "SPACE": "blue",
          "AI Adoption": "green",
          "DORA": "purple",
          "DX Core 4": "turquoise",
          "custom": "lightGray"
        }
      },
      "status": {
        "type": "string",
        "title": "Status",
        "description": "Only active surveys appear to respondents.",
        "enum": ["draft", "active", "closed"],
        "default": "active",
        "enumColors": { "draft": "lightGray", "active": "green", "closed": "red" }
      },
      "cadence": {
        "type": "string",
        "title": "Cadence",
        "enum": ["one-off", "monthly", "quarterly"],
        "default": "quarterly"
      },
      "description": {
        "type": "string",
        "title": "Description",
        "format": "markdown"
      },
      "definition": {
        "type": "object",
        "title": "Definition",
        "description": "Full survey definition (dimensions, questions, scale). When set, overrides the built-in template."
      },
      "targetRespondents": {
        "type": "object",
        "title": "Target Respondents",
        "description": "Eligible respondents per team, e.g. {\"platform\": 8}. Drives response rate. Falls back to Port team size when absent."
      },
      "publishedAt": {
        "type": "string",
        "title": "Published At",
        "format": "date-time",
        "description": "When the survey was first set to active (published)."
      }
    },
    "required": []
  },
  "relations": {}
}
Survey response blueprint
Stores one submission per respondent. The Survey Forms plugin writes it; Survey Analytics reads it. It relates to survey, so create survey first.
This blueprint uses Direct ownership: when a response is created, the plugin sets the respondent's team as Port's native owning team. That is how every chart in Survey Analytics is broken down per team, so keep the ownership setting in the JSON below.
Survey response blueprint (click to expand)
{
  "identifier": "surveyResponse",
  "title": "Survey Response",
  "icon": "Book",
  "ownership": { "type": "Direct" },
  "schema": {
    "properties": {
      "respondent": {
        "type": "string",
        "title": "Respondent",
        "description": "Email of the respondent, or 'anonymous'."
      },
      "submittedAt": { "type": "string", "format": "date-time", "title": "Submitted At" },
      "answers": {
        "type": "object",
        "title": "Answers",
        "description": "Raw answers keyed by question id."
      },
      "dimensionScores": {
        "type": "object",
        "title": "Dimension Scores",
        "description": "Per-dimension normalized score (0-100)."
      },
      "overallScore": {
        "type": "number",
        "title": "Overall Score",
        "description": "Mean of dimension scores (0-100)."
      }
    },
    "required": []
  },
  "relations": {
    "survey": { "title": "Survey", "target": "survey", "required": true, "many": false }
  }
}
Survey campaign blueprint
Records a point-in-time distribution of a survey to an audience, plus reminder metadata. The Survey Builder writes it when you share a survey, and the Survey Forms plugin reads it to decide which surveys to show each respondent. It relates to survey and the native team blueprint.
Survey campaign blueprint (click to expand)
{
  "identifier": "surveyCampaign",
  "title": "Survey Campaign",
  "icon": "Star",
  "schema": {
    "properties": {
      "audience": {
        "type": "string",
        "title": "Audience",
        "description": "Who the survey was shared with.",
        "enum": ["teams", "all"],
        "enumColors": { "teams": "blue", "all": "green" }
      },
      "status": {
        "type": "string",
        "title": "Status",
        "enum": ["active", "closed"],
        "default": "active",
        "enumColors": { "active": "green", "closed": "red" }
      },
      "deadline": {
        "type": "string",
        "title": "Deadline",
        "format": "date-time",
        "description": "After this date the campaign closes and nudging stops."
      },
      "reminderCadence": {
        "type": "string",
        "title": "Reminder Cadence",
        "description": "How often the campaign is nudged.",
        "enum": ["off", "daily", "every-3-days", "weekly"],
        "default": "every-3-days"
      },
      "channel": {
        "type": "string",
        "title": "Reminder Channel",
        "enum": ["slack", "email"],
        "default": "slack"
      },
      "nextNudgeAt": {
        "type": "string",
        "title": "Next Nudge At",
        "format": "timer",
        "description": "Timer property. When it expires the nudge automation fires and reschedules it by the cadence."
      },
      "reminderCount": { "type": "number", "title": "Reminders Sent", "default": 0 },
      "lastNudgedAt": { "type": "string", "title": "Last Nudged At", "format": "date-time" }
    },
    "required": []
  },
  "relations": {
    "survey": { "title": "Survey", "target": "survey", "required": false, "many": false },
    "teams": { "title": "Teams", "target": "_team", "required": false, "many": true }
  }
}
At this stage, targeting specific teams and scheduling automatic reminders are not supported based on this guide. Additional capabilities can be expanded if needed.
After this step you should have survey, surveyResponse, and surveyCampaign in your data model. The plugins will not be able to read or write data until these exist.
Step 2: Set up reminders (optional)
This step adds reminders that prompt people to complete a shared survey. Skip it if you only need to build, distribute, and analyze surveys.
A reminder posts a message to a defined Slack channel. The Send reminder button in Survey Builder triggers the "Send survey reminder" workflow, which must have the identifier survey-nudge-now (the plugin calls POST /v1/workflows/survey-nudge-now/runs). The workflow calls Slack's chat.postMessage API and posts the survey title, your message, the question count and deadline, and a "Take Survey" button into that channel.
Responses can be anonymous, so the system cannot tell who has and has not responded. The reminder goes to one Slack channel that everyone can see, not only to people who have not submitted yet. Word your message accordingly (for example, "if you haven't completed it yet, please fill in the survey").
To use this in your environment, adjust the "Send survey reminder" workflow:
- Make sure the workflow's identifier is exactly
survey-nudge-now, otherwise the Send reminder button's request returns a 404 and no message is sent. - Add a
SLACK_BOT_TOKENsecret to your Port organization, holding a Slack bot token with thechat:writescope. - Set the target Slack channel id in the workflow's Slack step.
Step 3: Add the plugin widgets
With the blueprints created and the plugins uploaded, place each plugin as a widget so people can use it. Add each plugin to a dashboard, then set its parameters.
To add a plugin widget:
- Open a dashboard, click
+ Widget, and choose Custom (then select the plugin). - Fill in the parameters from the table below.
| Plugin | Required parameters | Optional parameters |
|---|---|---|
| Survey Builder | surveyBlueprint = survey | respondentUrl, analyticsUrl |
| Survey Forms | responseBlueprint = surveyResponse | surveyBlueprint = survey |
| Survey Analytics | surveyBlueprint = survey, responseBlueprint = surveyResponse | - |
Each blueprint parameter takes the identifier of the blueprint you created in Step 1. If you used different identifiers, set the parameters to match.
respondentUrl and analyticsUrl are the links behind Survey Builder's Share ("Open survey") and View responses buttons. You usually do not need to set them: by default the plugin builds these links from the embedding portal, pointing at dashboards whose page identifiers are developer_survey (Survey Forms) and survey_analytics (Survey Analytics). If your pages use those identifiers, it just works.
Set them only to override that default, for example when you place those widgets on pages with different identifiers:
respondentUrl: the dashboard URL where you placed the Survey Forms widget.analyticsUrl: the dashboard URL where you placed the Survey Analytics widget.
Set page permissions
Each plugin serves a different audience, so restrict the dashboards (pages) that host them accordingly. Use page permissions to control who can view each one:
- Survey Builder: limit to survey authors and admins (platform team, EMs). This is where surveys are created, published, and shared.
- Survey Analytics: limit to leads and admins who consume results. The widget is read-only, but the data is sensitive.
- Survey Forms: open to everyone who should respond (typically all engineers), since this is the respondent-facing form.
Create a survey
We author and distribute surveys in the Survey Builder widget.
- Click + New survey.
- Choose how to start:
- Pick a built-in framework template (SPACE, DORA, DX Core 4, AI Adoption).
- Use Build with AI to draft a survey from a prompt, for example based on current inefficiencies and bottlenecks.
- Start from a blank, custom survey.
- On the Setup tab, set the title, framework, cadence, anonymity, description, and the default rating scale. For a custom framework, a Framework name is required.
- On the Dimensions and Questions tabs, adjust the structure. The Live preview shows exactly what respondents will see.
- Click Create to save a draft. You stay on the builder so you can keep editing; Save changes is enabled only when there are unsaved edits.
- Click Publish to set the survey to
active. Only active surveys reach respondents. - Click Share to distribute it. Surveys are shared with all teams; set an optional deadline, then confirm. This writes a
surveyCampaignentity that controls who sees the survey. - When the cycle ends, use Close survey in the survey list to set it to
closedso it stops collecting responses. You can Reopen it later, and closed surveys still appear in Survey Analytics.
Create a new survey each cycle (for example, "DORA Q3 2026") but keep the same framework, so you can compare results across cycles in Survey Analytics.
Fill out a survey
Respondents use the Survey Forms widget.
- On the Choose a survey screen, pick a survey. Only active and shared surveys appear.
- Answer the questions. They are grouped into sections by dimension, and a progress bar tracks completion. Required questions are marked.
- Click Submit. If the survey is anonymous, the response is not attributed to you.
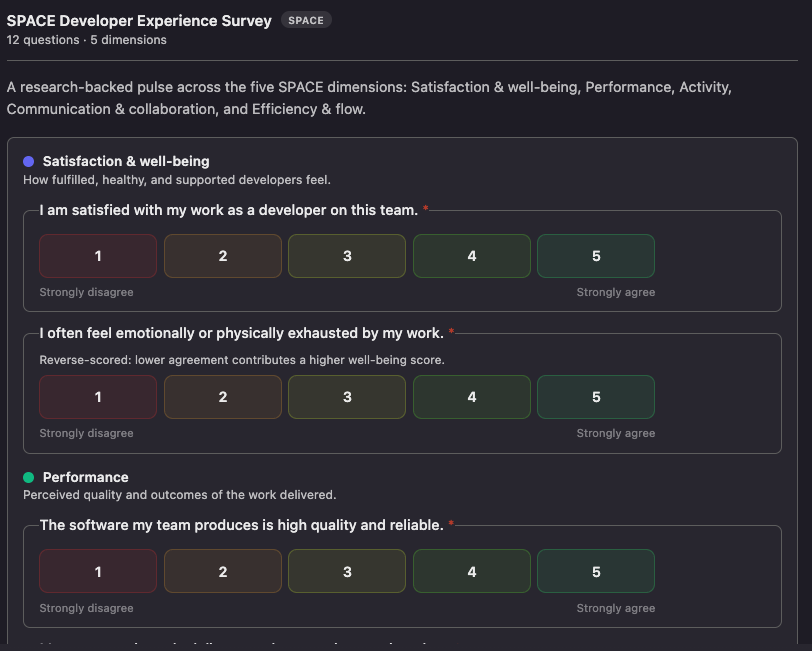
Survey Forms: answering a survey, with questions grouped by dimension.
Use the analytics
The Survey Analytics widget is read-only. It shows an overview of scores, trends, participation, and per-question breakdowns, plus a benchmark comparison for surveys that support it.
Filters (top of the page) apply to everything below:
- Framework comes first and scopes the survey list; then Survey picks which survey to analyze within it.
- Team scopes every chart to one team, or All teams.
- Compare with overlays a specific previous survey for side-by-side comparison.
Overview tab:
- Summary cards: responses, overall score, average responses per team, teams responded, and the weakest dimension.
- Team by dimension heatmap: each team's score per dimension, plus an overall column.
- Dimension scores: bars per dimension (with the compare survey overlaid when selected).
- Trend over time: overall and per-dimension scores across surveys of the same framework.
- Participation: responses versus target per team.
- Questions ranked by score: every scored question, lowest first, with its answer distribution.
- Multi-select responses: for each "select all that apply" question, the share of respondents who picked each option (these questions are unscored). When a compare survey is selected, each option also shows its percentage-point change versus that survey. This section appears only when the survey has at least one answered multi-select question.
- Response log: individual submissions with date, team, and score.
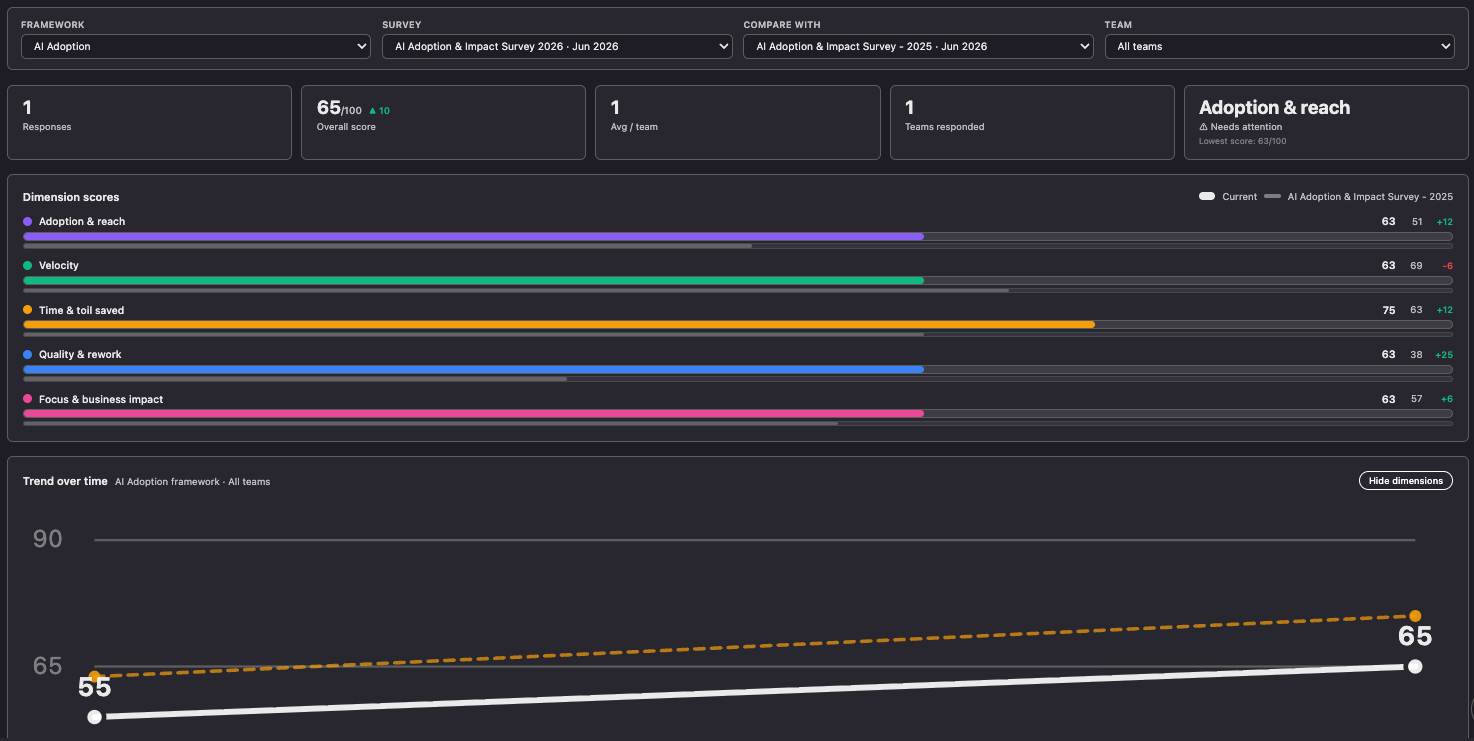
The Survey Analytics Overview tab: filters, summary, dimension scores, and trend.
Benchmark tab (appears only for surveys with benchmark data, such as DORA):
- A headline verdict: the team's overall standing, strongest metric, and the metric that needs attention.
- Per metric: the team's typical answer, a plain-language standing (Top tier to Bottom tier) and how far ahead of the industry the team is.
- A Show distributions toggle reveals the team's answer distribution next to the reference distribution for each metric.
- A scope chip reflects the active Team filter.
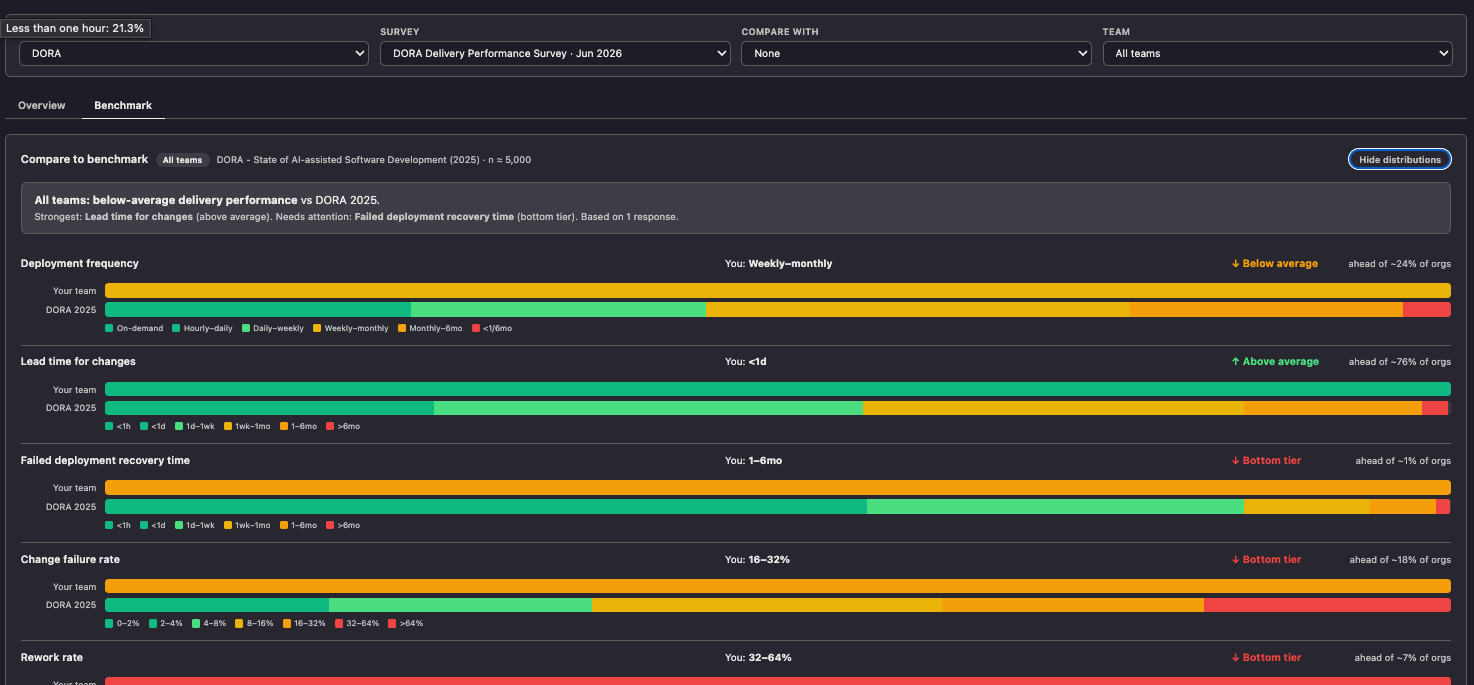
The Benchmark tab, comparing a DORA survey against the DORA 2025 reference.
How scores are calculated
Scores are computed once, on submission, by the Survey Forms plugin and stored on the surveyResponse. Analytics then aggregates those stored values.
Per question (normalized to 0-1):
- Rating scale (likert):
(answer - scale.min) / (scale.max - scale.min). - Single choice:
choice.score / highest score in the question. - Yes / No: yes = 1, no = 0.
- Reverse-scored questions use
1 - value, so lower agreement contributes a higher score (for example, "I feel blocked"). - Free-text and multi-select questions are not scored. Multi-select answers are still surfaced in the Multi-select responses section of the Overview, as a per-option popularity breakdown.
Per dimension (0-100): the mean of that dimension's normalized question values, multiplied by 100.
Overall (0-100): the mean of the dimension scores.
Question ranking: each question's average normalized score across responses, shown lowest first so the biggest pain points surface at the top.
How the benchmark is calculated
For example, for DORA the benchmark compares each metric's answers to a published reference distribution (DORA 2025), joined by the answer's stable value.
- Percentile (
top %): the share of the reference population at that answer or better. Lower is more elite, and it is consistent across every metric. - Your standing: the percentile of the team's median answer for that metric.
- "Ahead of N% of orgs":
100 - top %, so higher is better. - Plain-language bands by percentile: Top tier (≤20), Above average (≤40), Typical (≤60), Below average (≤80), Bottom tier (above 80).
- Overall standing: the mean of the per-metric median percentiles.
These scores reflect what your engineers report, not system telemetry. Treat them as a fast read on perception. For measured DORA metrics from your delivery systems, see the DORA metrics guide.
Next steps
Pair these self-reported survey results with telemetry-based signals from Engineering Intelligence for the full picture:
- Delivery performance: PR cycle time and stale PRs.
- DORA performance: deployment frequency, lead time, change failure rate, and MTTR.
- Pipeline reliability: CI/CD success rates and failure trends.
- Production readiness: ownership, documentation, and on-call rotation.