Create organizational hierarchy views
Send this guide to your coding agent.
Prerequisite: Install Port MCP
Open plan mode. Implement this Port guide in my org via MCP:

https://docs.port.io/guides/all/create-organizational-hierarchy-views

Goal: get the guide's core flow working end-to-end in my org; adapting it to fit my existing setup takes priority over matching the guide 1:1.

Plan:
1. Confirm MCP is connected, in the right org, with sufficient permissions.
2. Diff the guide's data model (blueprints, properties, relations, actions, agents, automations, integrations, secrets) against mine.
3. Propose adaptations for gaps, reusing existing blueprints/relations over guide-named duplicates.
4. Flag what needs a UI click, credential, or secret from me, testing MCP capability empirically before ruling anything out.
5. Stop on any blocker and give me options. Approving this plan authorizes the writes it lists; pause only for writes beyond what's listed.

Build:
- Extend blueprint schema additively when upserting; don't remove or overwrite existing properties, and treat type conflicts as a blocker, not an auto-fix.
- List any mock data in the plan, minimal and labeled mock; once approved, seed it without re-asking, and tell me what you seeded.
- For anything the guide writes downstream (e.g. a webhook target), use a real entity, not a mock.
- For pages/widgets, use the real page identifier from the app URL, not a guessed slug.
- When you hit a UI step confirmed (not assumed) unsupported via MCP, pause, give exact clicks, then resume via MCP.
- Validate and give links after each meaningful step (only a tool-returned URL, no guessed paths); don't proceed if the last run wasn't a success.

Done:
- Confirm the guide's expected output exists and runs in Port.
- Summarize adaptations, seeded data, what was mocked or skipped, remaining UI steps, and how to verify.
This guide demonstrates how to:
- Model the hierarchy tiers in your organization.
- Create dedicated views for each tier, displaying relevant information.
Example use case
Say you have an organization with the following hierarchy:
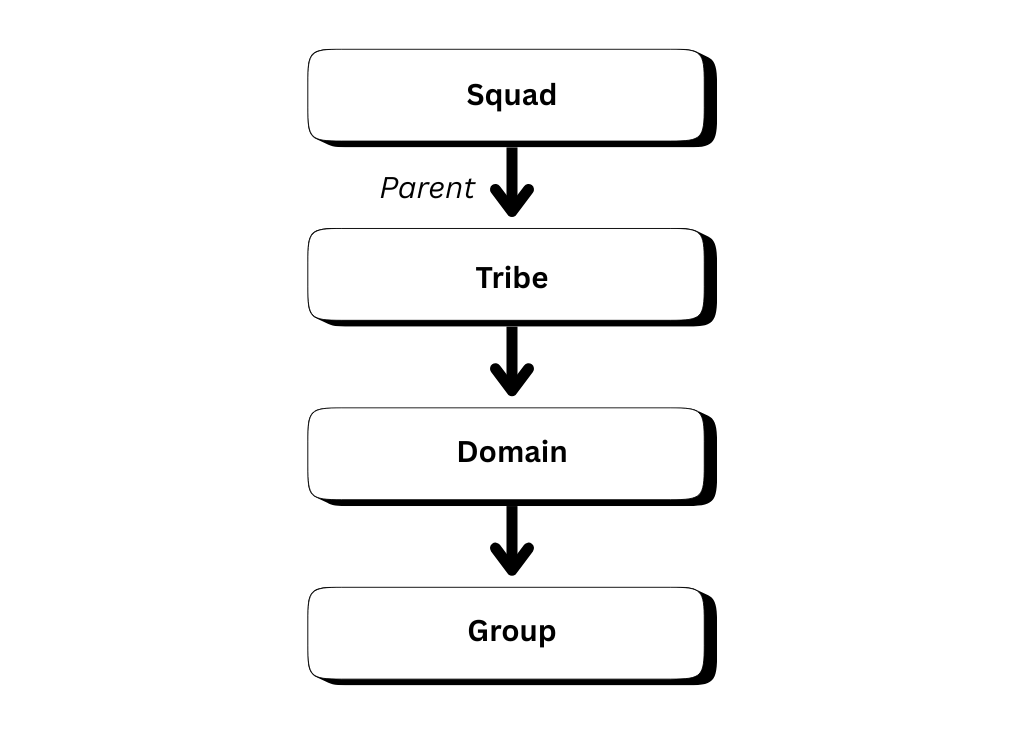
In this example, a group is comprised of one or more domains, which are comprised of one or more tribes, and so on.
Once we model this hierarchy in Port, we can create a single view for a specific tier, where the manager of that tier can see useful information about the tiers below them, such as the services they are responsible for.
Prerequisites
This guide assumes you have a Port account with admin access, and have completed the onboarding process.
Set up data model
To support hierarchy tiers, we will enrich the Team blueprintn that is available by default.
Add a self-relation
The first thing we need to do is add a relation from the Team blueprint to itself.
This will allow us to assign a parent team to each team entity.
-
Go to the builder page of your portal.
-
Search for the
Teamblueprint using the search bar. -
On the bottom of the blueprint card, click on
+ New relation. -
Fill out the form as seen below, then click
Create: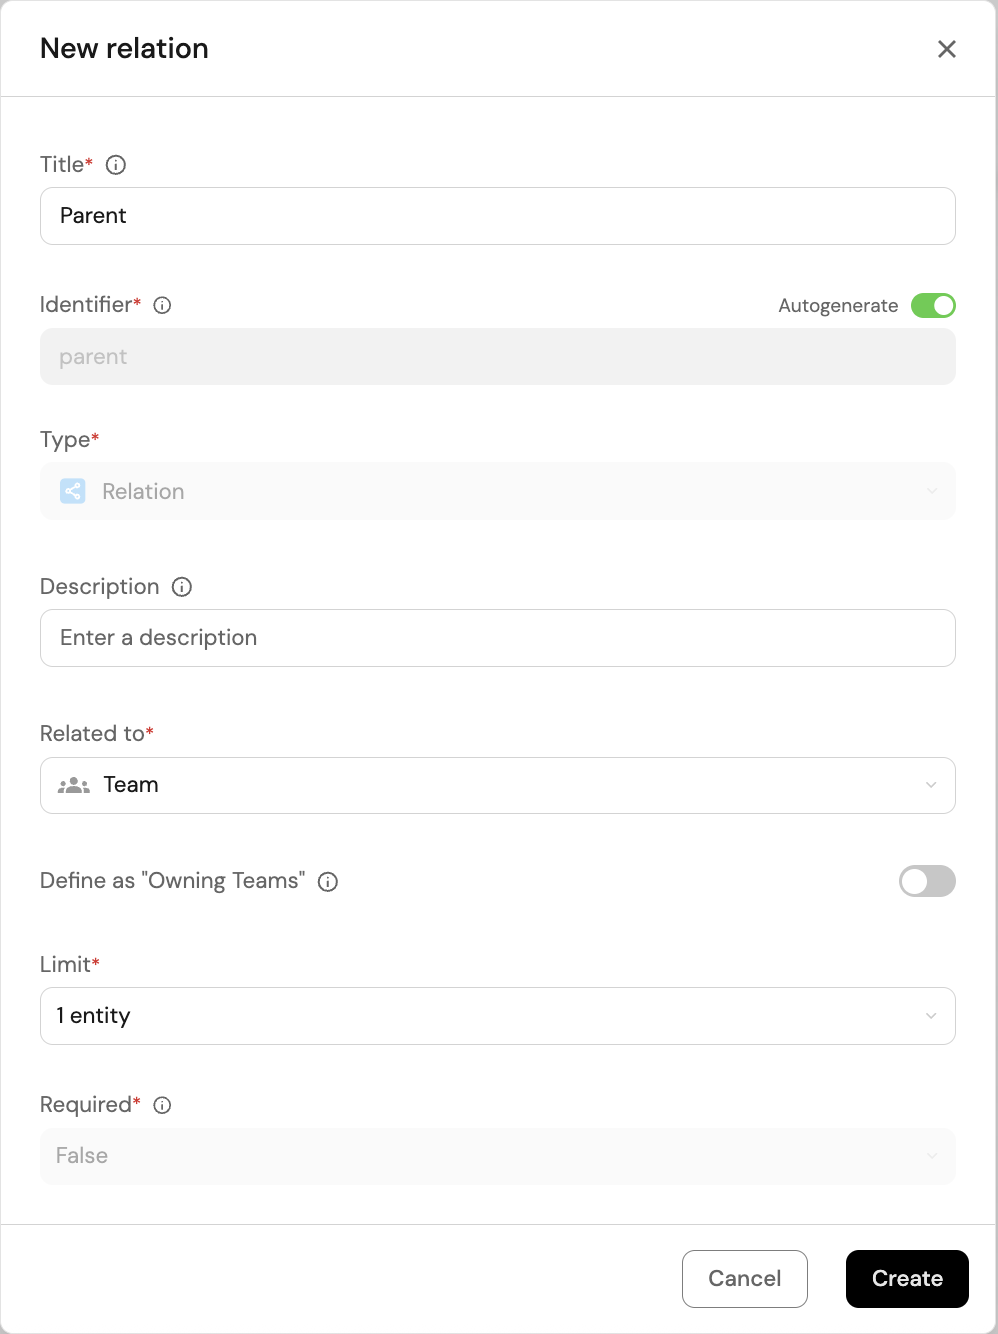
Add a "type" property
Next, let's add a Type property to the Team blueprint to make it easier to see what tiers/types of teams exist.
This property will later be used for filtering in dashboard widgets.
-
In the
Teamblueprint card, click on+ New property, and chooseEnumas the property type. -
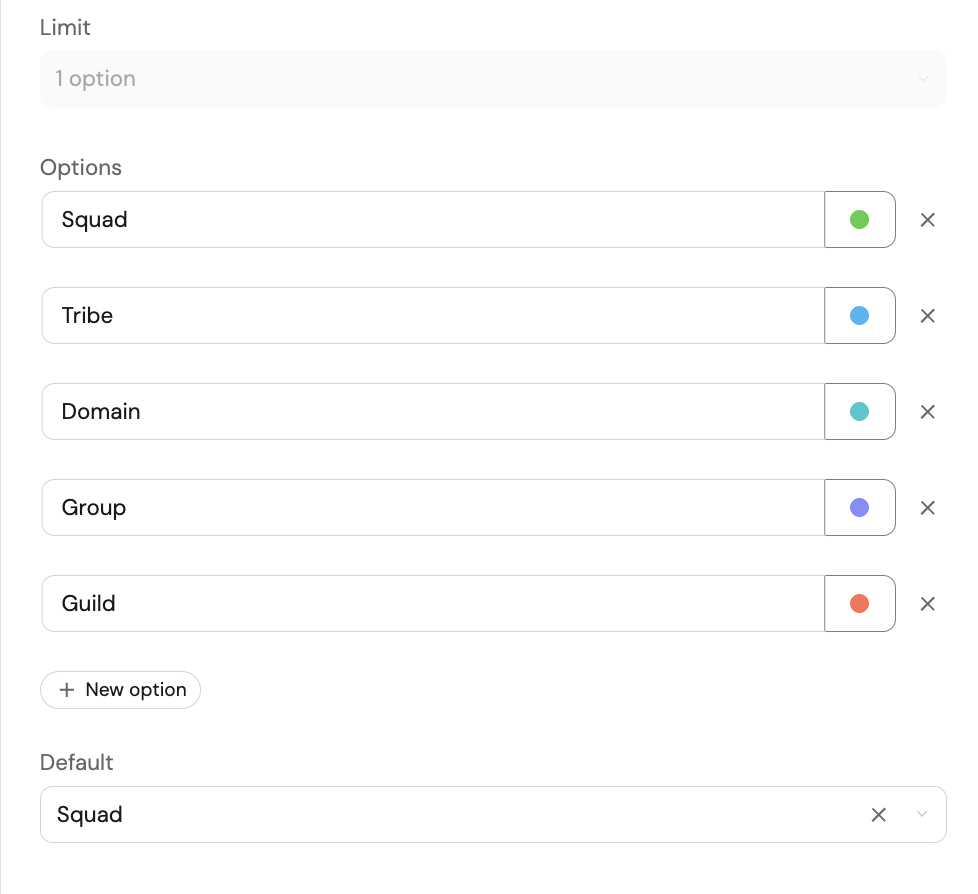
Fill out the form with the options matching your hierarchy tiers, then click
Create.
You can use the following example: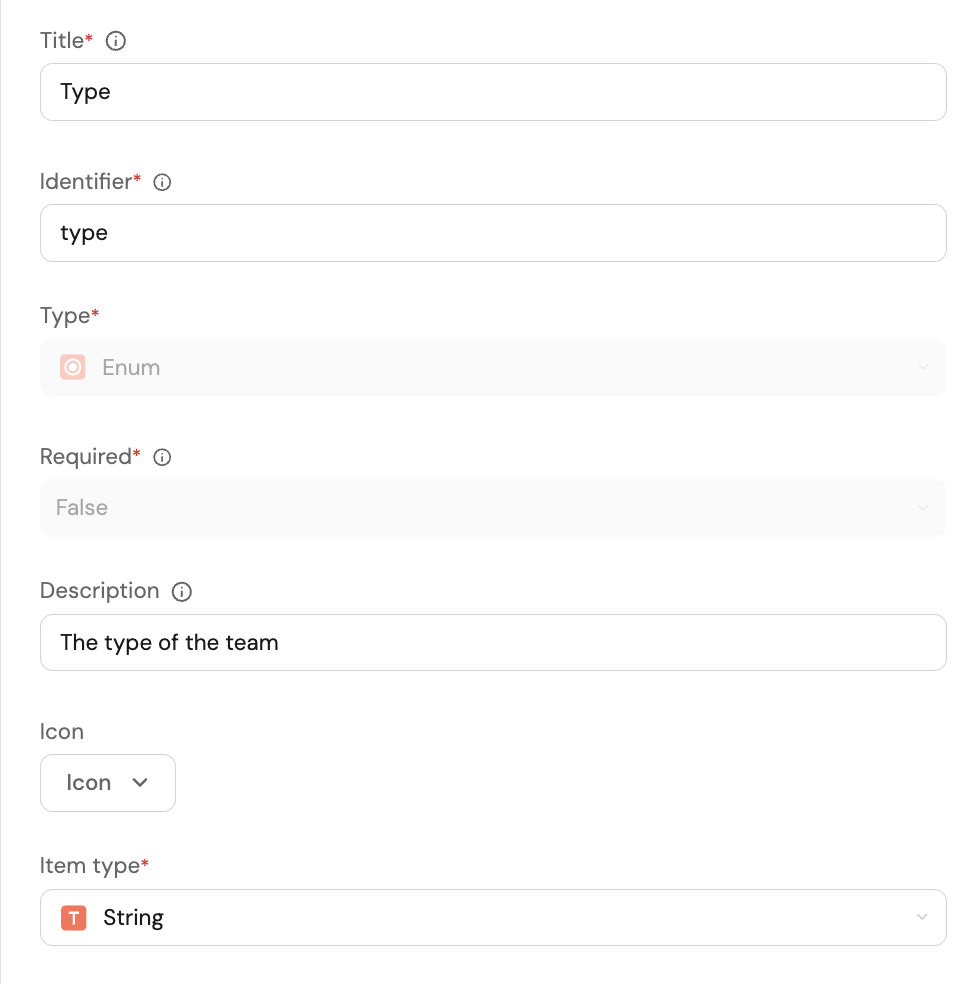
Assign types & parent teams
To finish setting up the data model, we need to assign each team a type and a parent team.
-
In the
Teamblueprint card, click on the
 button to view all of your team entities.
 -
For each team, assign a type and a parent team by hovering over the relevant property and clicking on the

 button.
To make the process of assigning types and parent teams easier, you can use the Manage properties button in the top-right corner of the table to hide other columns.
Create dashboard
Now that our data model is set up, let's create a dedicated dashboard for Tribe leads.
-
Go to the catalog page of your portal.
-
Click on the
+button, then selectNew dashboard. -
Name the dashboard "Tribe Lead". Optionally, give it a description and select an icon, then click
Create.
Next, let's add two useful tables to the dashboard:
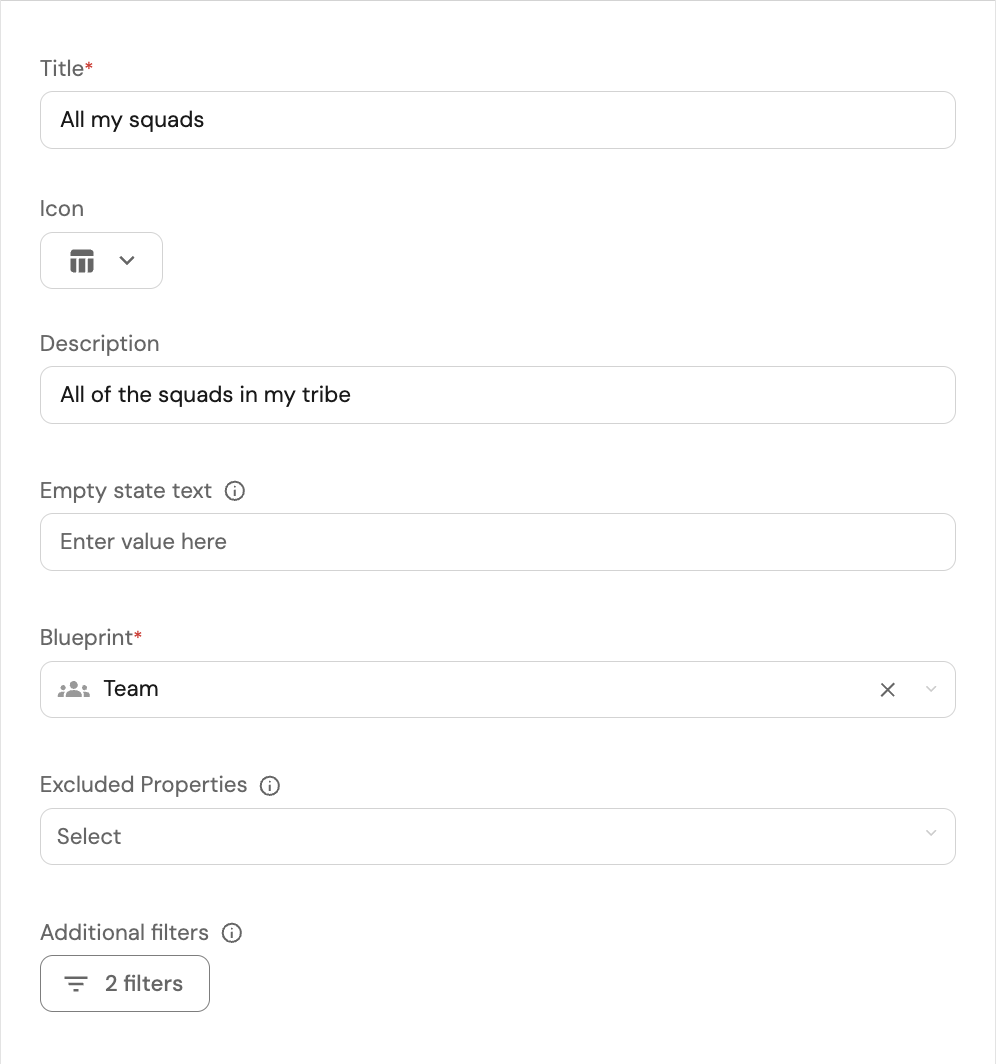
Table 1: all of the tribe's squads
The first table will display all of the squads under the tribe of the logged-in user.
-
In the top-right corner of the dashboard, click on
+ Widget, then selectTable. -
Fill out the form as seen below:
-
Let's define filters to ensure that only the relevant squads are displayed. Click on the
Filtersbutton. -
When defining filters, we can use the UI, or write a JSON object.
Click on theEdit JSON, and paste the following JSON:{"combinator": "and","rules": [{"property": "type","operator": "=","value": "Squad"},{"operator": "matchAny","property": {"path": ["parent"]},"value": ["{{getUserTeams()}}"]}]}This JSON object defines two filters with an
ANDoperator between them:- The first filter ensures that only squads are displayed.
- The second filter ensures that only squads that are children of the logged-in user's teams are displayed.
-
Click
Saveto save the filters, then clickSaveagain to save the table.
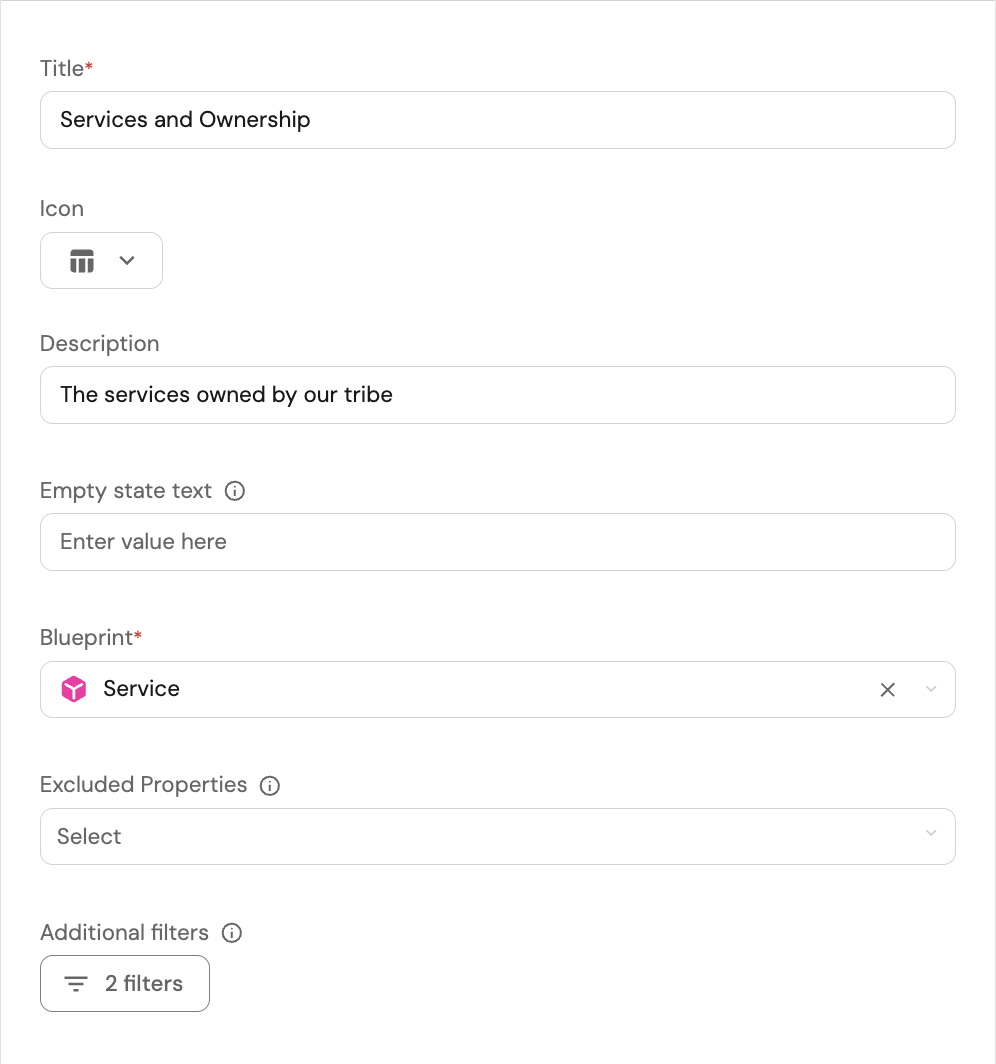
Table 2: all services owned by the tribe
-
In the top-right corner of the dashboard, click on
+ Widget, then selectTable. -
Fill out the form as seen below:
-
Let's define filters to ensure that only the relevant services are displayed. Click on the
Filtersbutton. -
Once again, let's use a JSON object to define the filters.
Click on theEdit JSON, and paste the following JSON:{"combinator": "or","rules": [{"property": "$team","operator": "containsAny","value": ["{{getUserTeams()}}"]},{"operator": "matchAny","property": {"path": ["$team","parent"]},"value": ["{{getUserTeams()}}"]}]}This JSON object defines two filters with an
ORoperator between them:- The first filter ensures that all services owned by the logged-in user's teams are displayed.
- The second filter ensures that all services owned by children of the logged-in user's teams are displayed.
-
Click
Saveto save the filters, then clickSaveagain to save the table.
To achieve the desired filtering, the tables use the matchAny operator.
This operator allows you to search for entities that are related through a specific path of relations.
Read more about this operator here.
Conclusion
Just like we did for the tribe lead, you can create dashboards for managers of each tier in your hierarchy, where they can track and visualize useful information about the teams they are responsible for.
Additionally, you can create other widgets in the dashboard that may interest the managers of each tier.
Some examples include:
- A pie chart showing the distribution of incidents across squads in a tribe.
- Number charts displaying the number of resolved issues per squad in a tribe in a given time period.
- A chart/table displaying the members of each tribe in a domain, by role/name.