Create & track DORA metrics in your portal
This guide includes steps that require integration with GitHub:
- GitHub (Ocean) - uses the Ocean framework. We strongly recommend this integration for new and migrated setups.
- GitHub (Sunset) - uses a GitHub app that is in sunset and will be fully deprecated on September 15, 2026.
This guide demonstrates how to setup and use DORA metrics in your portal.
We will learn how to configure DORA metrics, track them, and view insights to drive engineering improvements.
This guide sets up all the foundational components and works out of the box with GitHub and PagerDuty integrations.
If you define GitLab as your preferred deployment method, complete this guide, then proceed to the GitLab guide to adjust the relevant components.
If you define Jira issues as your preferred deployment and incident method, complete this guide, then proceed to the Jira guide to adjust the relevant components.
Port DORA metrics overview
The DORA Metrics experience helps you track the four key engineering performance indicators: Deployment frequency, Lead time for changes, Mean time to recovery (MTTR), and Change failure rate.
This experience provides:
- A prebuilt setup for collecting DORA metrics.
- Flexible configuration of what counts as deployments and incidents.
- Automated data ingestion via integrations and APIs.
- A centralized dashboard for visibility and insights.
New components
When you install the DORA Metrics experience, Port automatically generates the following components to help you configure, ingest, and visualize your engineering performance data:
Blueprints
DeploymentandIncident: the main components used to calculate your DORA metrics.
Dashboard pages
Set up your deployments: A dashboard page to define what qualifies as a deployment in your organization.Set up your incidents: A dashboard page to define what qualifies as an incident in your organization.DORA metrics: A dashboard page that helps you track your organization's engineering performance over time.
Self-service actions
Create a deployment: an action that creates a deployment.
By default, the dashboard page will contain multiple actions to create a deployment, one for each definition of a deployment.Create an incident: an action that creates an incident.
By default, the dashboard page will contain multiple actions to create an incident, one for each definition of an incident.
Integration mapping
When a user executes the self-service action to define deployments or incidents, the relevant integration mapping (according to the selected deployment/incident method) is updated with a new block.This automates a manual step that would otherwise require editing the integration mapping directly.
Note: filters in the action use an AND operator. To achieve OR logic, run the action multiple times with different filter sets.
Additional components
Port also creates supporting technical mechanisms to ensure stable and reliable data ingestion:
-
Blueprints : Used to avoid accidental data loss during resyncs.
For example, closed pull requests are deleted on resync by default to avoid ingesting historical data.
To preserve relevant data:- Closed PRs are first ingested into a hidden
_deployment_eventblueprint. - An automation that upserts the data into the main
Deploymentblueprint. - This ensures only the hidden blueprint is affected by resync deletions.
- Closed PRs are first ingested into a hidden
-
Automations : Ensure reliable data flow from configuration to ingestion.
- Your self-service actions define how deployments and incidents are tracked.
- These definitions update integration mappings, which ingest data into hidden blueprints.
- Automations then upsert that data into the main blueprints, protecting it from resync deletions.
Prerequisites
To set up DORA metrics in your portal, you will need:
- Admin permissions (in order to install the experience and execute self-service actions).
- A connected GitHub integration (for deployment tracking) or access to custom API setup.
- A connected PagerDuty integration or access to custom API setup.
- GitHub (Ocean)
- GitHub (Sunset)
- The GitHub Ocean integration is installed in your account.
- Port's GitHub integration (GitHub app) is installed in your account.
Set up DORA metrics
-
Go to the Software catalog.
-
Click on the
+button in the left sidebar, then chooseNew experience. -
In the modal, choose
New DORA metrics dashboard. -
Choose a title for your dashboard and click
Create.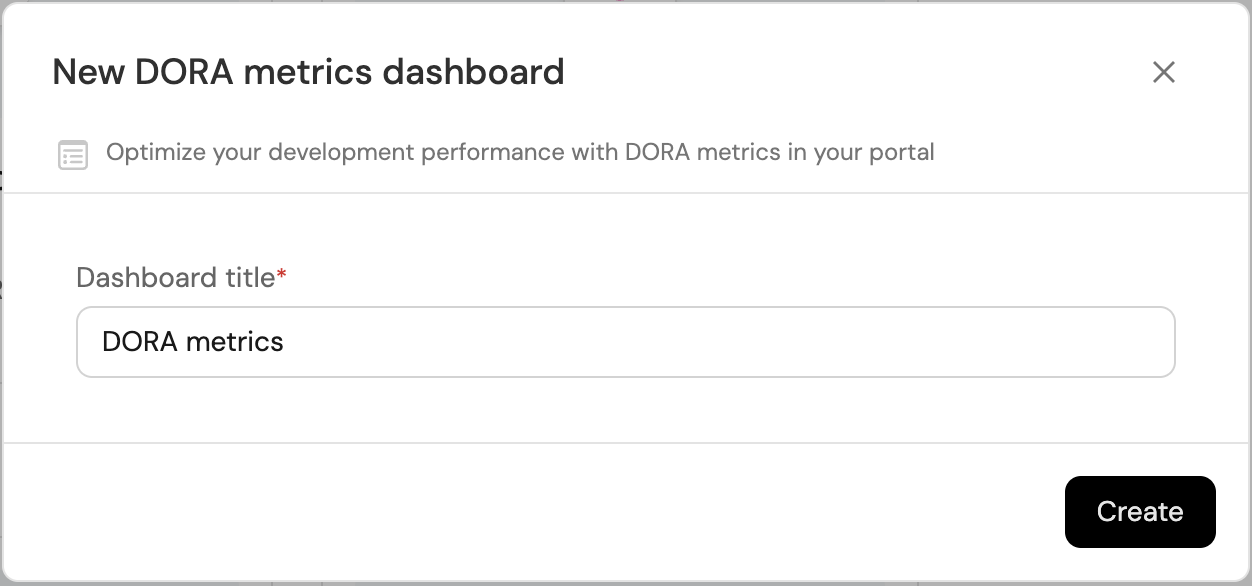
Configure your deployments & incidents
After installation, you need to:
-
Configure Deployments:
- Choose the relevant deployment method according to your organization's definition of a deployment (Merged PRs, GitHub Workflows, GitHub Releases, Github Deployments, Custom API, etc).
- Apply filters (target branch, PR labels, etc) to align with your process.
-
Configure Incidents:
- Choose the relevant incident method according to your organization's definition of an incident (PagerDuty, Custom API, etc).
- Connect to a source like PagerDuty or configure via Custom API.
Pull-request mapping for merged PR deployments
When using Merged PRs as your deployment method, DORA metrics require closed (merged) pull requests to be ingested for lead time for changes. Configure your GitHub integration mapping as follows:
- GitHub (Ocean)
- GitHub (Sunset)
In the first pull-request resource block, use states, maxResults, and since in the selector:
  - kind: pull-request
    selector:
      query: "true"
      states: ["open", "closed"]
      maxResults: 100
      since: 90
For status mapping, use status: .state in your entity mappings (Ocean uses .state instead of .status).
For GitHub Ocean, use .__repository for the repository relation. See the GitHub Ocean migration guide for details.
In the first pull-request resource block, set closedPullRequests: true in the selector:
  - kind: pull-request
    selector:
      query: 'true'
      closedPullRequests: true
For status mapping, use status: .status in your entity mappings.
By default, the GitHub integration only fetches open pull requests. Including closed PRs (via closedPullRequests: true for Legacy or states: ["open", "closed"] for Ocean) ensures that merged and closed PRs are ingested, which is required for lead time for changes and deployment frequency calculations.
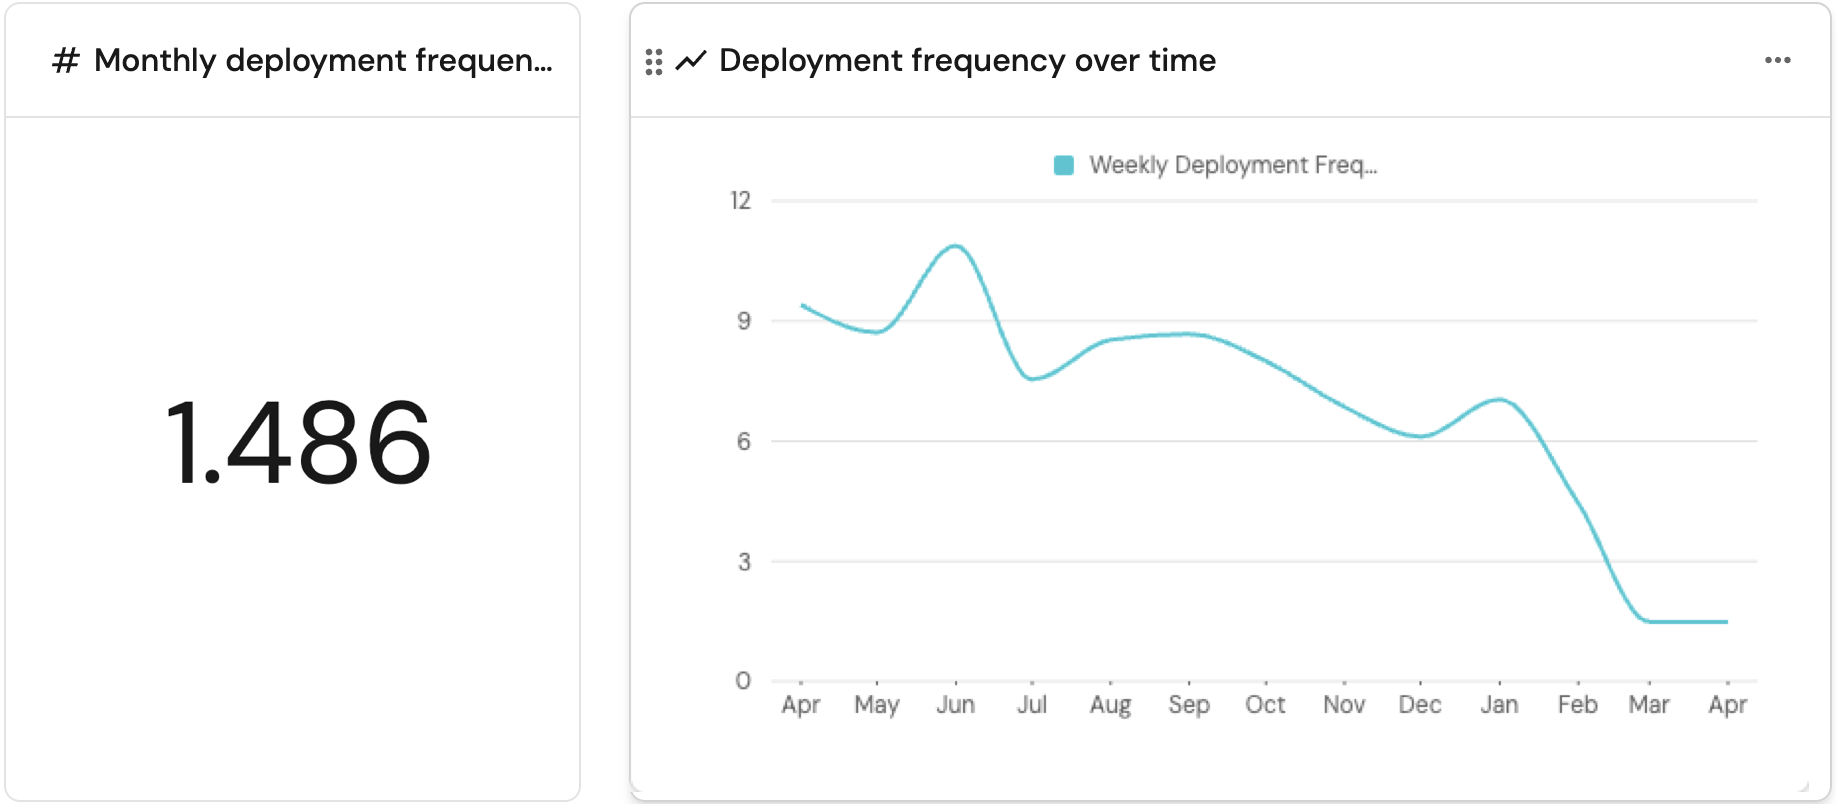
Track results
Navigate to the DORA metrics dashboard created in the "DORA setup & dashboard" folder in your software catalog.
Once your data starts accumulating, you will see visualized metrics including:
- Deployment frequency.
- Lead time for changes.
- Mean time to recovery (MTTR).
- Change failure rate.
These metrics give you a high-level view of your engineering velocity and reliability, helping your team identify areas for improvement.