Build GitHub dashboards in Port
Send this guide to your coding agent.
Prerequisite: Install Port MCP
Open plan mode. Implement this Port guide in my org via MCP:

https://docs.port.io/guides/all/build-github-dashboards-in-port

Goal: get the guide's core flow working end-to-end in my org; adapting it to fit my existing setup takes priority over matching the guide 1:1.

Plan:
1. Confirm MCP is connected, in the right org, with sufficient permissions.
2. Diff the guide's data model (blueprints, properties, relations, actions, agents, automations, integrations, secrets) against mine.
3. Propose adaptations for gaps, reusing existing blueprints/relations over guide-named duplicates.
4. Flag what needs a UI click, credential, or secret from me, testing MCP capability empirically before ruling anything out.
5. Stop on any blocker and give me options. Approving this plan authorizes the writes it lists; pause only for writes beyond what's listed.

Build:
- Extend blueprint schema additively when upserting; don't remove or overwrite existing properties, and treat type conflicts as a blocker, not an auto-fix.
- List any mock data in the plan, minimal and labeled mock; once approved, seed it without re-asking, and tell me what you seeded.
- For anything the guide writes downstream (e.g. a webhook target), use a real entity, not a mock.
- For pages/widgets, use the real page identifier from the app URL, not a guessed slug.
- When you hit a UI step confirmed (not assumed) unsupported via MCP, pause, give exact clicks, then resume via MCP.
- Validate and give links after each meaningful step (only a tool-returned URL, no guessed paths); don't proceed if the last run wasn't a success.

Done:
- Confirm the guide's expected output exists and runs in Port.
- Summarize adaptations, seeded data, what was mocked or skipped, remaining UI steps, and how to verify.
This guide demonstrates how to build GitHub dashboards in Port for dependency security alerts, identity and access management, repository activity, and engineering metrics.
Use the sections below independently, or combine them into one GitHub operations dashboard. Each section includes the data model, ingestion mapping, and dashboard widgets needed for that GitHub use case.
Common use cases
- Monitor open and resolved Dependabot alerts across repositories.
- Audit GitHub organization members, teams, and permissions.
- Track repository visibility, pull requests, issues, and developer activity.
- Collect GitHub engineering metrics and visualize PR and workflow performance.
Prerequisites
This guide assumes the following:
- You have a Port account and have completed the onboarding process.
- Port's GitHub Ocean integration is installed in your account.
- You have access to the GitHub repositories and organizations you want to monitor.
Dependency security alerts
Use this section to build a dashboard for GitHub Dependabot alerts. You will learn how to:
- Create a Dependabot Alert blueprint.
- Ingest Dependabot alerts from GitHub.
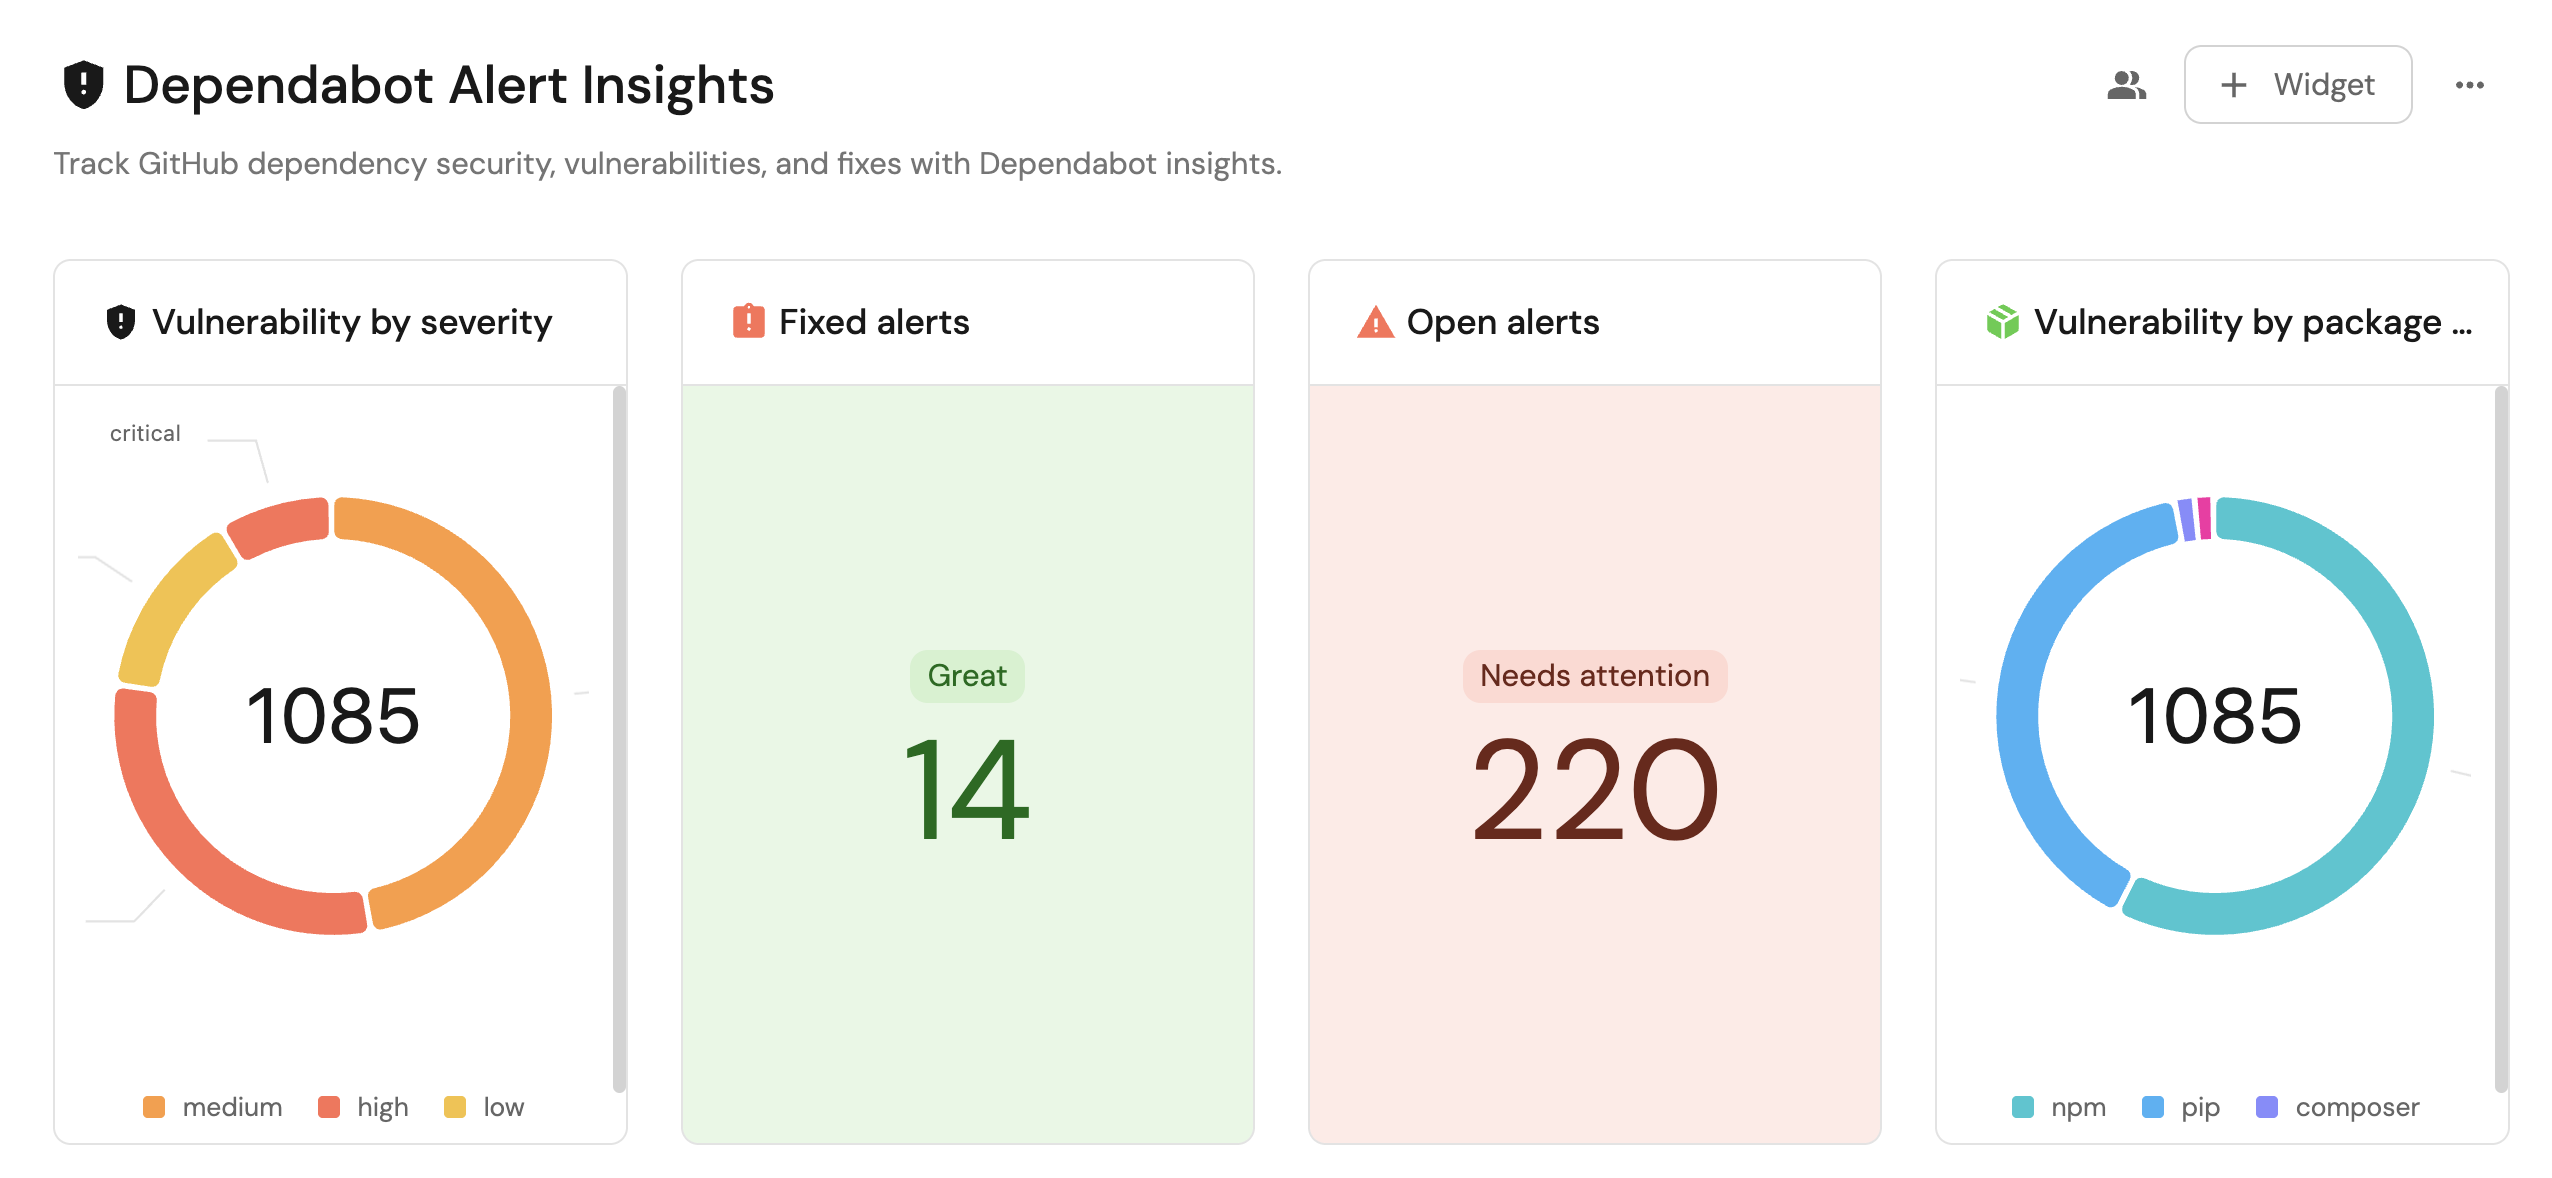
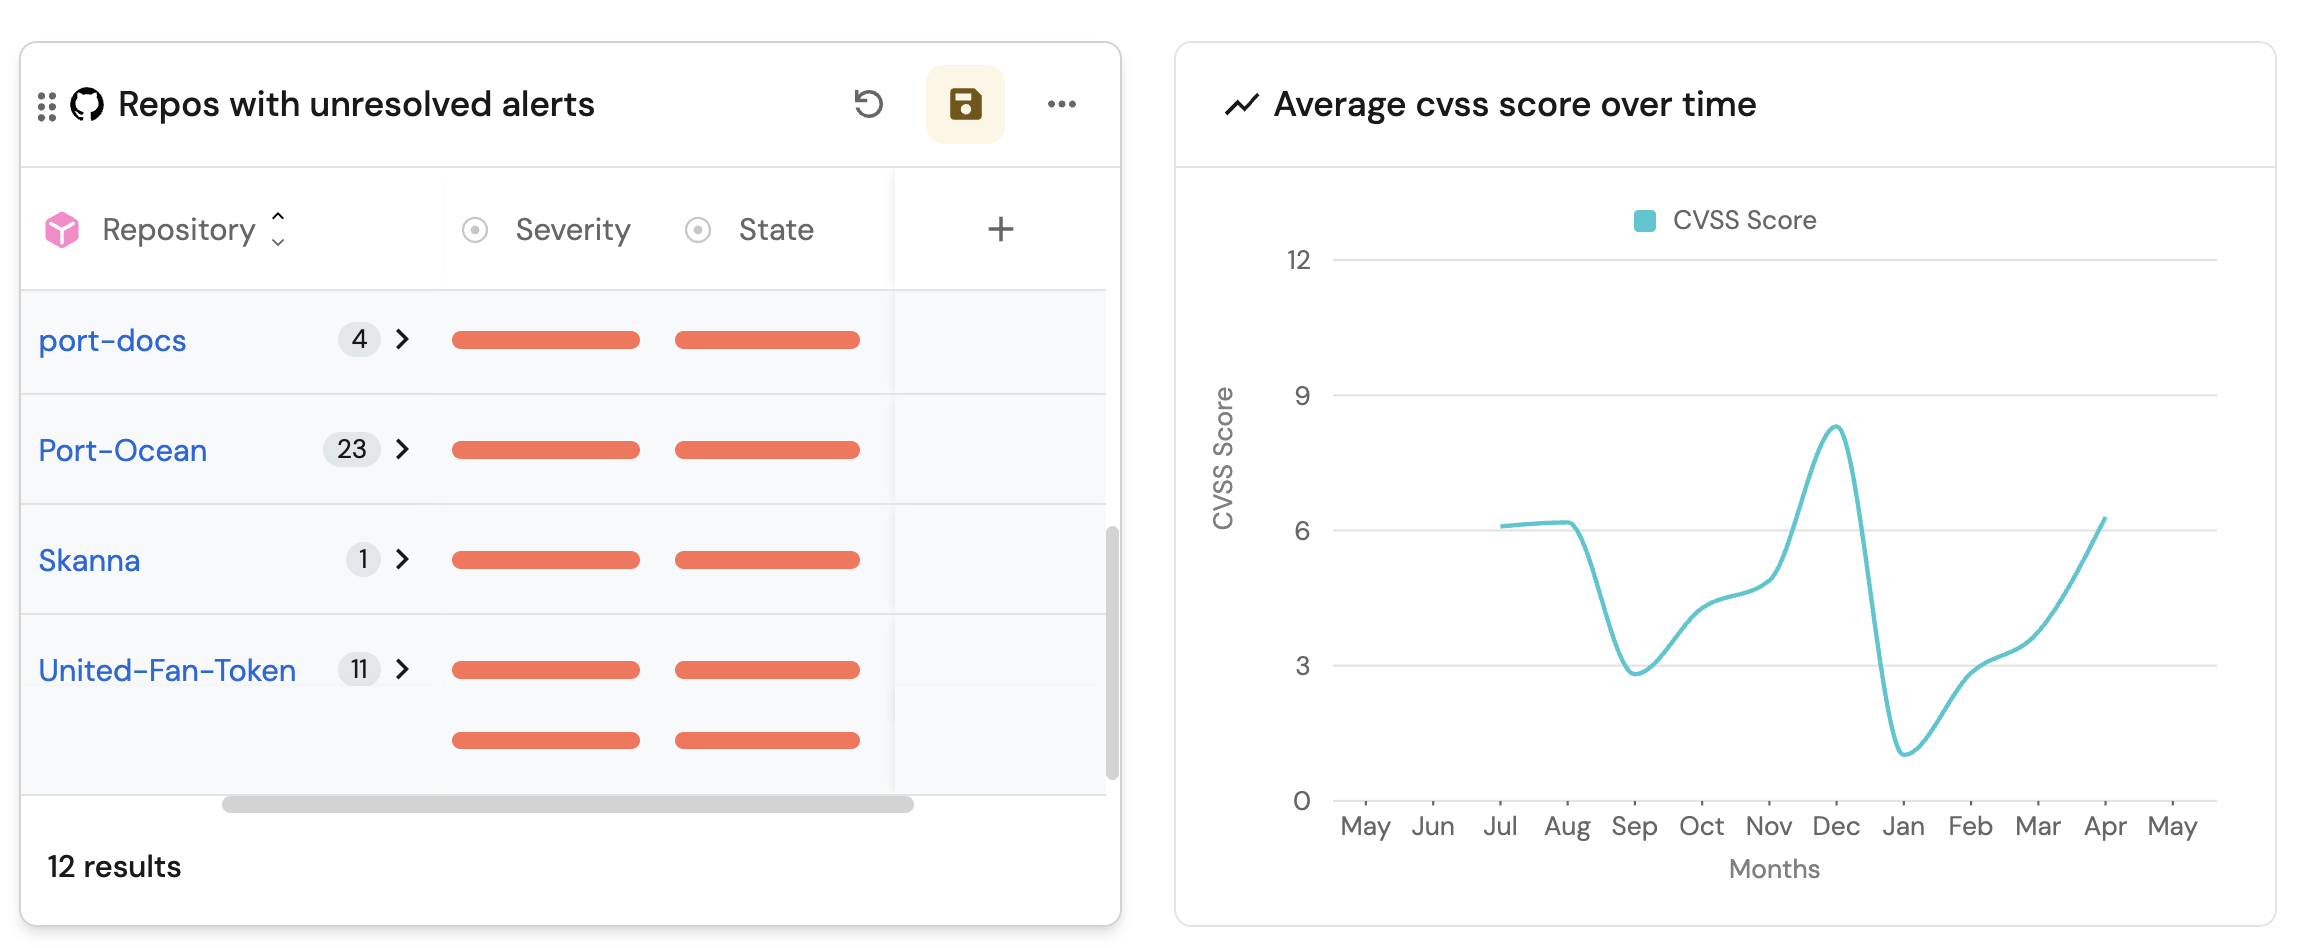
- Visualize alert severity, package ecosystem, CVSS trends, and unresolved alerts.
Set up the Dependabot alert data model
When installing the GitHub integration, the Repository blueprint is created by default. The Dependabot Alert blueprint is not created automatically, so we will need to create it manually.
Create the GitHub Dependabot alert blueprint
Follow the steps below to create the Dependabot Alert blueprint.
Skip to the data source mapping step below if you already have the blueprint.
-
Go to your Builder page.
-
Click on + Blueprint.
-
Click on the
{...}button in the top right corner, and chooseEdit JSON. -
Add this JSON schema:
GitHub Dependabot alert blueprint (Click to expand)
{"identifier": "githubDependabotAlert","title": "Dependabot Alert","icon": "Github","schema": {"properties": {"severity": {"title": "Severity","type": "string","enum": ["low", "medium", "high", "critical"],"enumColors": {"low": "yellow","medium": "orange","high": "red","critical": "red"},"icon": "DefaultProperty"},"state": {"title": "State","type": "string","enum": ["auto_dismissed", "dismissed", "fixed", "open"],"enumColors": {"auto_dismissed": "green","dismissed": "green","fixed": "green","open": "red"},"icon": "DefaultProperty"},"packageName": {"icon": "DefaultProperty","title": "Package Name","type": "string"},"packageEcosystem": {"title": "Package Ecosystem","type": "string"},"manifestPath": {"title": "Manifest Path","type": "string"},"scope": {"title": "Scope","type": "string"},"ghsaID": {"title": "GHSA ID","type": "string"},"cveID": {"title": "CVE ID","type": "string"},"cvssScore": {"type": "number","title": "CVSS Score"},"url": {"title": "URL","type": "string","format": "url"},"references": {"icon": "Vulnerability","title": "References","type": "array","items": {"type": "string","format": "url"}},"alertCreatedAt": {"icon": "DefaultProperty","type": "string","title": "Alert Created At","format": "date-time"},"alertUpdatedAt": {"icon": "DefaultProperty","type": "string","title": "Alert Updated At","format": "date-time"}},"required": []},"mirrorProperties": {},"calculationProperties": {},"relations": {"repository": {"title": "Repository","target": "githubRepository","required": true,"many": false}}} -
Click Save to create the blueprint.
Ingest Dependabot alerts from GitHub
-
Go to your Data Source page.
-
Select the GitHub integration relevant to you.
-
Add the following YAML block into the editor to ingest data from GitHub:
GitHub Ocean integration configuration (Click to expand)
resources:- kind: repositoryselector:query: "true"includedFiles:- README.mdport:entity:mappings:identifier: .nametitle: .nameblueprint: '"githubRepository"'properties:readme: .__includedFiles["README.md"]url: .html_urldefaultBranch: .default_branch- kind: dependabot-alertselector:query: "true"states: ["open", "fixed"]port:entity:mappings:identifier: .__repository + "/" + (.number | tostring)title: .number | tostringblueprint: '"githubDependabotAlert"'properties:state: .stateseverity: .security_advisory.severitypackageName: .dependency.package.namepackageEcosystem: .dependency.package.ecosystemmanifestPath: .dependency.manifest_pathscope: .dependency.scopeghsaID: .security_advisory.ghsa_idcveID: .security_advisory.cve_idcvssScore: .security_advisory.cvss.scoreurl: .html_urlreferences: "[.security_advisory.references[].url]"alertCreatedAt: .created_atalertUpdatedAt: .updated_atrelations:repository: .__repository -
Click Save & Resync to apply the mapping.
Visualize Dependabot alert insights
Once the GitHub data is synced, we can create a dedicated dashboard in Port to monitor and analyze dependency vulnerability alerts using customizable widgets.
Create the Dependabot alerts dashboard
-
Navigate to your software catalog.
-
Click on the
+button in the left sidebar. -
Select New dashboard.
-
Name the dashboard Dependabot Alert Insights.
-
Select the
Vulnerabilityicon. -
Click Create.
We now have a blank dashboard where we can start adding widgets to visualize insights from the Dependabot alerts.
Add Dependabot alert widgets
In the new dashboard, create the following widgets:
Vulnerability by severity (Click to expand)
-
Click
+ Widgetand select Pie chart. -
Title:
Vulnerability by severity. -
Choose the Dependabot Alert blueprint.
-
Under
Breakdown by property, select the Severity property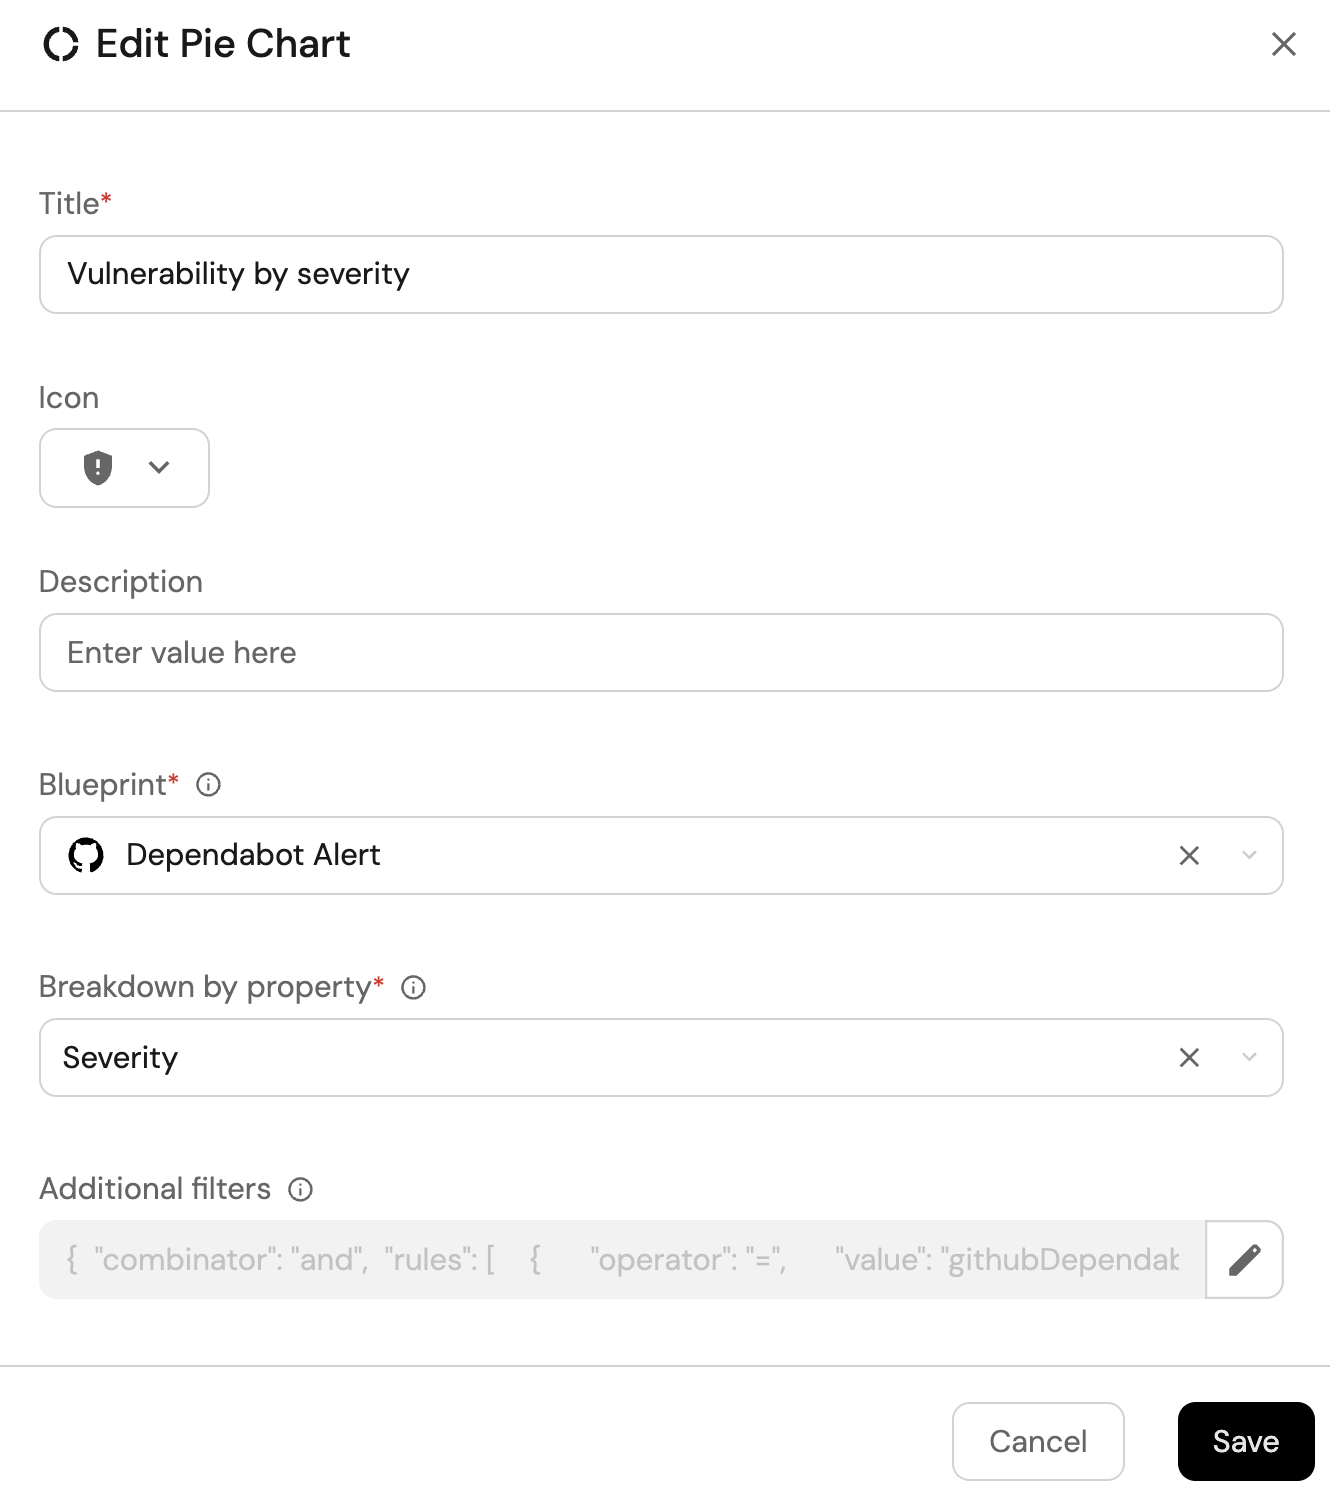
-
Click Save.
Vulnerability by package type (Click to expand)
-
Click
+ Widgetand select Pie chart. -
Title:
Vulnerability by package type. -
Choose the Dependabot Alert blueprint.
-
Under
Breakdown by property, select the Package Ecosystem property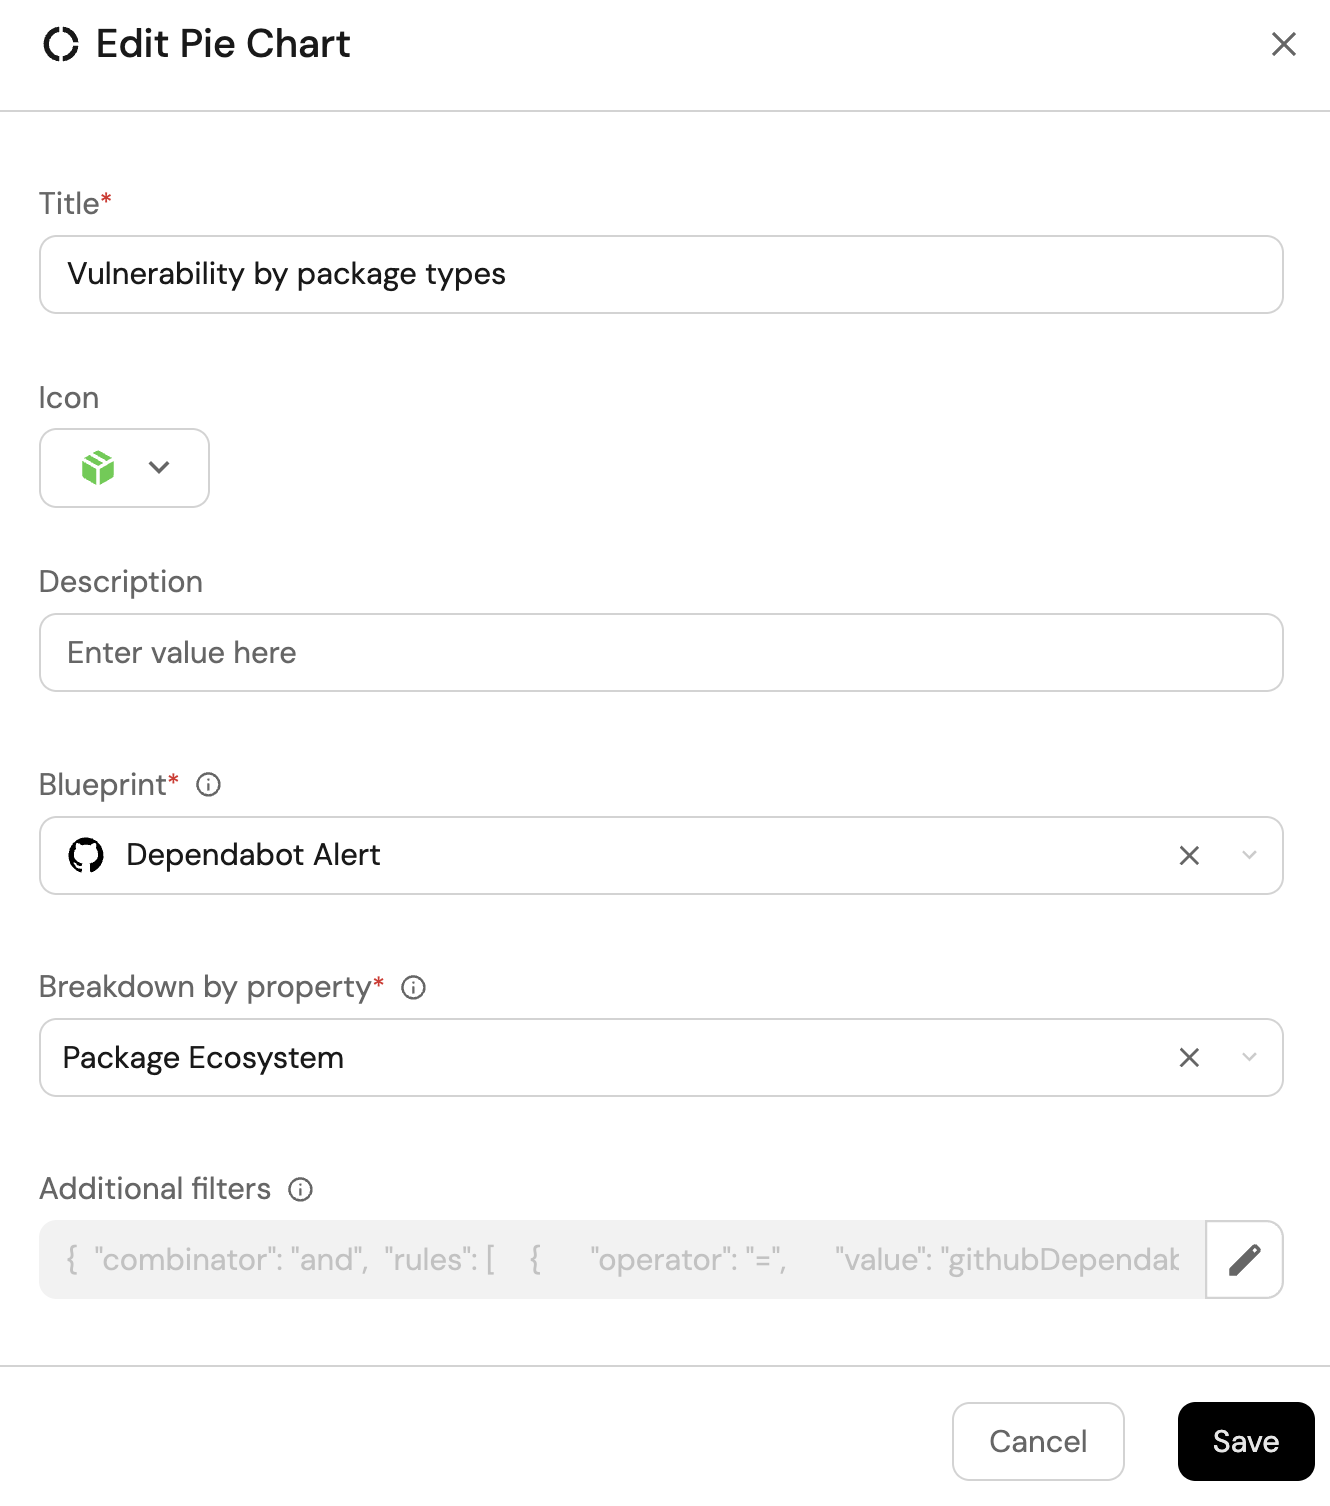
-
Click Save.
Open alerts updated in the last 6 months (Click to expand)
-
Click
+ Widgetand select Number Chart. -
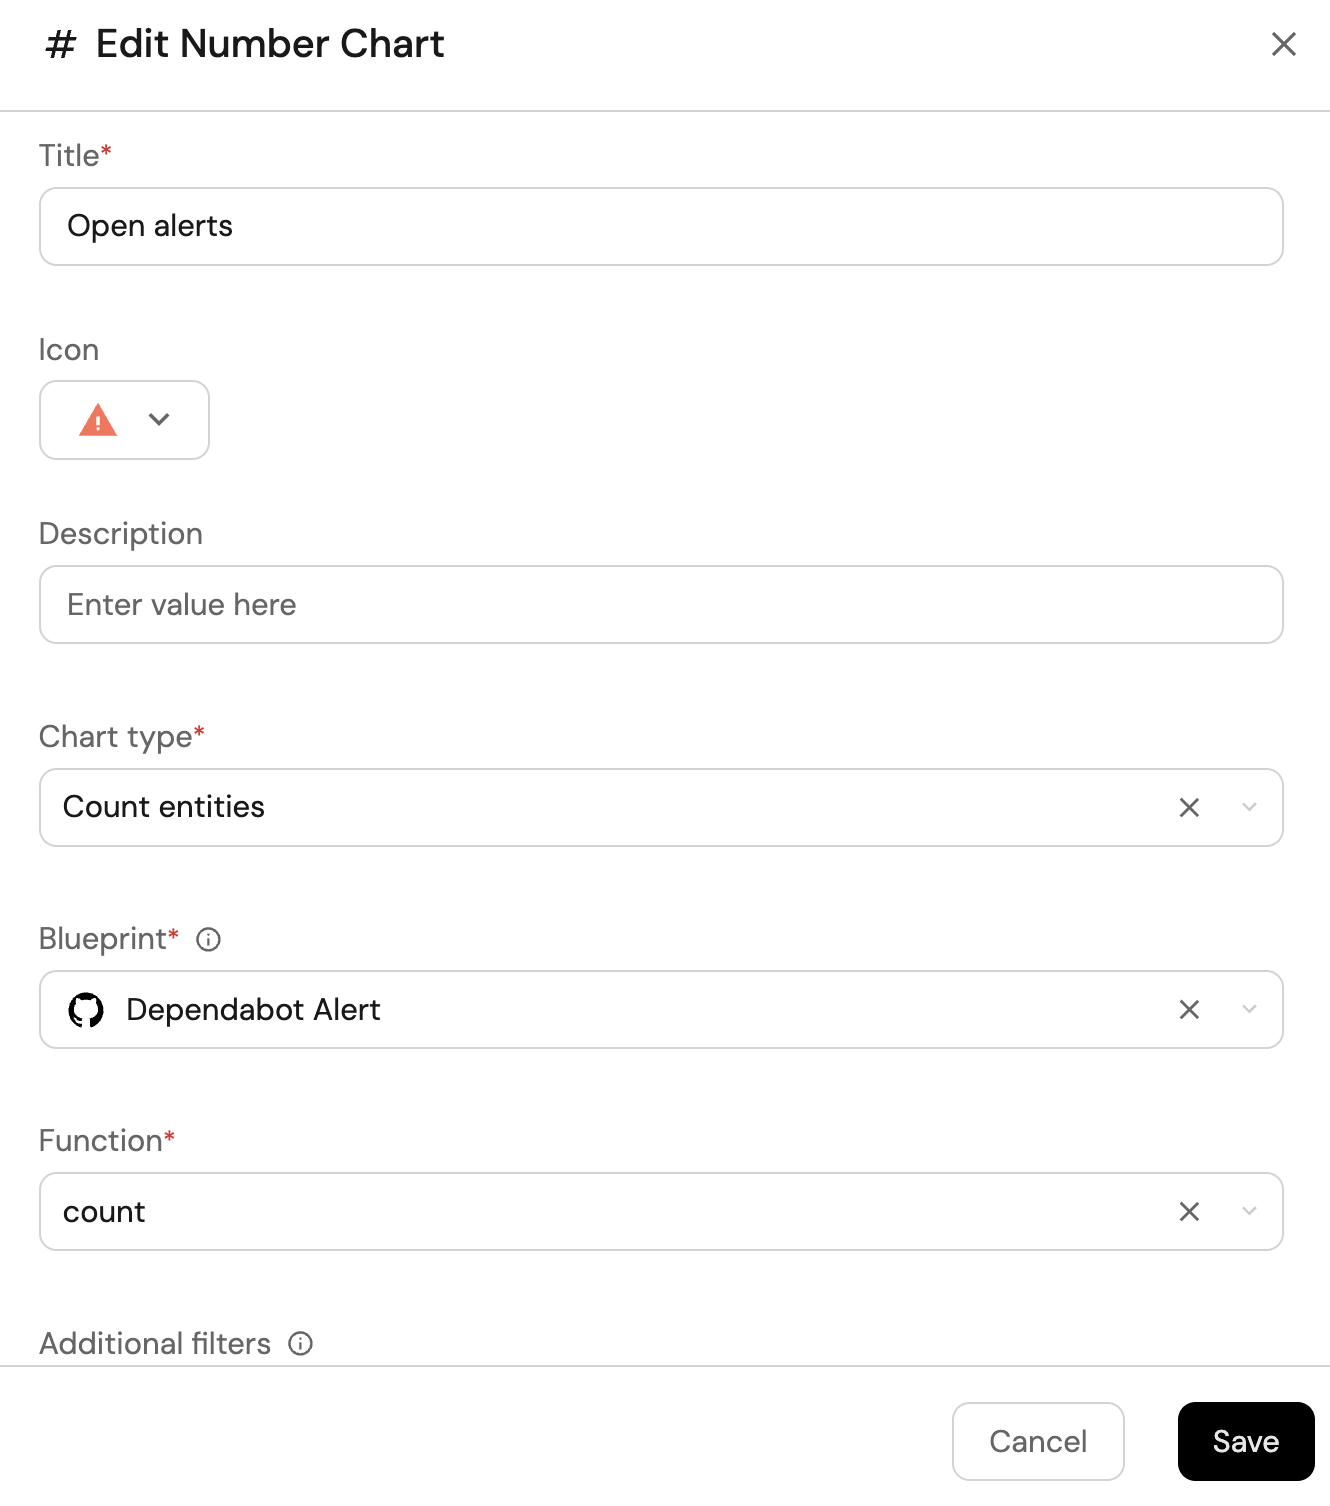
Title:
Open alerts(add theAlerticon). -
Select Count entities Chart type and choose Dependabot Alert as the Blueprint.
-
Select count for the Function.
-
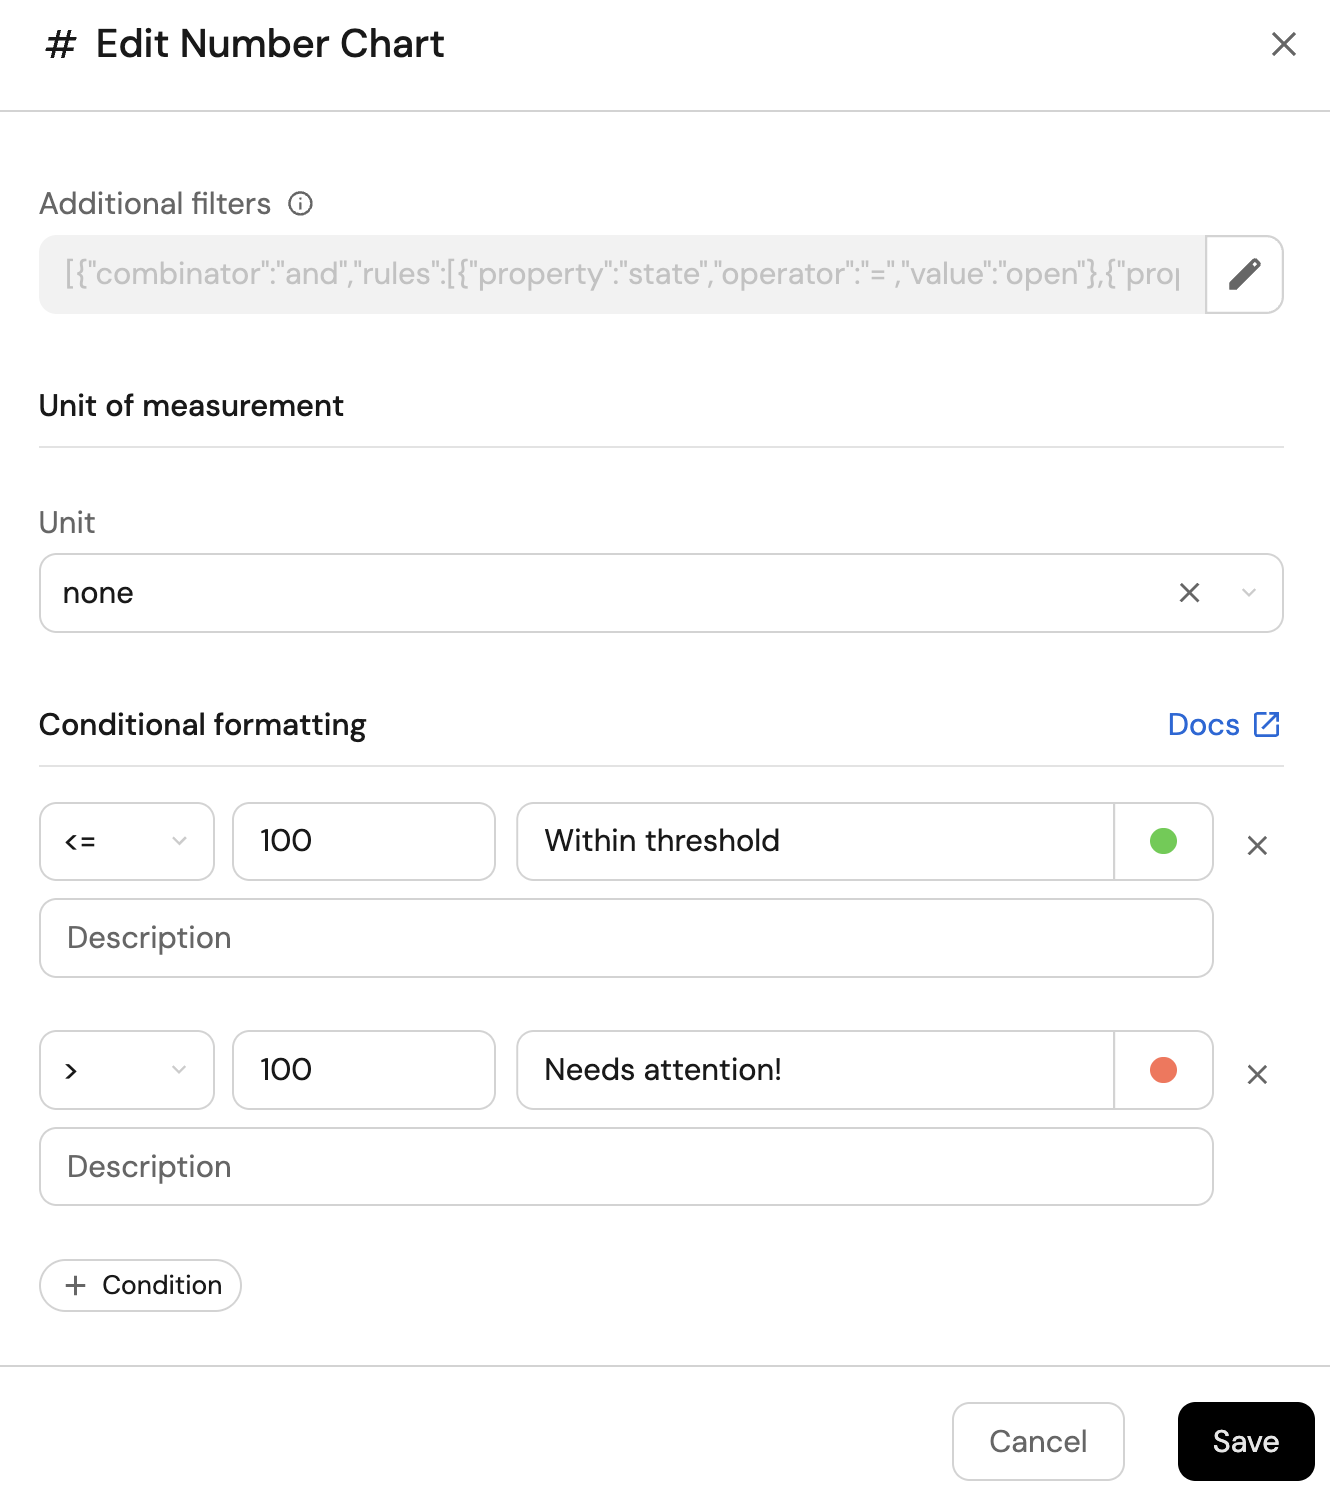
Add this JSON to the Additional filters editor to filter
openalerts updated in the last 6 months:[{"combinator":"and","rules":[{"property":"state","operator":"=","value":"open"},{"property":"alertUpdatedAt","operator":"between","value":{"preset":"last6Months"}}]}] -
You may optionally configure conditional formatting to contextualize the numbers on the widget.
-
Click Save.
Fixed alerts (Click to expand)
-
Click
+ Widgetand select Number Chart. -
Title:
Fixed alerts(add theBadgeAlerticon). -
Select Count entities Chart type and choose Dependabot Alert as the Blueprint.
-
Select count for the Function.
-
Add this JSON to the Additional filters editor to filter
fixedalerts:[{"combinator":"and","rules":[{"property":"state","operator":"=","value":"fixed"}]}]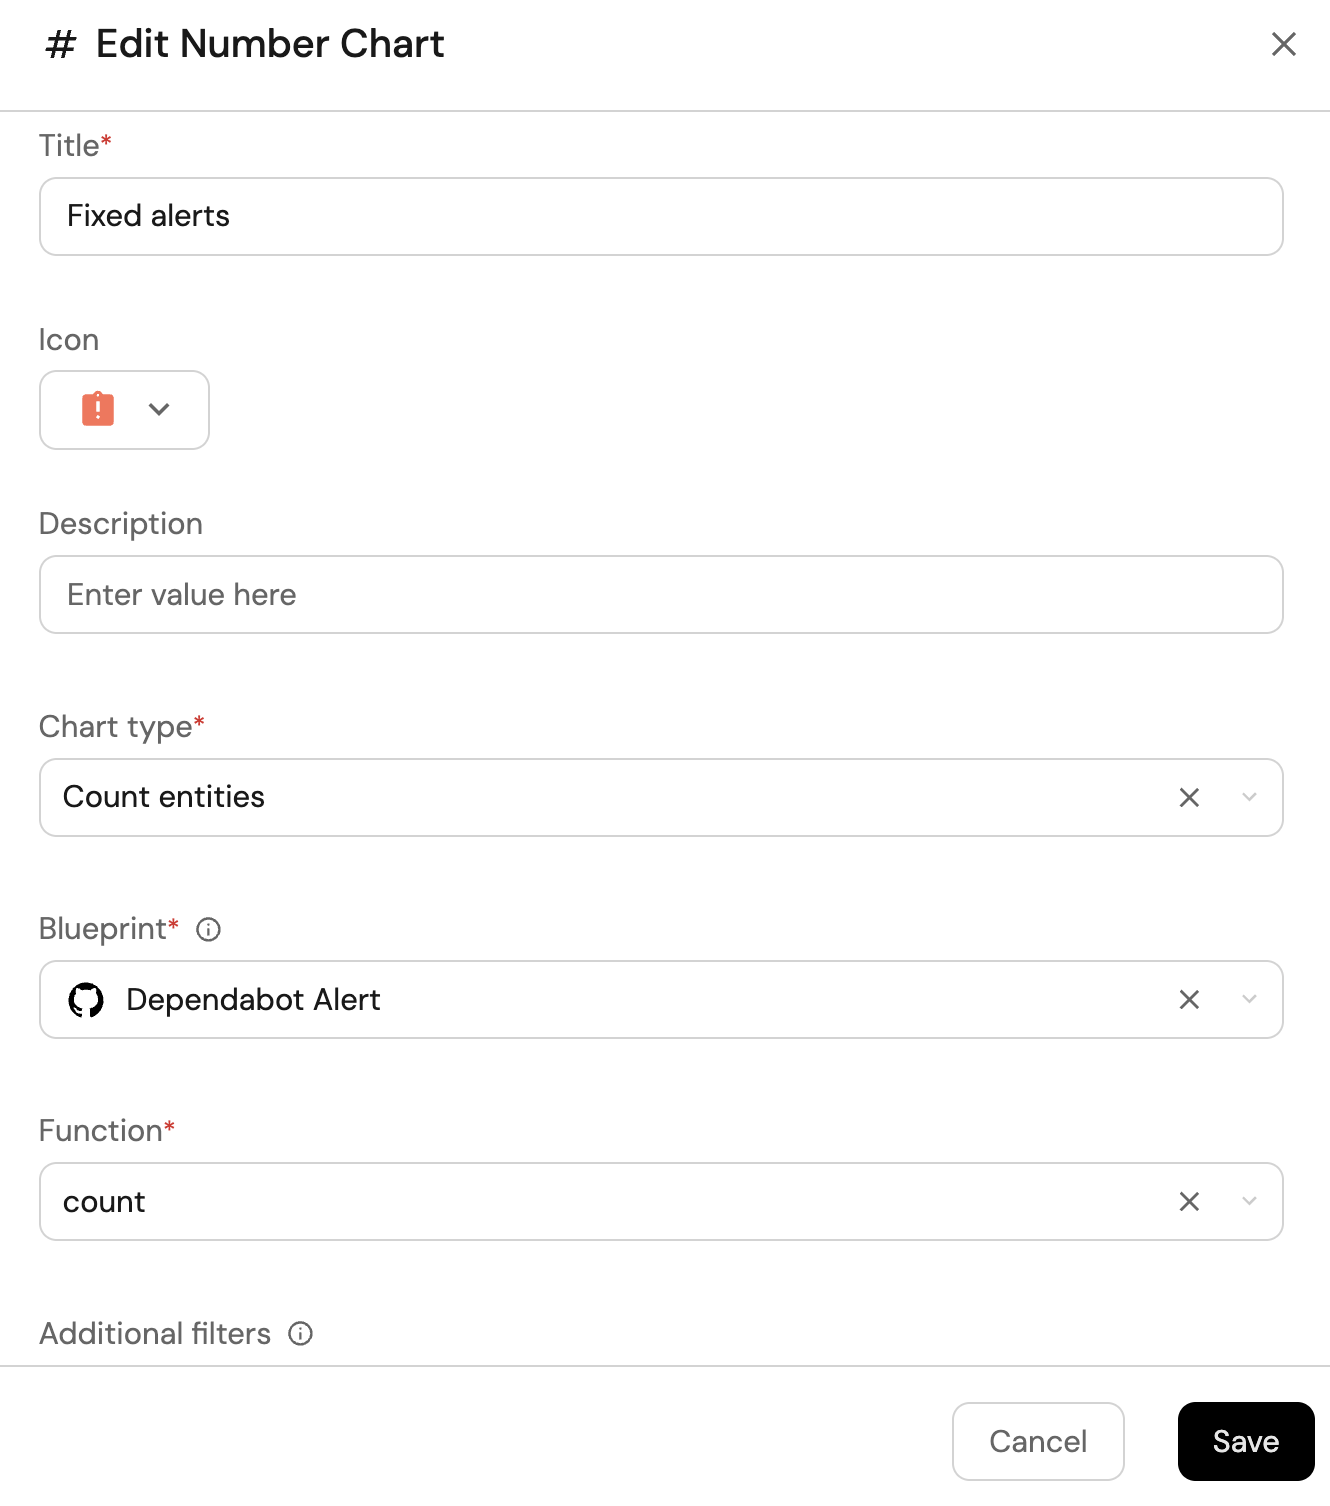
-
Click Save.
Dismissed alerts (Click to expand)
-
Click
+ Widgetand select Number Chart. -
Title:
Dismissed alerts. -
Select Count entities Chart type and choose Dependabot Alert as the Blueprint.
-
Select count for the Function.
-
Add this JSON to the Additional filters editor to filter
Dismissed alertsalerts:[{"combinator":"and","rules":[{"property":"state","operator":"=","value":"auto_dismissed"}]}]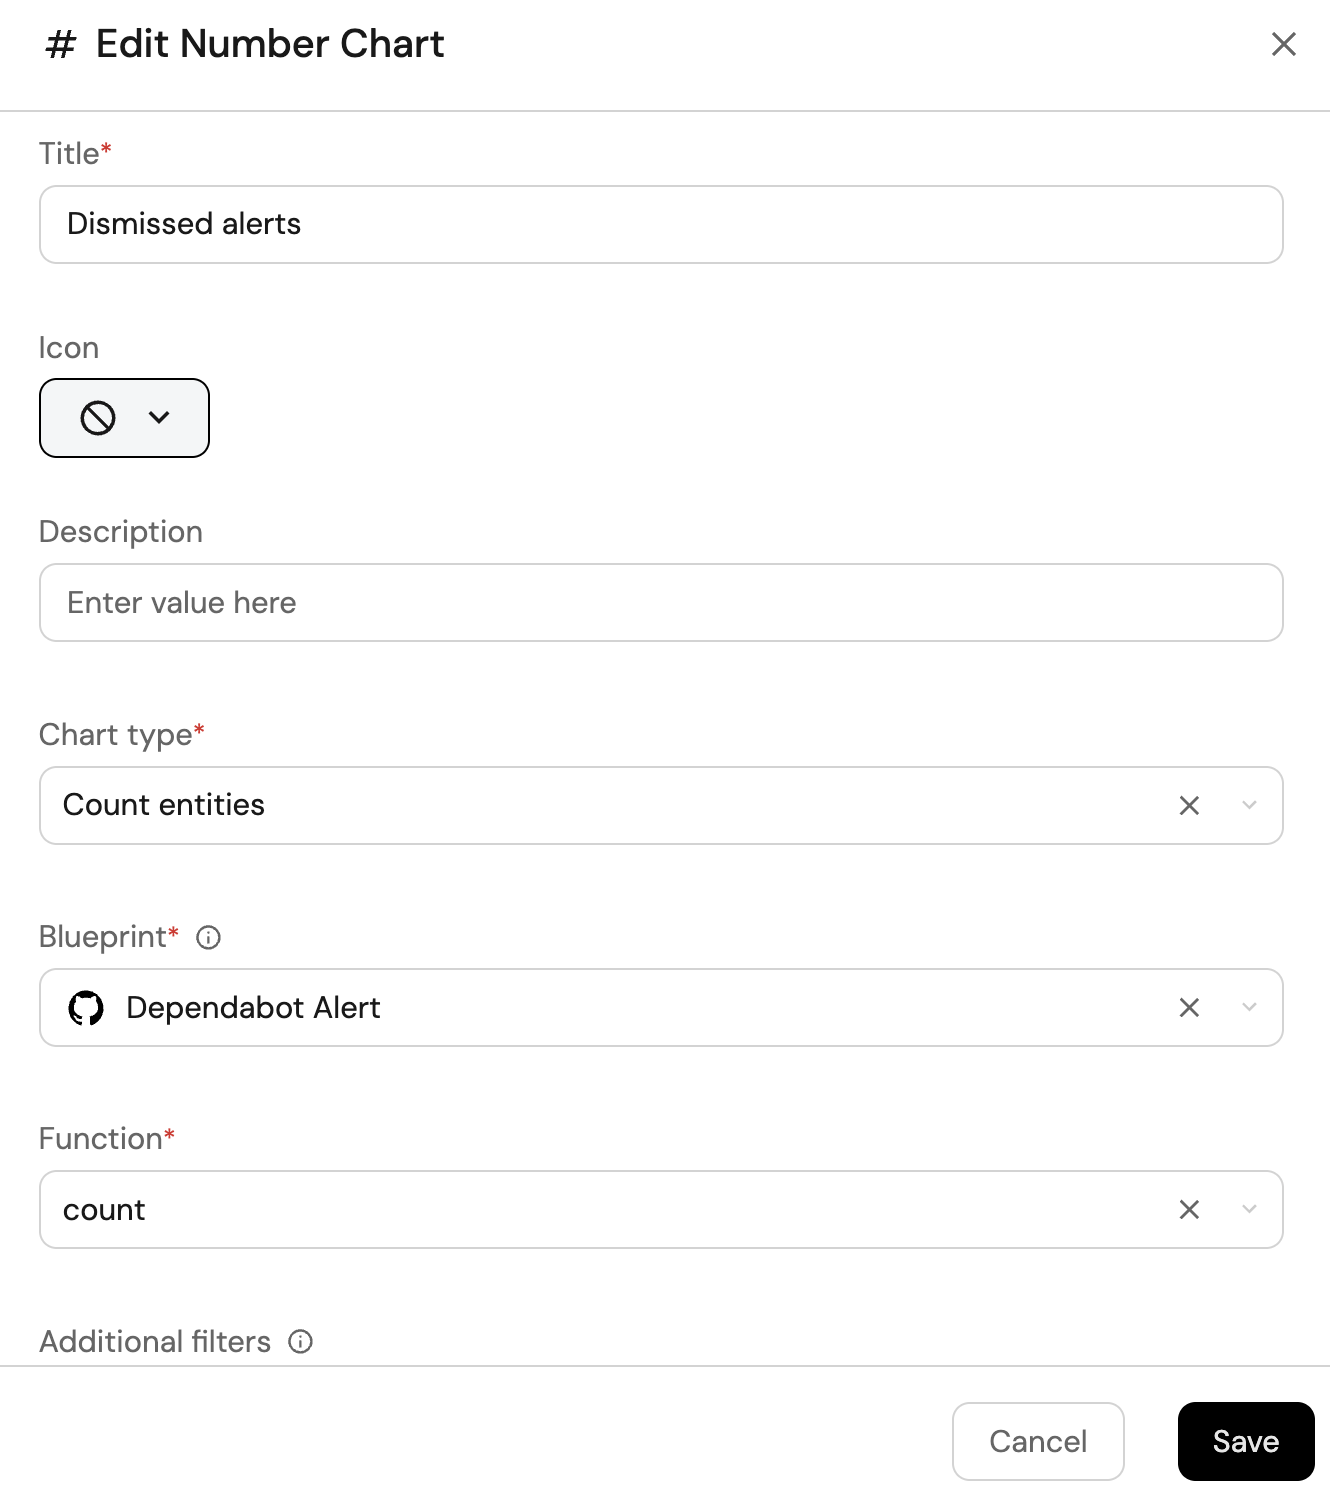
-
Click Save.
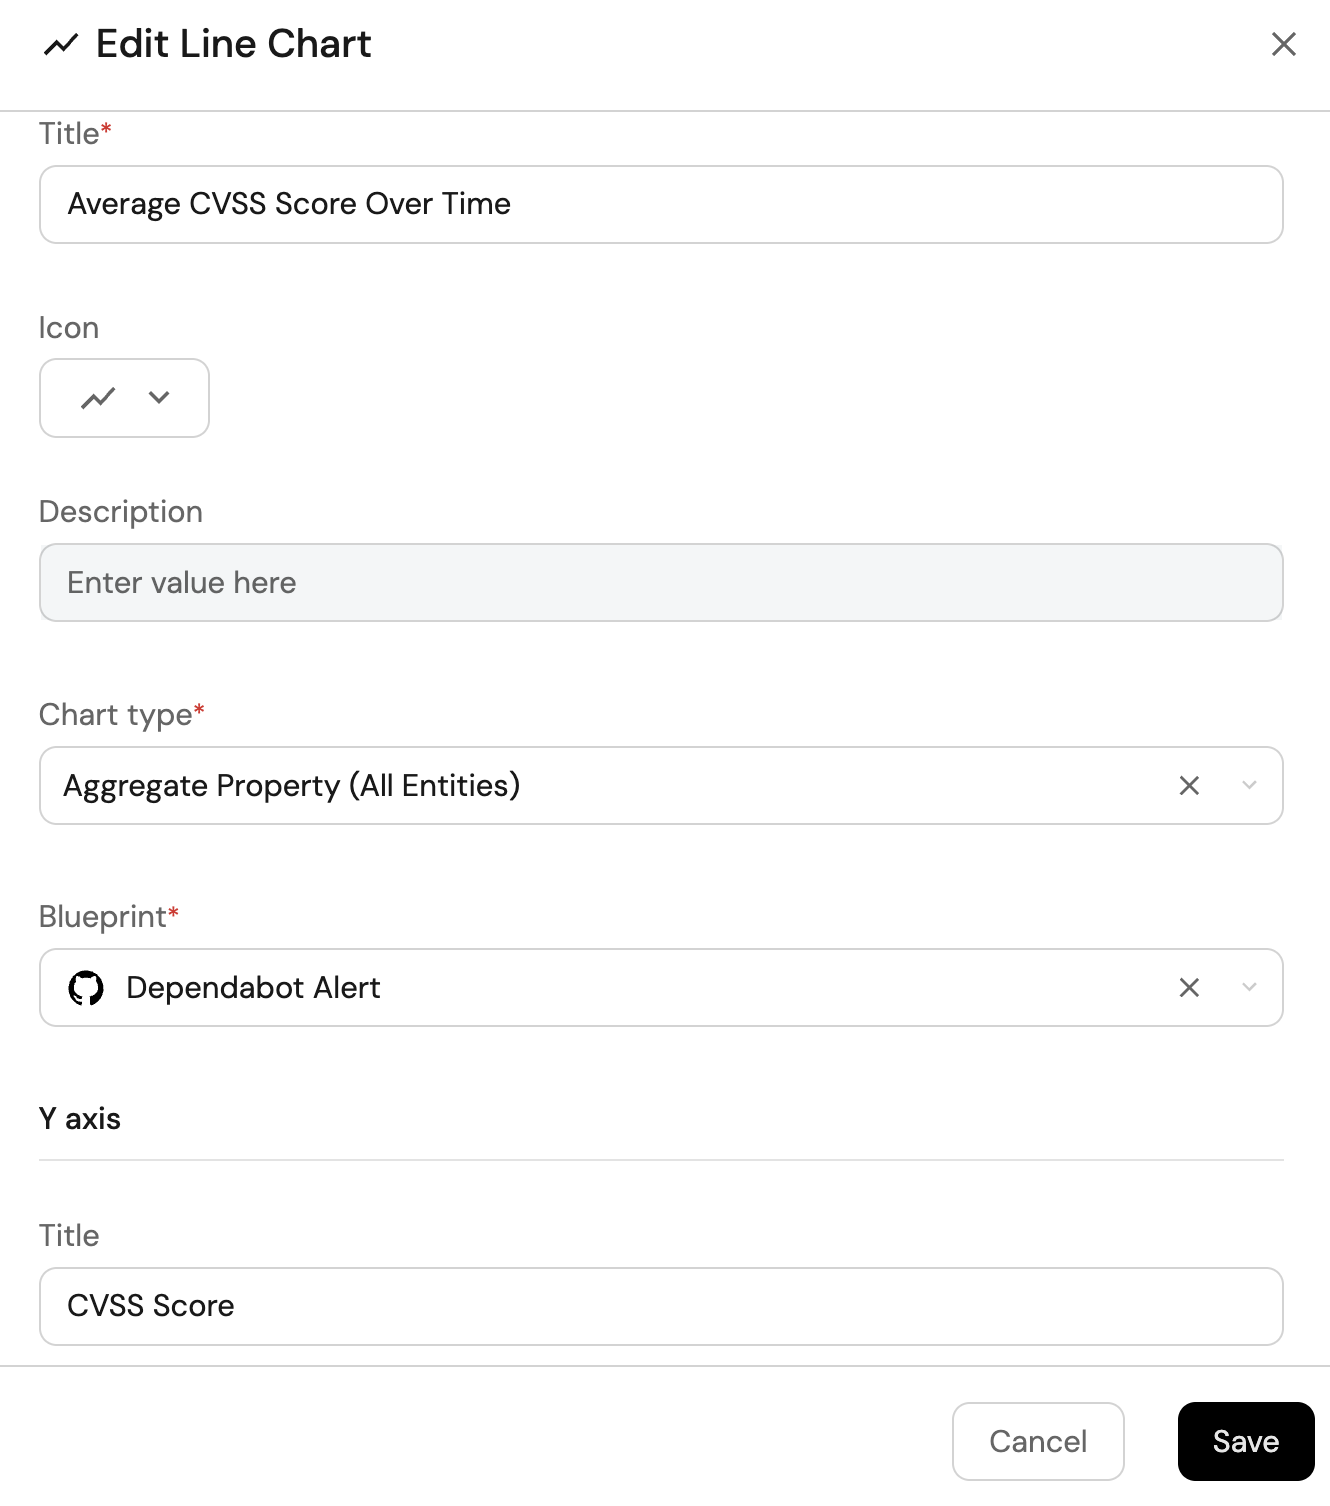
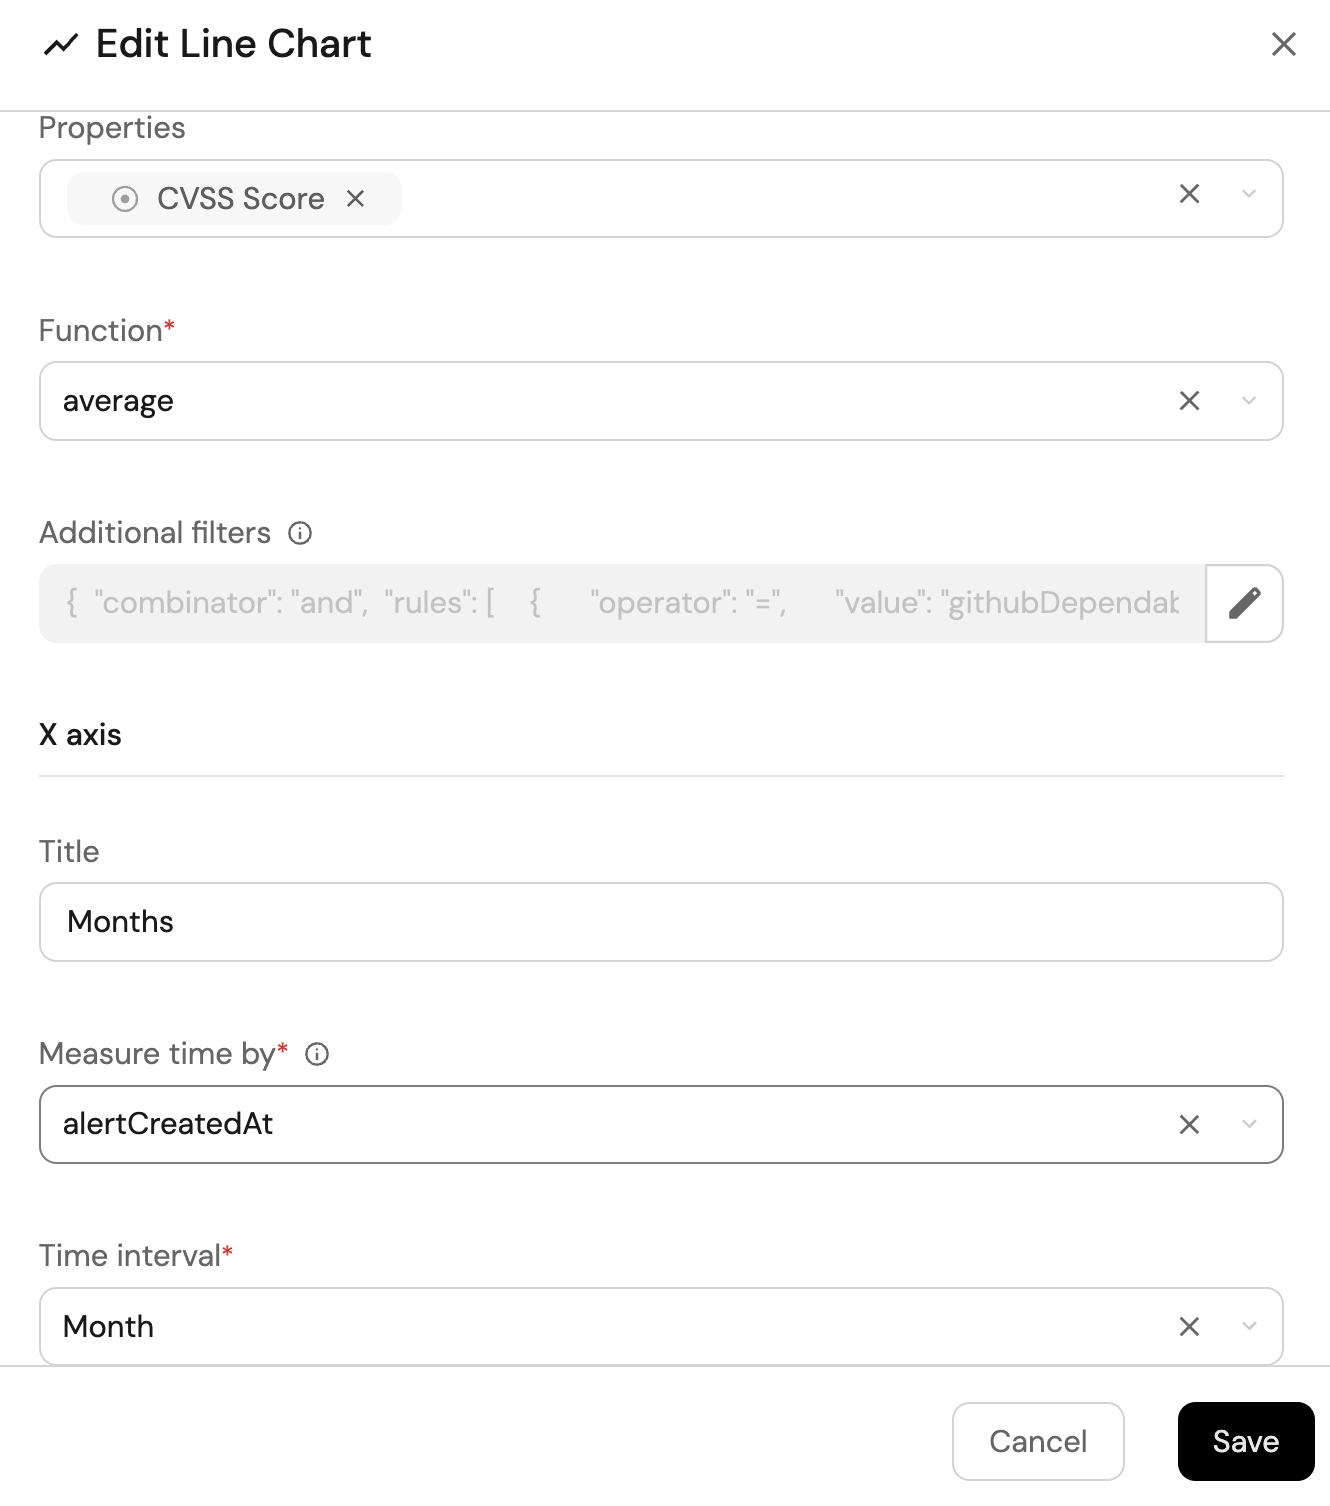
Average CVSS score over time (Click to expand)
-
Click
+ Widgetand select Line Chart. -
Title:
Average CVSS Score Over Time(add theLineCharticon). -
Set X axis:
- Title:
Months. - Time interval:
Month. - Time range:
In the past 365 days.
- Title:
-
Set Y axis title:
CVSS Score. -
Click + Line and configure:
- Title:
Average CVSS score. - Chart type:
Aggregate by property. - Blueprint:
Dependabot Alert. - Property:
CVSS Score. - Function:
Average. - Measure time by:
alertCreatedAt.
- Title:
-
Click Save.
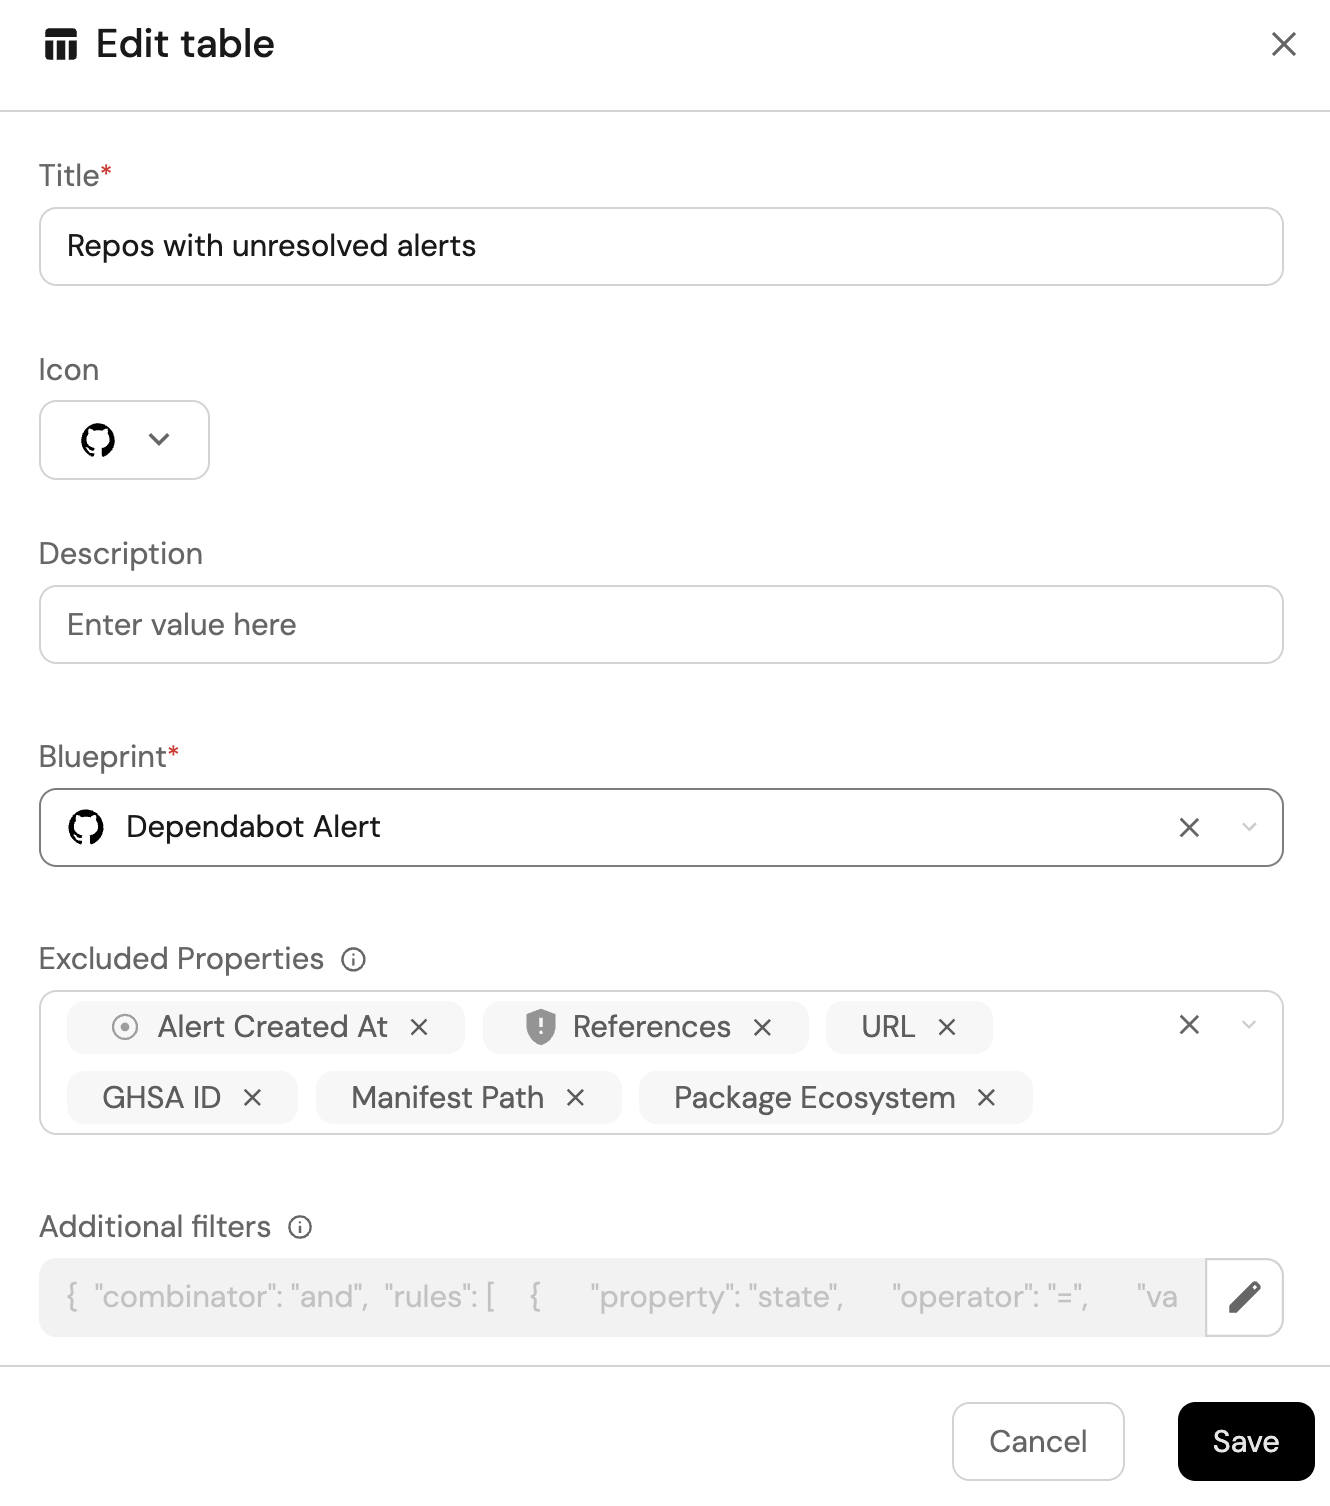
Repos with unresolved critical alerts (Click to expand)
-
Click
+ Widgetand select Table. -
Title the widget Repos with unresolved alerts.
-
Choose the Dependabot Alert blueprint.
-
Click Save to add the widget to the dashboard.
-
Click on the
...button in the top right corner of the table and select Customize table. -
In the top right corner of the table, click on Manage Properties and add the following properties:
- Repository: The name of each related repository.
- Package Name: The name of the package.
- CVE-ID: The ID of the vulnerability.
-
Click on Group by any Column in the top right corner and select Repository.
-
Click on the save icon in the top right corner of the widget to save the customized table.
Identity and access management
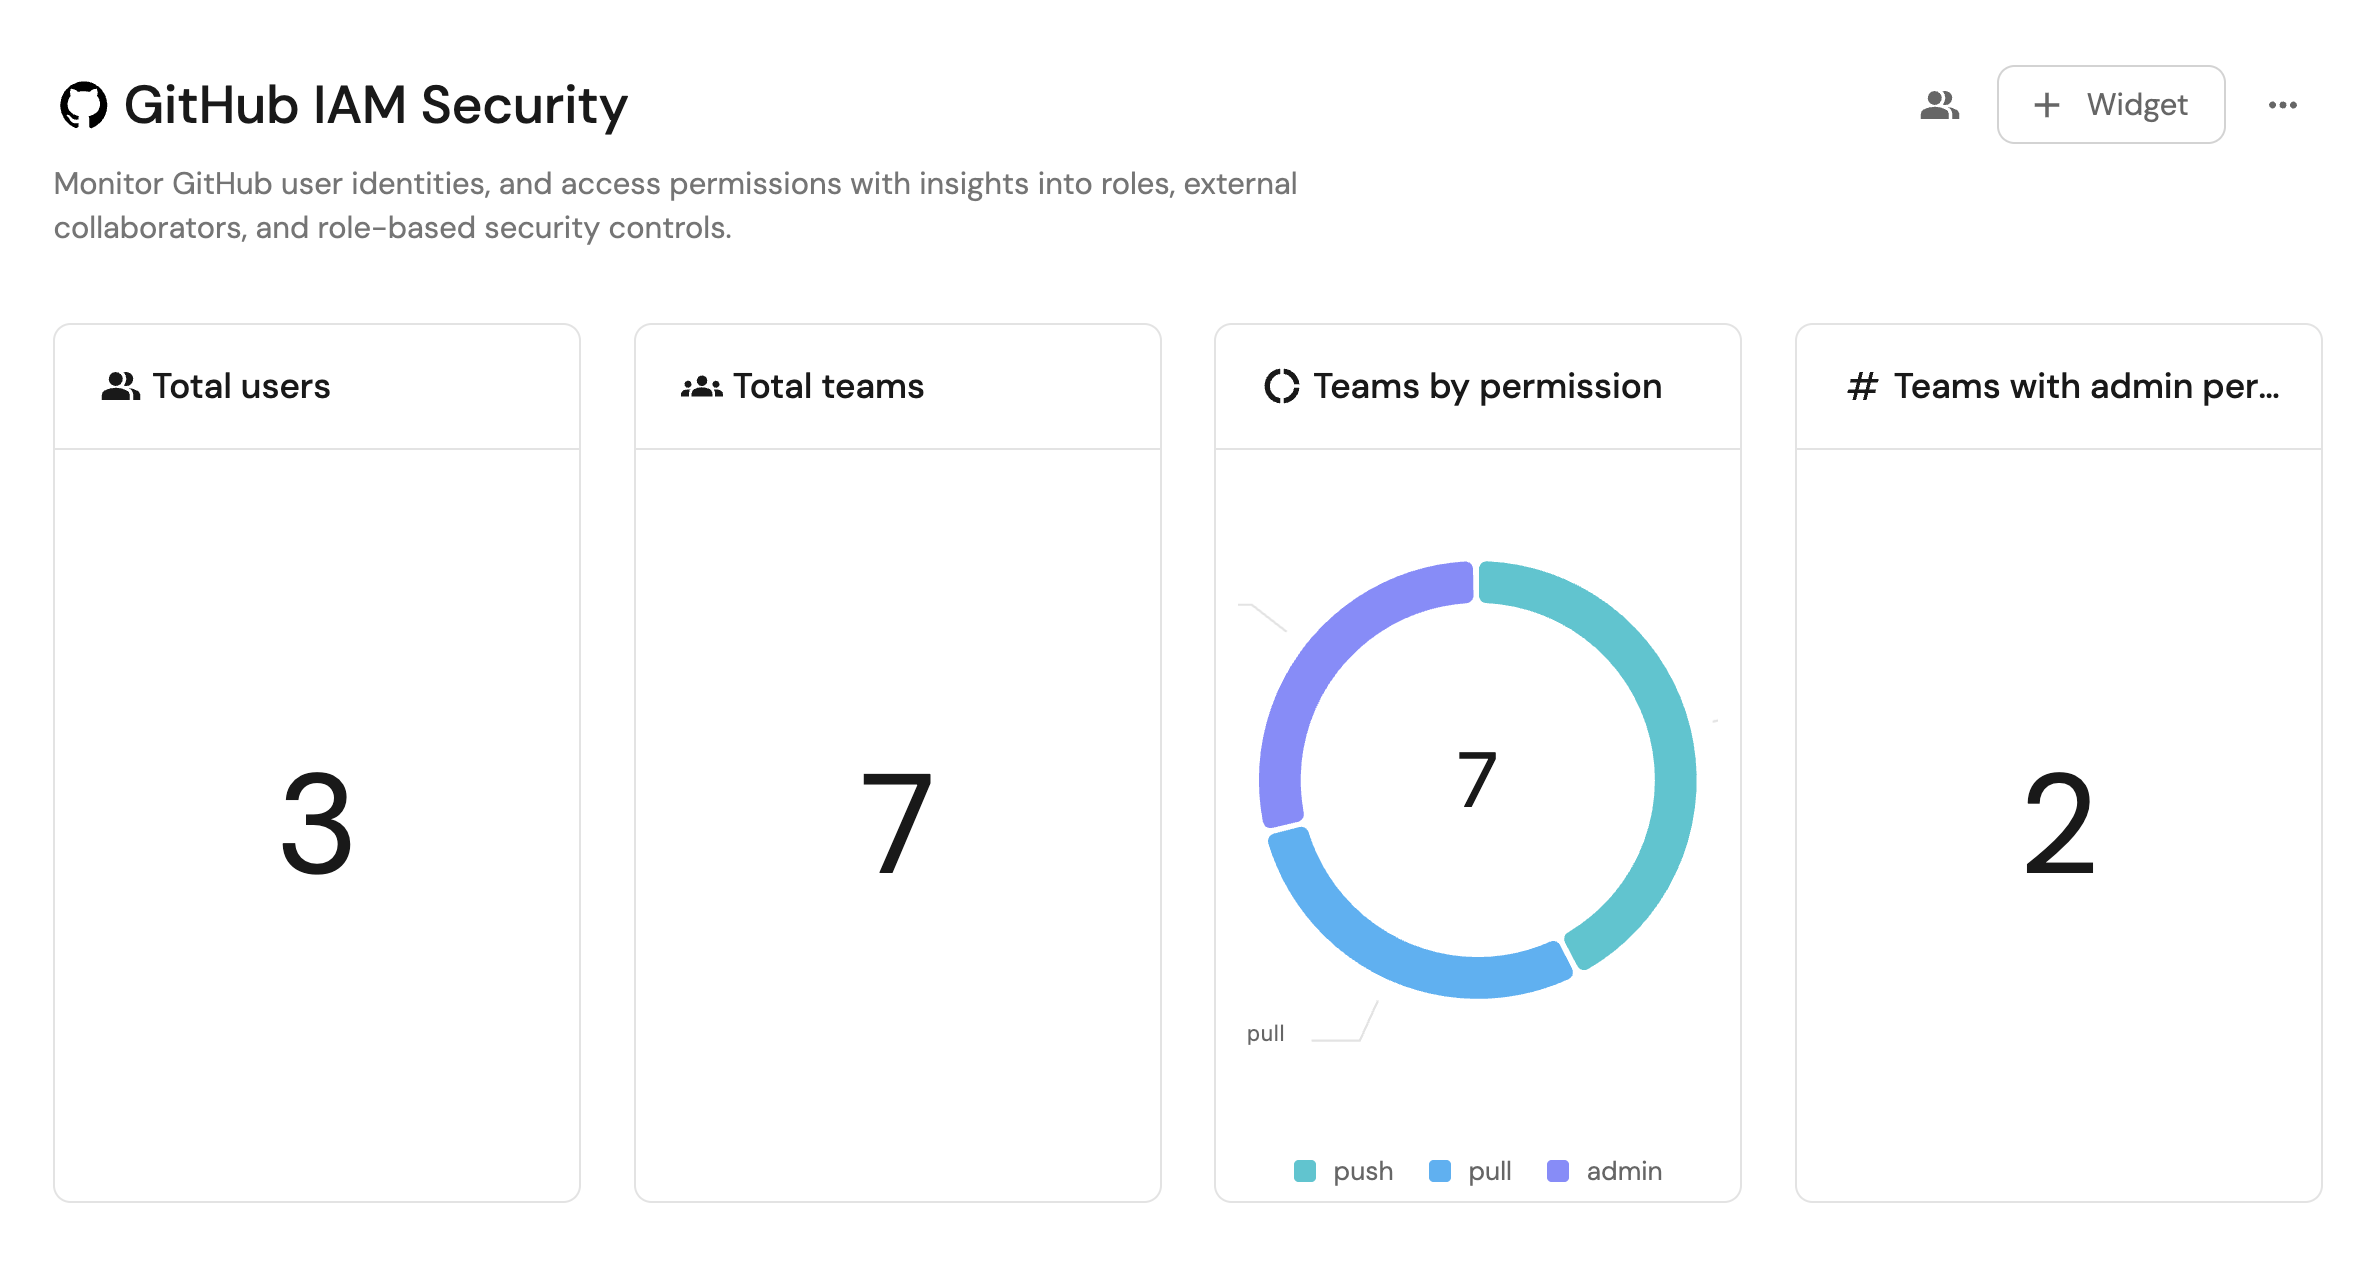
Use this section to build a dashboard for GitHub identity and access management. You will learn how to:
- Create GitHub User and GitHub Team blueprints.
- Ingest repositories, teams, and users from GitHub.
- Visualize team permissions, admin access, team count, and user count.
Set up the GitHub IAM data model
When installing the GitHub Ocean integration, the Repository blueprint is created by default.
However, the GitHub User and GitHub Team blueprints are not created automatically, so we will need to create them manually.
Create the GitHub user blueprint
Skip to the data source mapping step below if you already have the blueprint.
-
Go to the Builder page of your portal.
-
Click on + Blueprint.
-
Click on the
{...}button in the top right corner, and chooseEdit JSON. -
Add this JSON schema:
GitHub user blueprint (Click to expand)
{"identifier": "githubUser","title": "GitHub User","icon": "Microservice","schema": {"properties": {"email": {"title": "Email","type": "string"}},"required": []},"mirrorProperties": {},"calculationProperties": {},"aggregationProperties": {},"relations": {}} -
Click Save to create the blueprint.
Create the GitHub team blueprint
Skip to the data source mapping step below if you already have the blueprint.
-
Go to the Builder page of your portal.
-
Click on + Blueprint.
-
Click on the
{...}button in the top right corner, and chooseEdit JSON. -
Add this JSON schema:
GitHub team blueprint (Click to expand)
{"identifier": "githubTeam","title": "GitHub Team","icon": "Github","schema": {"properties": {"slug": {"title": "Slug","type": "string"},"description": {"title": "Description","type": "string"},"link": {"title": "Link","icon": "Link","type": "string","format": "url"},"permission": {"title": "Permission","type": "string"},"notification_setting": {"title": "Notification Setting","type": "string"}},"required": []},"mirrorProperties": {},"calculationProperties": {},"relations": {"members": {"title": "Members","target": "githubUser","many": true,"required": false}}} -
Click Save to create the blueprint.
Ingest GitHub users and teams
-
In your GitHub repository (or
.github-privatefor organization-wide config), add or update theport-app-config.ymlfile with the following configuration to ingest repositories, teams, and users:Port port-app-config.yml (Click to expand)
resources:- kind: repositoryselector:query: 'true'includedFiles:- README.mdport:entity:mappings:identifier: .nametitle: .nameblueprint: '"githubRepository"'properties:readme: .__includedFiles["README.md"]url: .html_urldefaultBranch: .default_branchvisibility: .visibility- kind: teamselector:query: "true"members: trueport:entity:mappings:identifier: .databaseId | tostringtitle: .nameblueprint: '"githubTeam"'properties:name: .nameslug: .slugdescription: .descriptionlink: .urlpermission: .permissionnotification_setting: .notificationSettingrelations:members: '[.members.nodes[].login]'- kind: userselector:query: "true"port:entity:mappings:identifier: .logintitle: .loginblueprint: '"githubUser"'properties:email: .email -
Commit and push the configuration. The integration will sync automatically.
Visualize GitHub IAM insights
Once the GitHub data is synced, we can create a dashboard and add widgets to monitor IAM.
Create the GitHub IAM dashboard
-
Navigate to your software catalog.
-
Click on the
+button in the left sidebar. -
Select New dashboard.
-
Name the dashboard GitHub IAM Overview.
-
Click Create.
We now have a blank dashboard where we can start adding widgets to visualize our identity and access management.
Add GitHub IAM widgets
Teams by permission (Click to expand)
-
Click
+ Widgetand select Pie chart. -
Title:
Teams by permission. -
Choose the GitHub Team blueprint.
-
Under
Breakdown by property, select the Permission property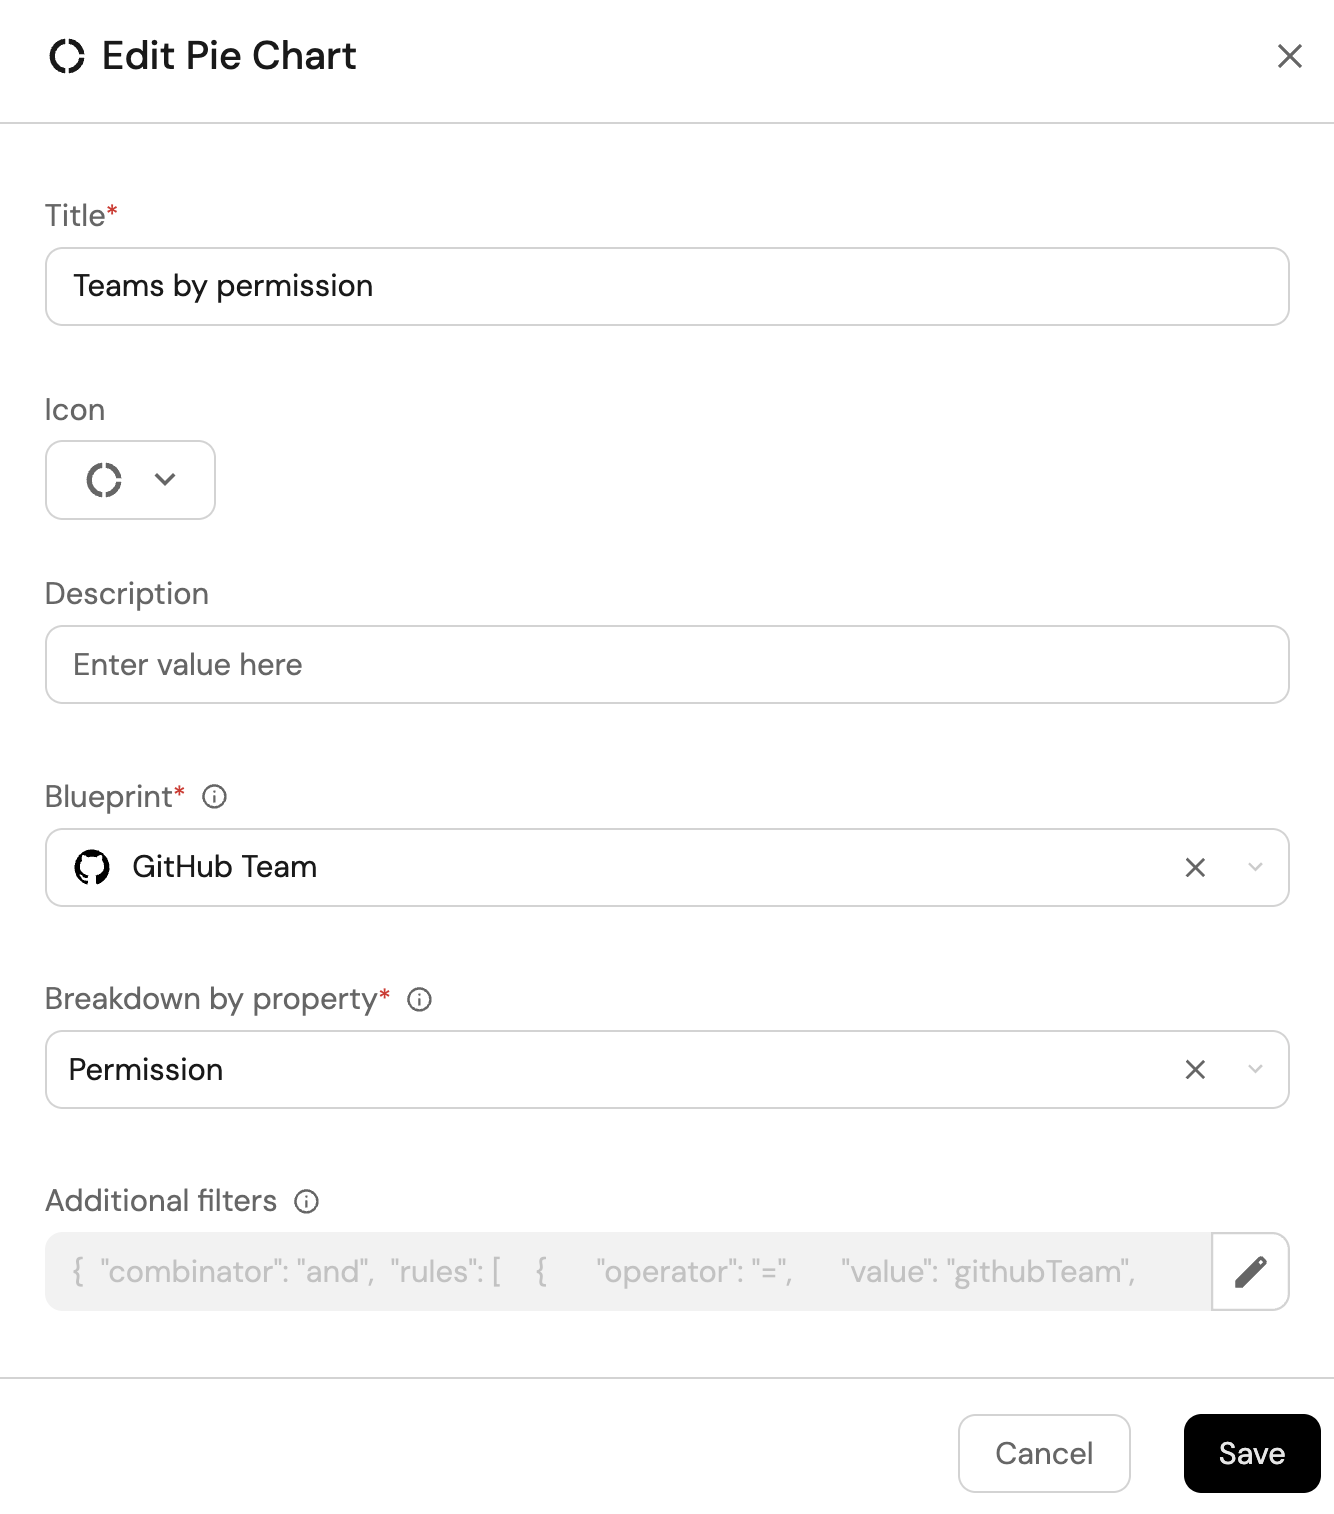
-
Click Save.
Teams with admin permission (Click to expand)
-
Click
+ Widgetand select Number Chart. -
Title:
Teams with admin permission. -
Select Count entities Chart type and choose GitHub Team as the Blueprint.
-
Select count for the Function.
-
Add this JSON to the Additional filters editor to filter
adminpermission:[{"combinator":"and","rules":[{"property":"permission","operator":"=","value":"admin"}]}] -
Select custom as the Unit and input
teamsas the Custom unit.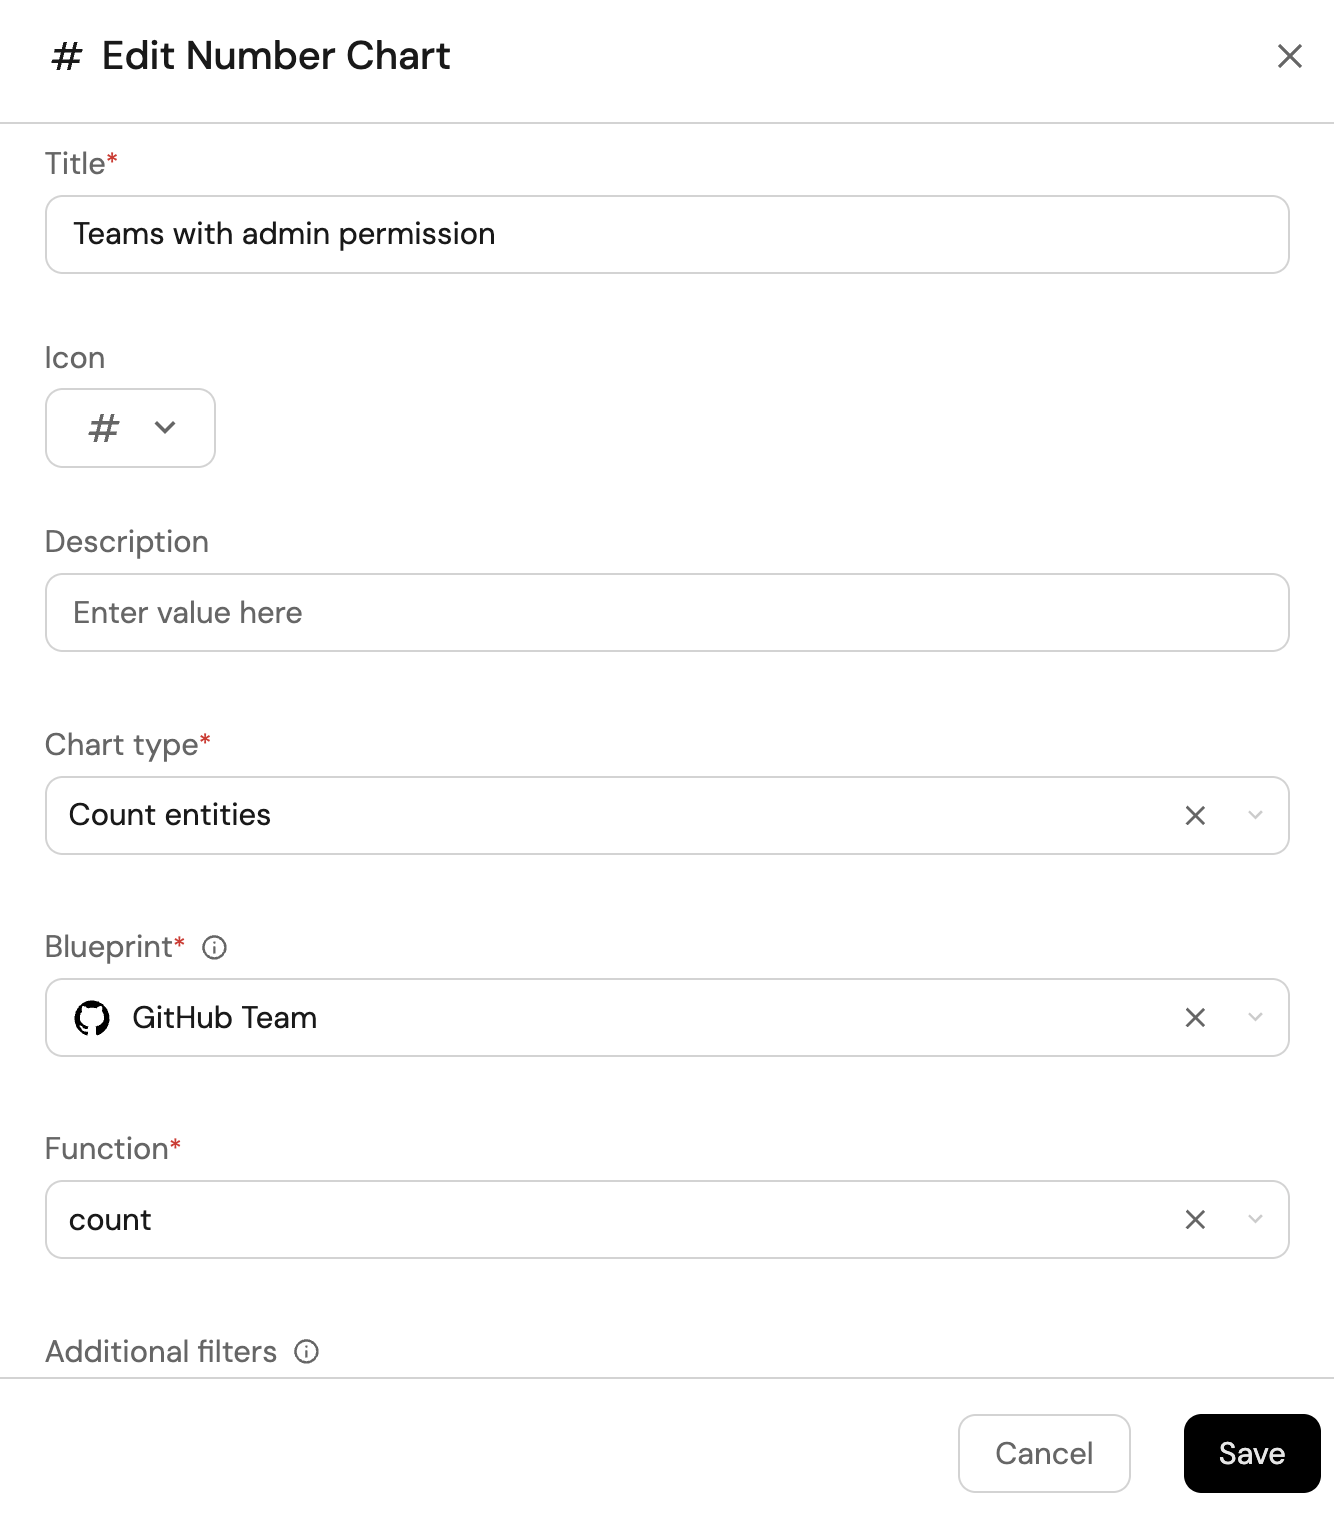
-
Click Save.
Total number of teams (Click to expand)
-
Click
+ Widgetand select Number Chart. -
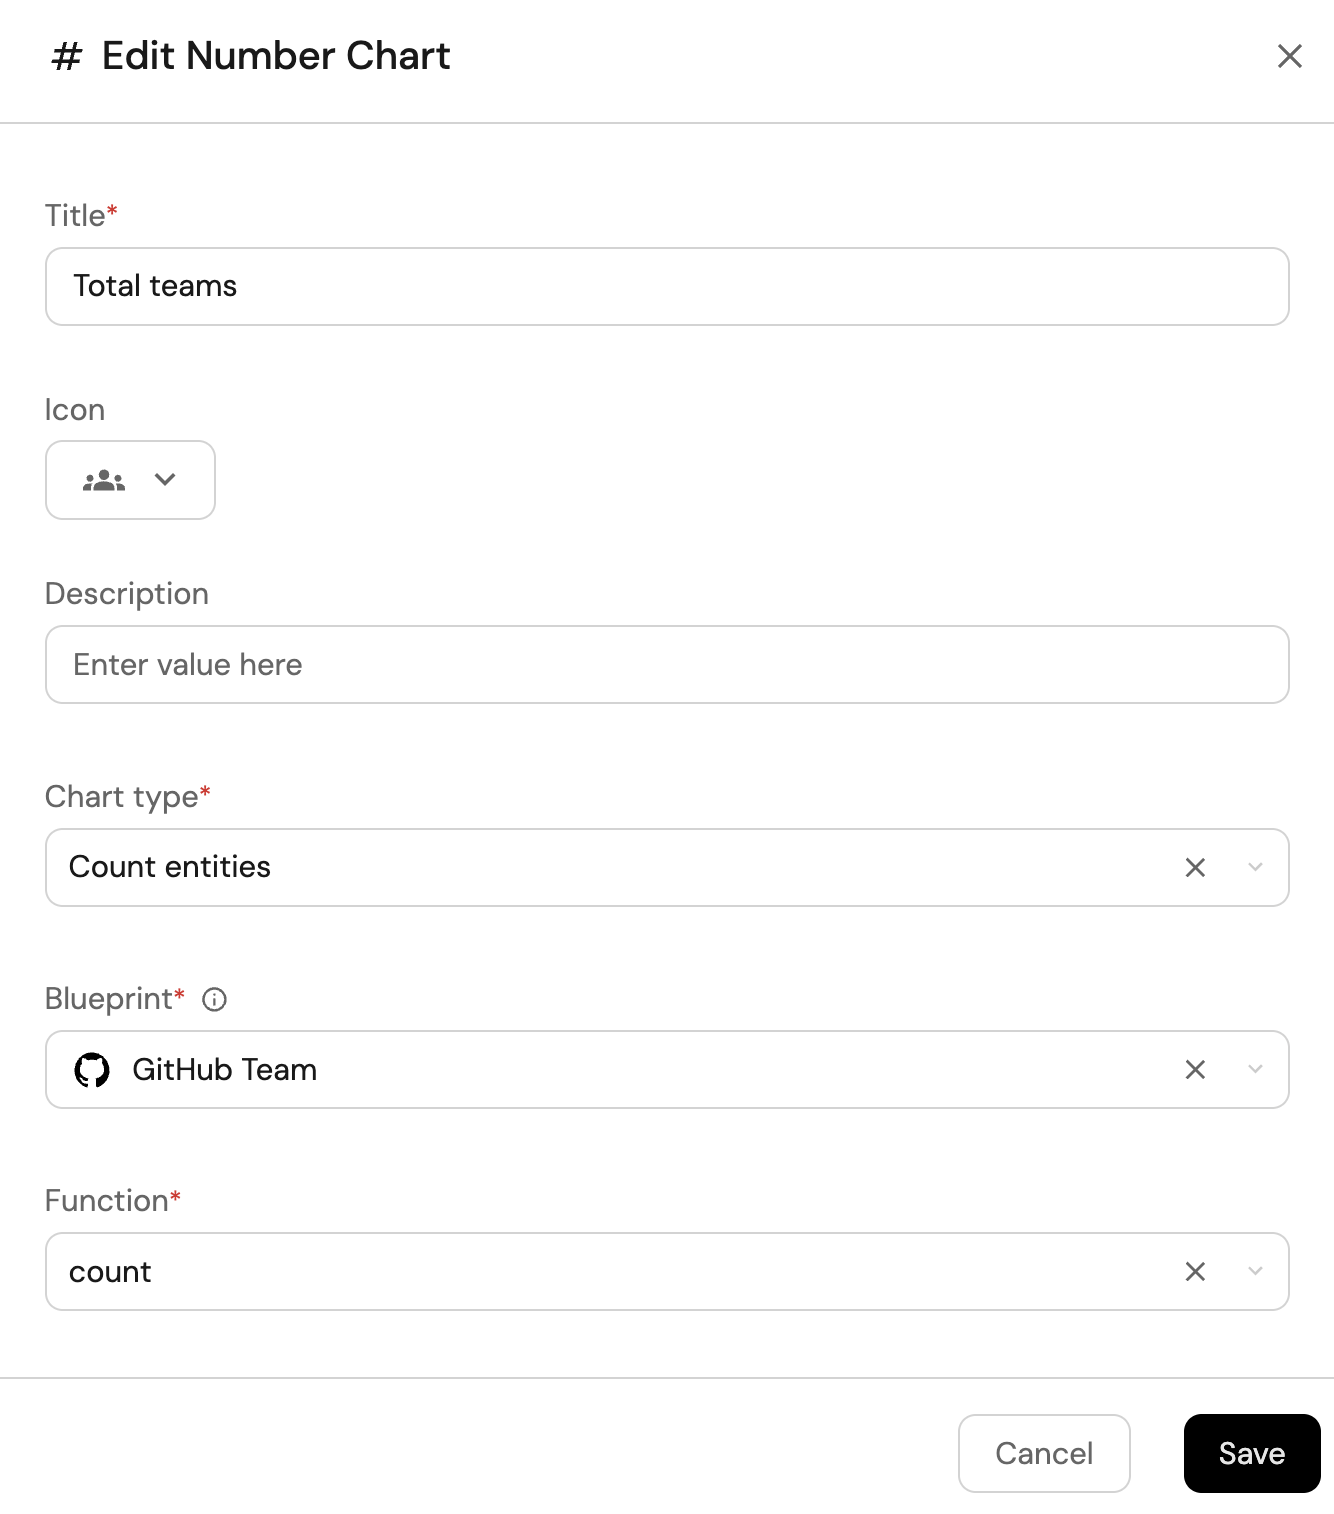
Title:
Total teams(add theTeamicon). -
Select Count entities Chart type and choose GitHub Team as the Blueprint.
-
Select count for the Function.
-
Click Save.
Total number of users (Click to expand)
-
Click
+ Widgetand select Number Chart. -
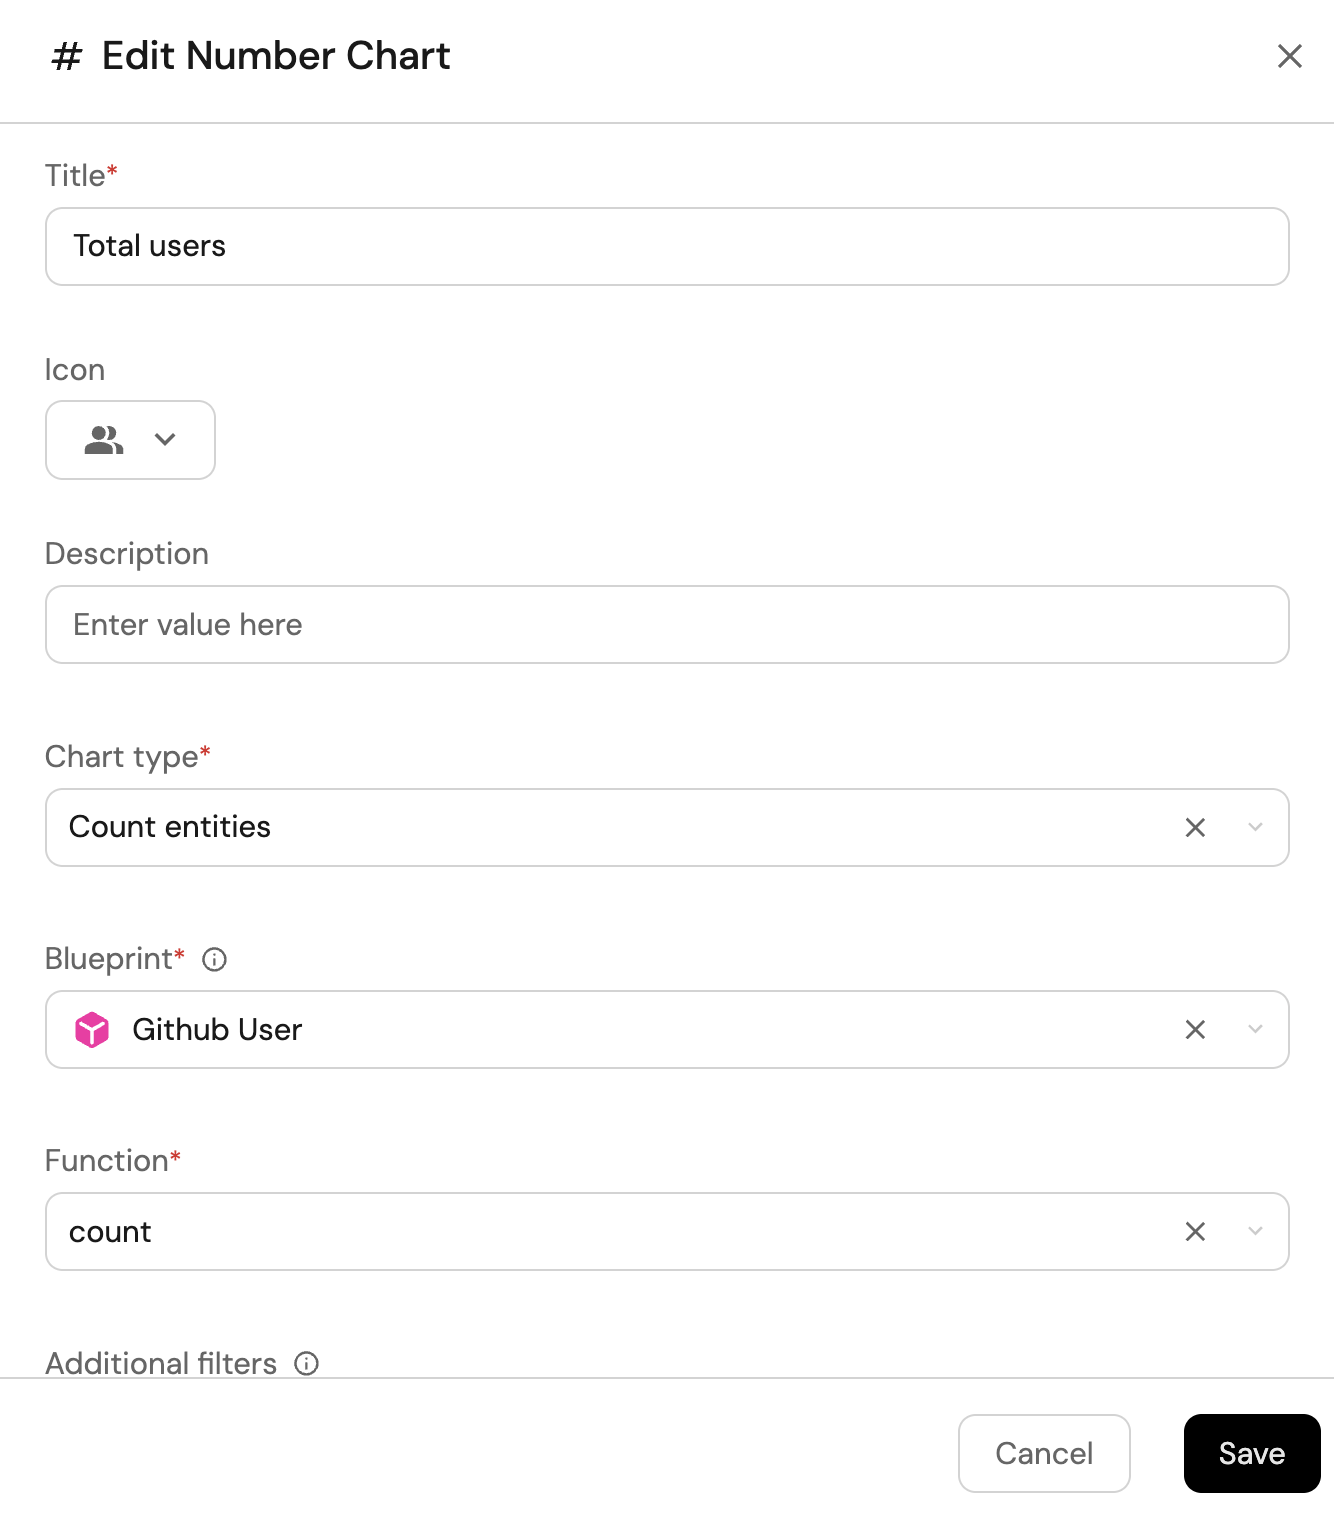
Title:
Total users(add theTeamicon). -
Select Count entities Chart type and choose GitHub User as the Blueprint.
-
Select count for the Function.
-
Click Save.
Repository and developer activity
Use this section to build a dashboard for repository visibility, pull requests, issues, and developer activity. You will learn how to:
- Extend the Repository blueprint with visibility data.
- Create an Issue blueprint.
- Ingest repositories, pull requests, and issues from GitHub.
- Visualize repository visibility, PRs, merged PRs, and open issues.
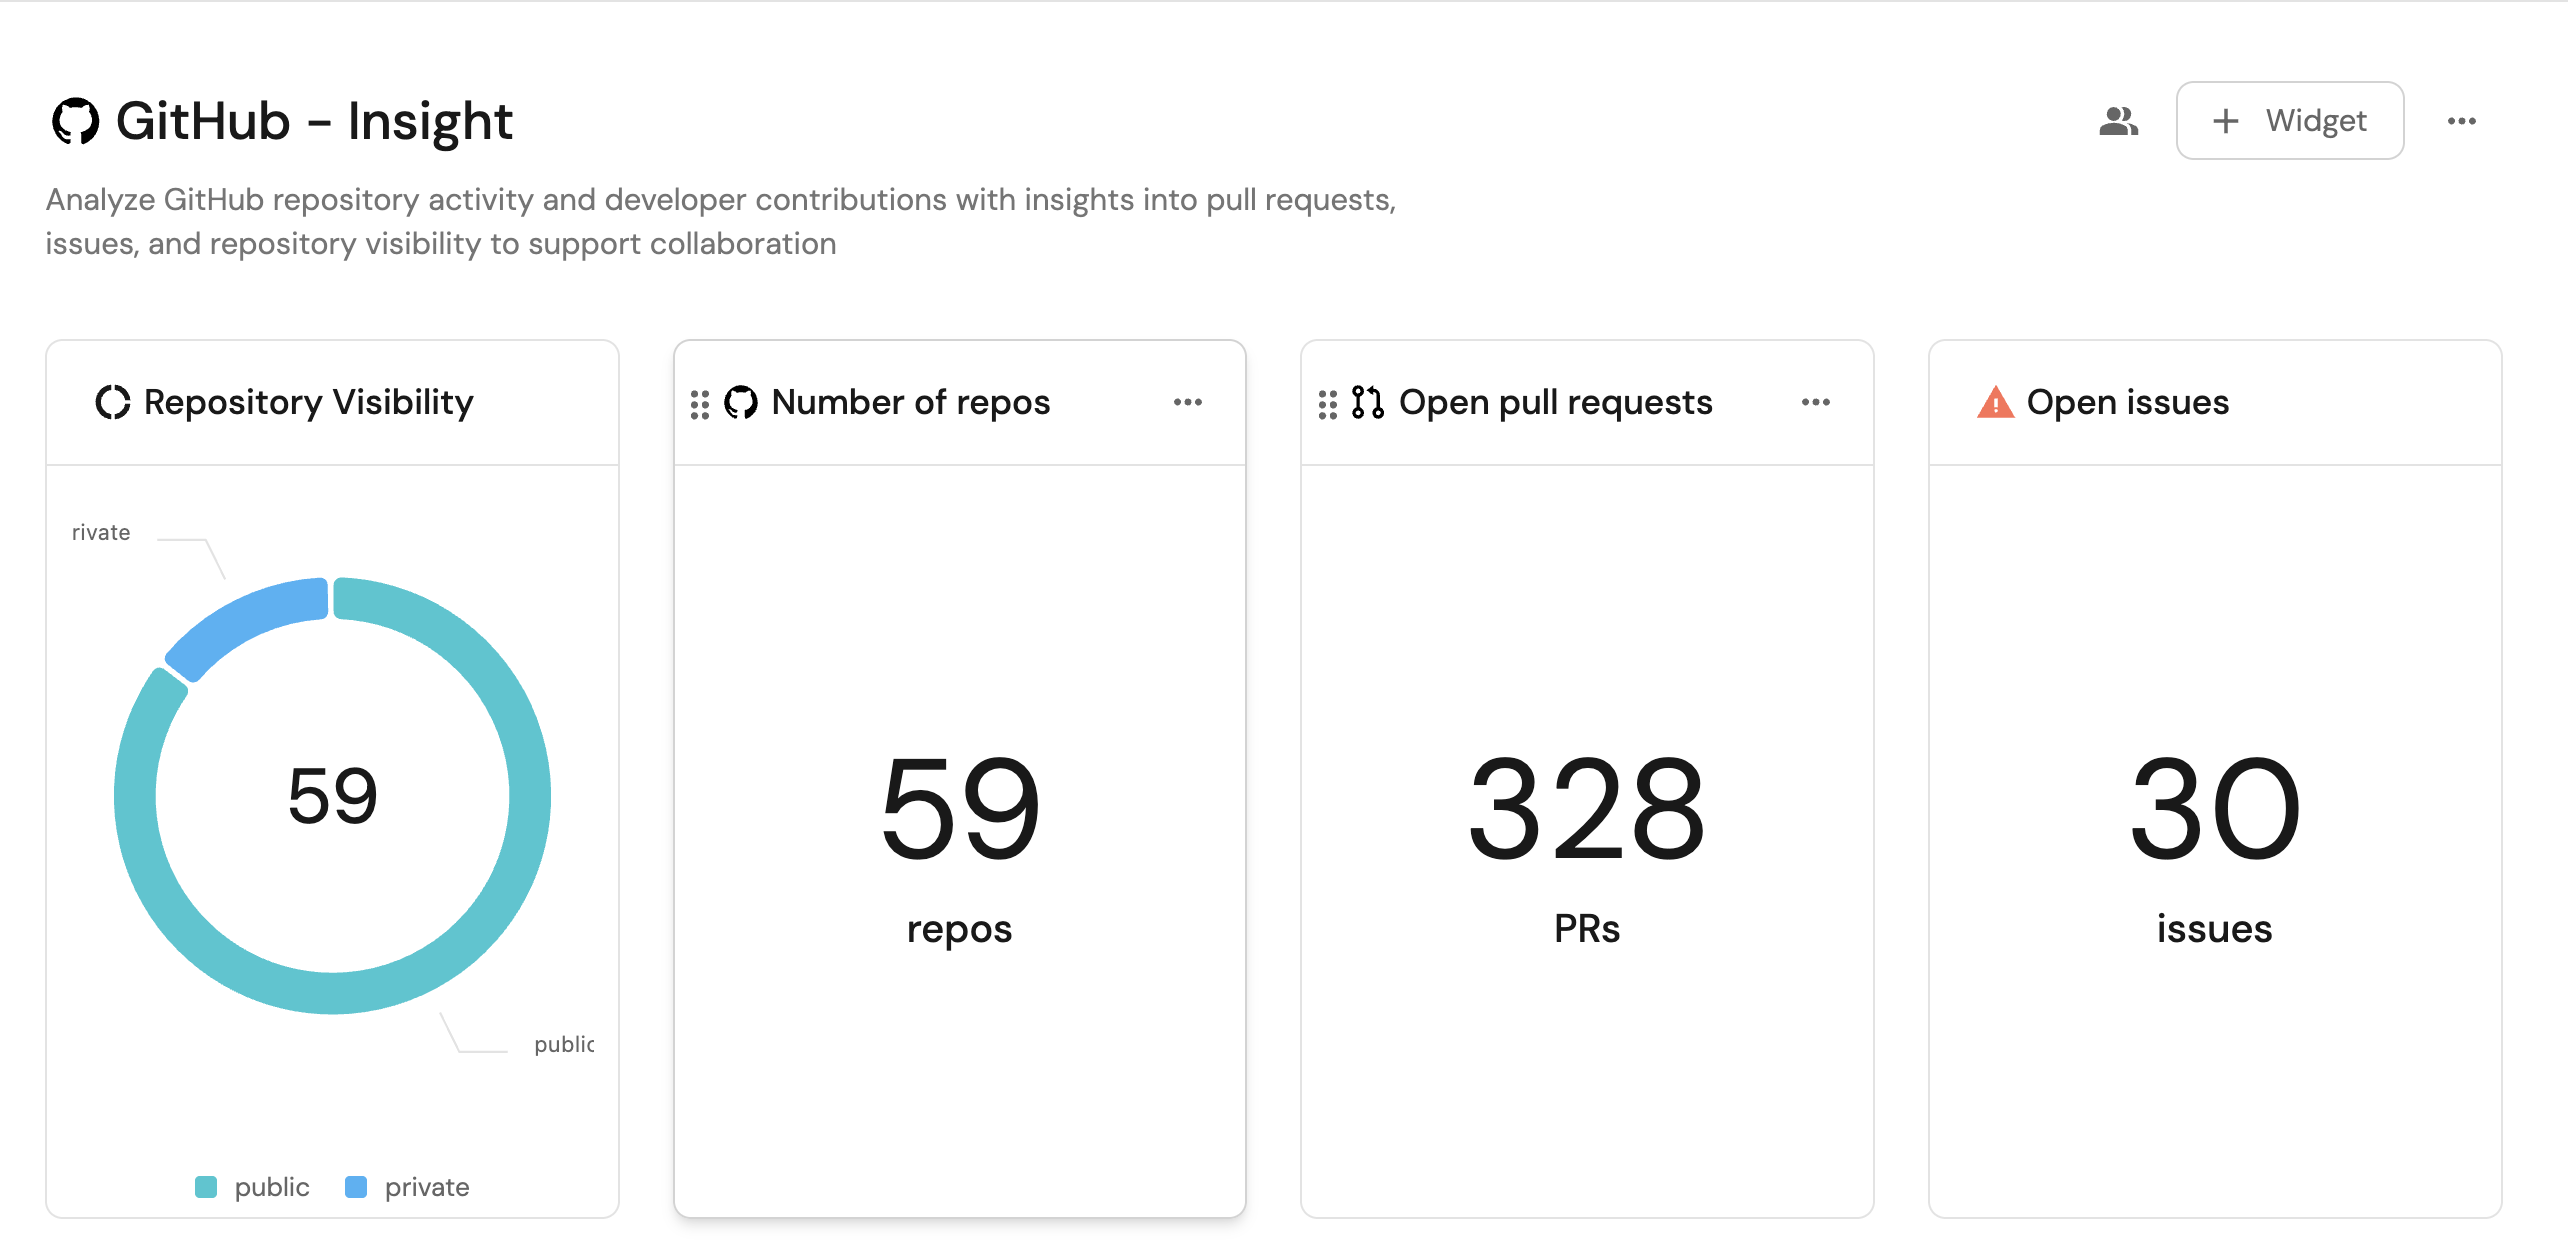
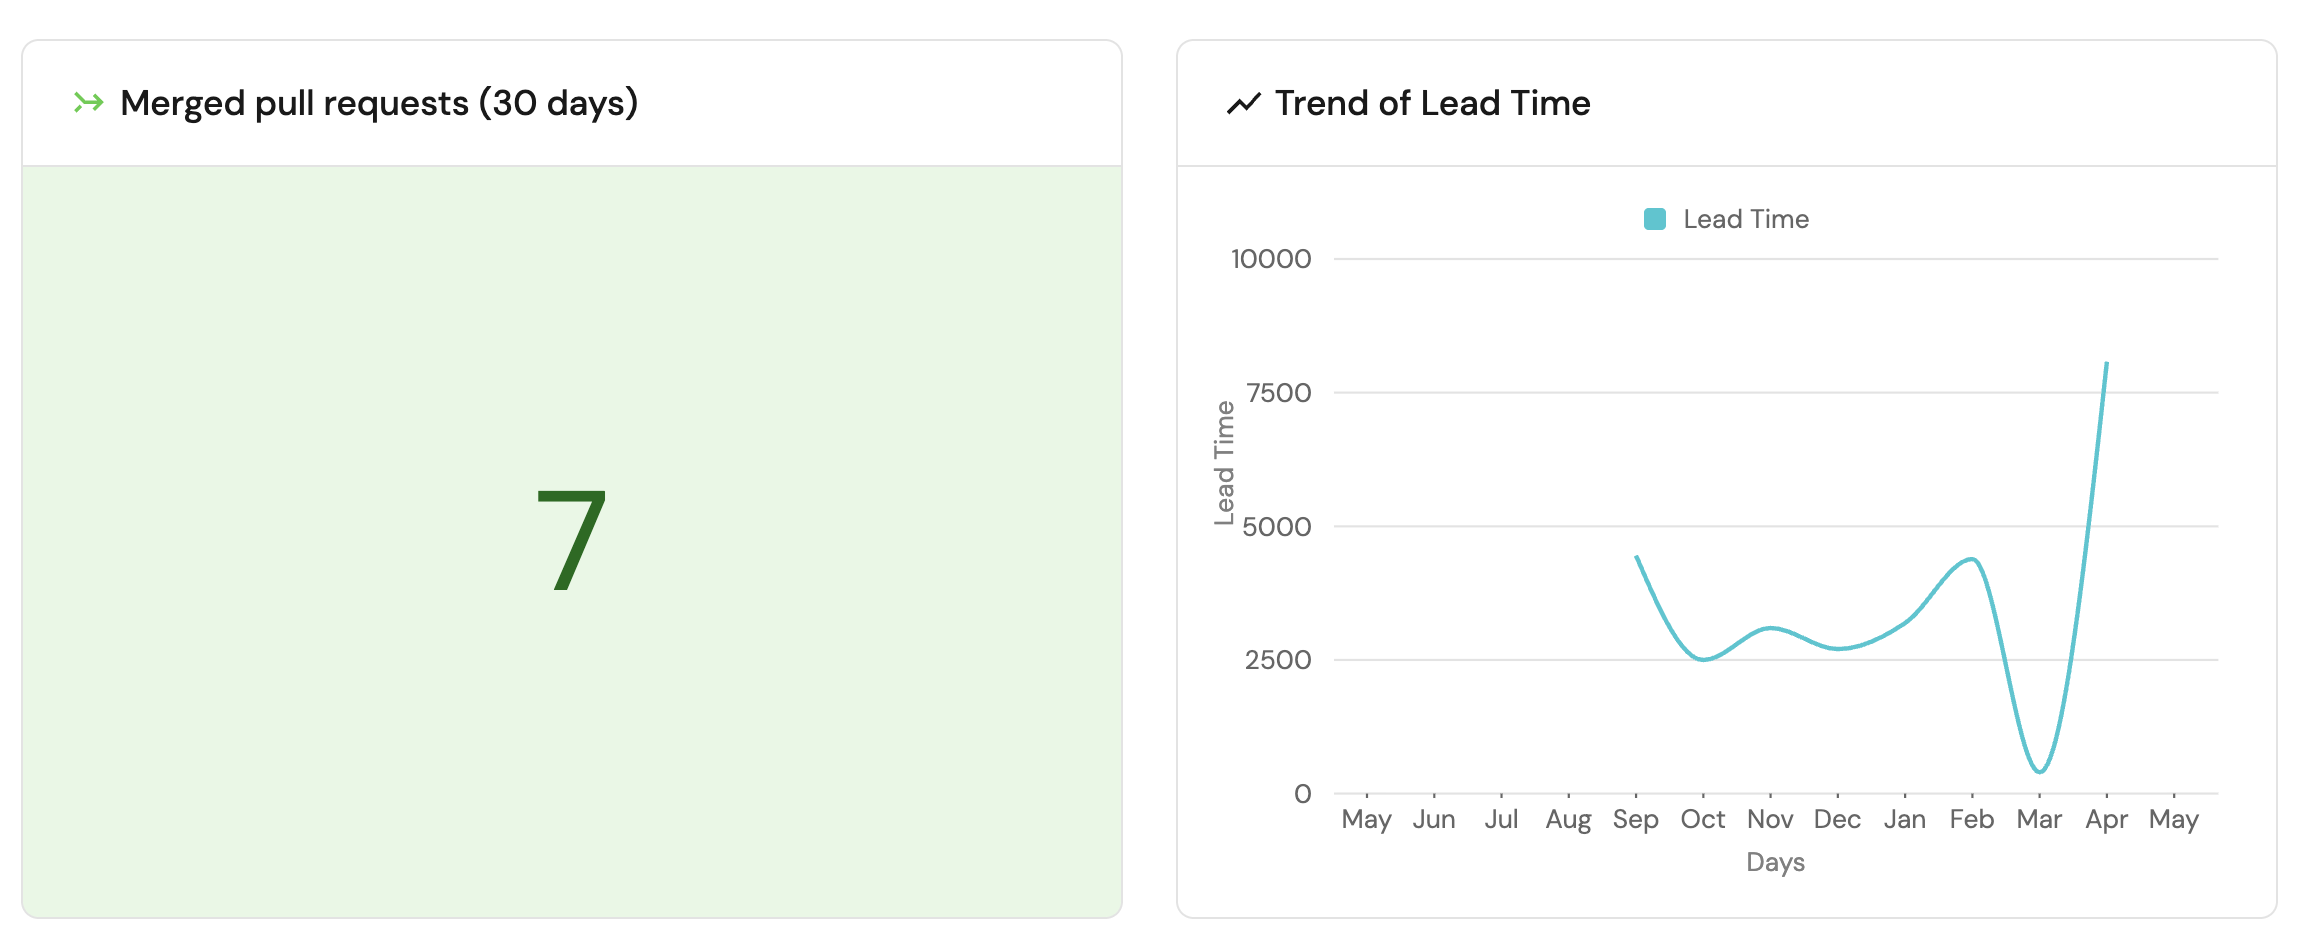
Set up the repository activity data model
When installing the GitHub integration, the Repository and Pull Request blueprints are created by default. The Issue blueprint is not created automatically, so we will need to create it manually.
Additionally, we will update the Repository blueprint to include a visibility property, which is not part of the default schema.
Update the Repository blueprint with visibility
Follow the steps below to update theRepository blueprint:
-
Navigate to the
Repositoryblueprint in your Port Builder. -
Hover over it, click on the
...button on the right, and selectEdit JSON. -
Add the visibility property:
Visibility property (Click to expand)
"visibility": {"type": "string","title": "Visibility"} -
Click Save.
Create the GitHub issue blueprint
We will then create the Issue blueprint.
Skip to the data source mapping step below if you already have the blueprint.
-
Go to your Builder page.
-
Click on + Blueprint.
-
Click on the
{...}button in the top right corner, and chooseEdit JSON. -
Add this JSON schema:
GitHub issue blueprint (Click to expand)
{"identifier": "githubIssue","title": "Issue","icon": "Github","schema": {"properties": {"creator": {"title": "Creator","type": "string"},"assignees": {"title": "Assignees","type": "array"},"labels": {"title": "Labels","type": "array"},"status": {"title": "Status","type": "string","enum": ["open", "closed"],"enumColors": {"open": "green","closed": "purple"}},"createdAt": {"title": "Created At","type": "string","format": "date-time"},"closedAt": {"title": "Closed At","type": "string","format": "date-time"},"updatedAt": {"title": "Updated At","type": "string","format": "date-time"},"description": {"title": "Description","type": "string","format": "markdown"},"issueNumber": {"title": "Issue Number","type": "number"},"link": {"title": "Link","type": "string","format": "url"}},"required": []},"mirrorProperties": {},"calculationProperties": {},"relations": {"repository": {"target": "githubRepository","required": true,"many": false}}} -
Click Save to create the blueprint.
Ingest repositories, pull requests, and issues
-
Go to your Data Source page.
-
Select the GitHub integration relevant to you.
-
Add the following YAML block into the editor to ingest data from GitHub:
GitHub Ocean integration configuration (Click to expand)
resources:- kind: repositoryselector:query: "true"includedFiles:- README.mdport:entity:mappings:identifier: .nametitle: .nameblueprint: '"githubRepository"'properties:description: if .description then .description else "" endvisibility: if .private then "private" else "public" endlanguage: if .language then .language else "" endreadme: .__includedFiles["README.md"]url: .html_urldefaultBranch: .default_branchrelations:organization: .owner.login- kind: pull-requestselector:query: "true"states: ["open", "closed"]port:entity:mappings:identifier: .__repository + (.id|tostring)title: .titleblueprint: '"githubPullRequest"'properties:creator: .user.loginassignees: '[.assignees[].login]'reviewers: '[.requested_reviewers[].login]'status: .stateclosedAt: .closed_atupdatedAt: .updated_atmergedAt: .merged_atcreatedAt: .created_atprNumber: .idlink: .html_urlleadTimeHours: >-(.created_at as $createdAt | .merged_at as $mergedAt | ($createdAt| sub("\\..*Z$"; "Z") | strptime("%Y-%m-%dT%H:%M:%SZ") | mktime)as $createdTimestamp | ($mergedAt | if . == null then null elsesub("\\..*Z$"; "Z") | strptime("%Y-%m-%dT%H:%M:%SZ") | mktime end)as $mergedTimestamp | if $mergedTimestamp == null then null else(((($mergedTimestamp - $createdTimestamp) / 3600) * 100 | floor) /100) end)relations:repository: .__repository- kind: issueselector:query: .pull_request == nullstate: "open"port:entity:mappings:identifier: .__repository + (.id|tostring)title: .titleblueprint: '"githubIssue"'properties:creator: .user.loginassignees: '[.assignees[].login]'labels: '[.labels[].name]'status: .statecreatedAt: .created_atclosedAt: .closed_atupdatedAt: .updated_atdescription: .bodyissueNumber: .numberlink: .html_urlrelations:repository: .__repository
GitHub (Ocean) provides additional repository properties (description, visibility, language) and an organization relation. For pull requests, use states: ["open", "closed"] selector, .__repository for the repository relation, and .state for the status property mapping. For issues, use .__repository for the repository relation. File content is accessed via .__includedFiles["filename"] instead of the file:// prefix.
- Click Save & Resync to apply the mapping.
Visualize repository and developer activity
Once the GitHub data is synced, we can create a dashboard and add widgets to monitor repository visibility and developer activity.
Create the repository activity dashboard
-
Navigate to your software catalog.
-
Click on the
+button in the left sidebar. -
Select New dashboard.
-
Name the dashboard GitHub - Insight.
-
Click Create.
We now have a blank dashboard where we can start adding widgets to visualize our developer activities.
Add repository activity widgets
Repository visibility (Click to expand)
-
Click
+ Widgetand select Pie chart. -
Title:
Repository Visibility. -
Choose the Repository blueprint.
-
Under
Breakdown by property, select the Visibility property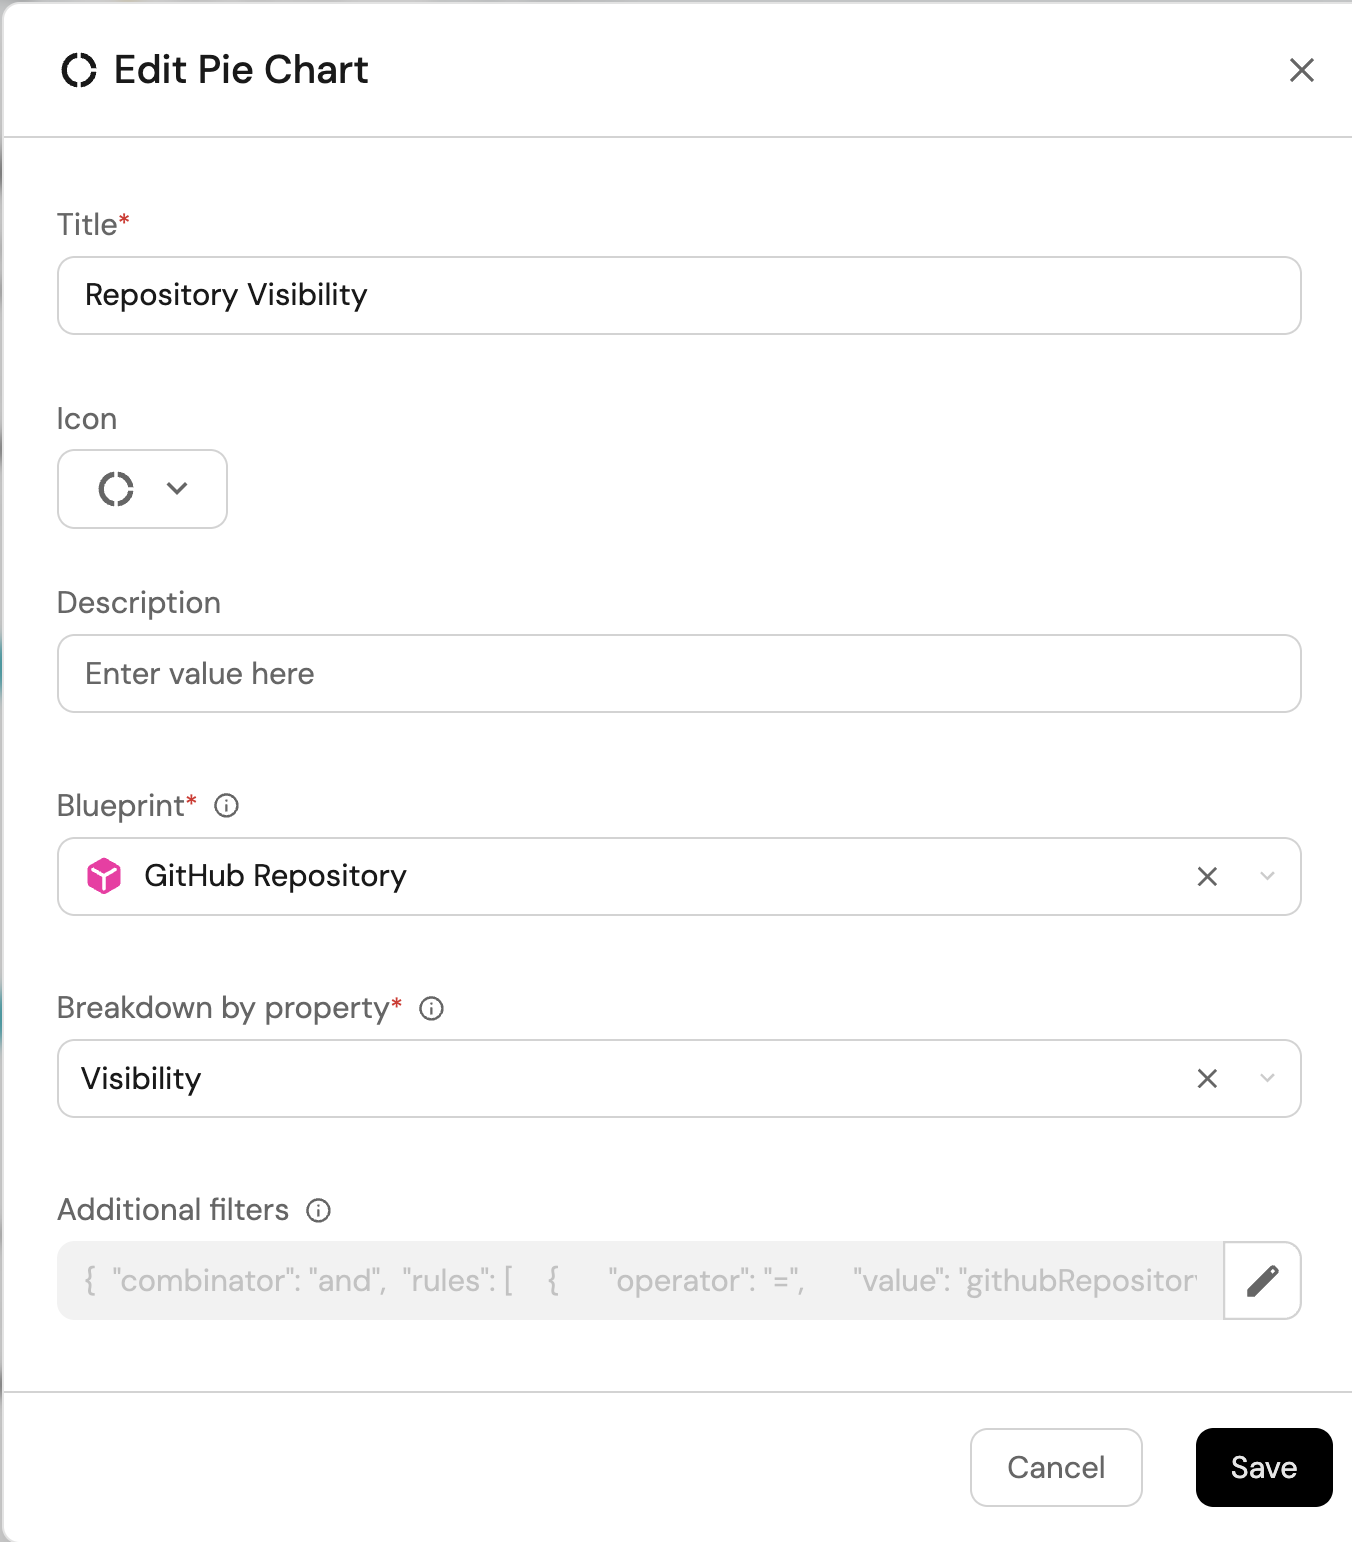
-
Click Save.
Total number of repositories (Click to expand)
-
Click
+ Widgetand select Number Chart. -
Title:
Number of repos. -
Select Count entities Chart type and choose Repository as the Blueprint.
-
Select count for the Function.
-
Select custom as the Unit and input
reposas the Custom unit.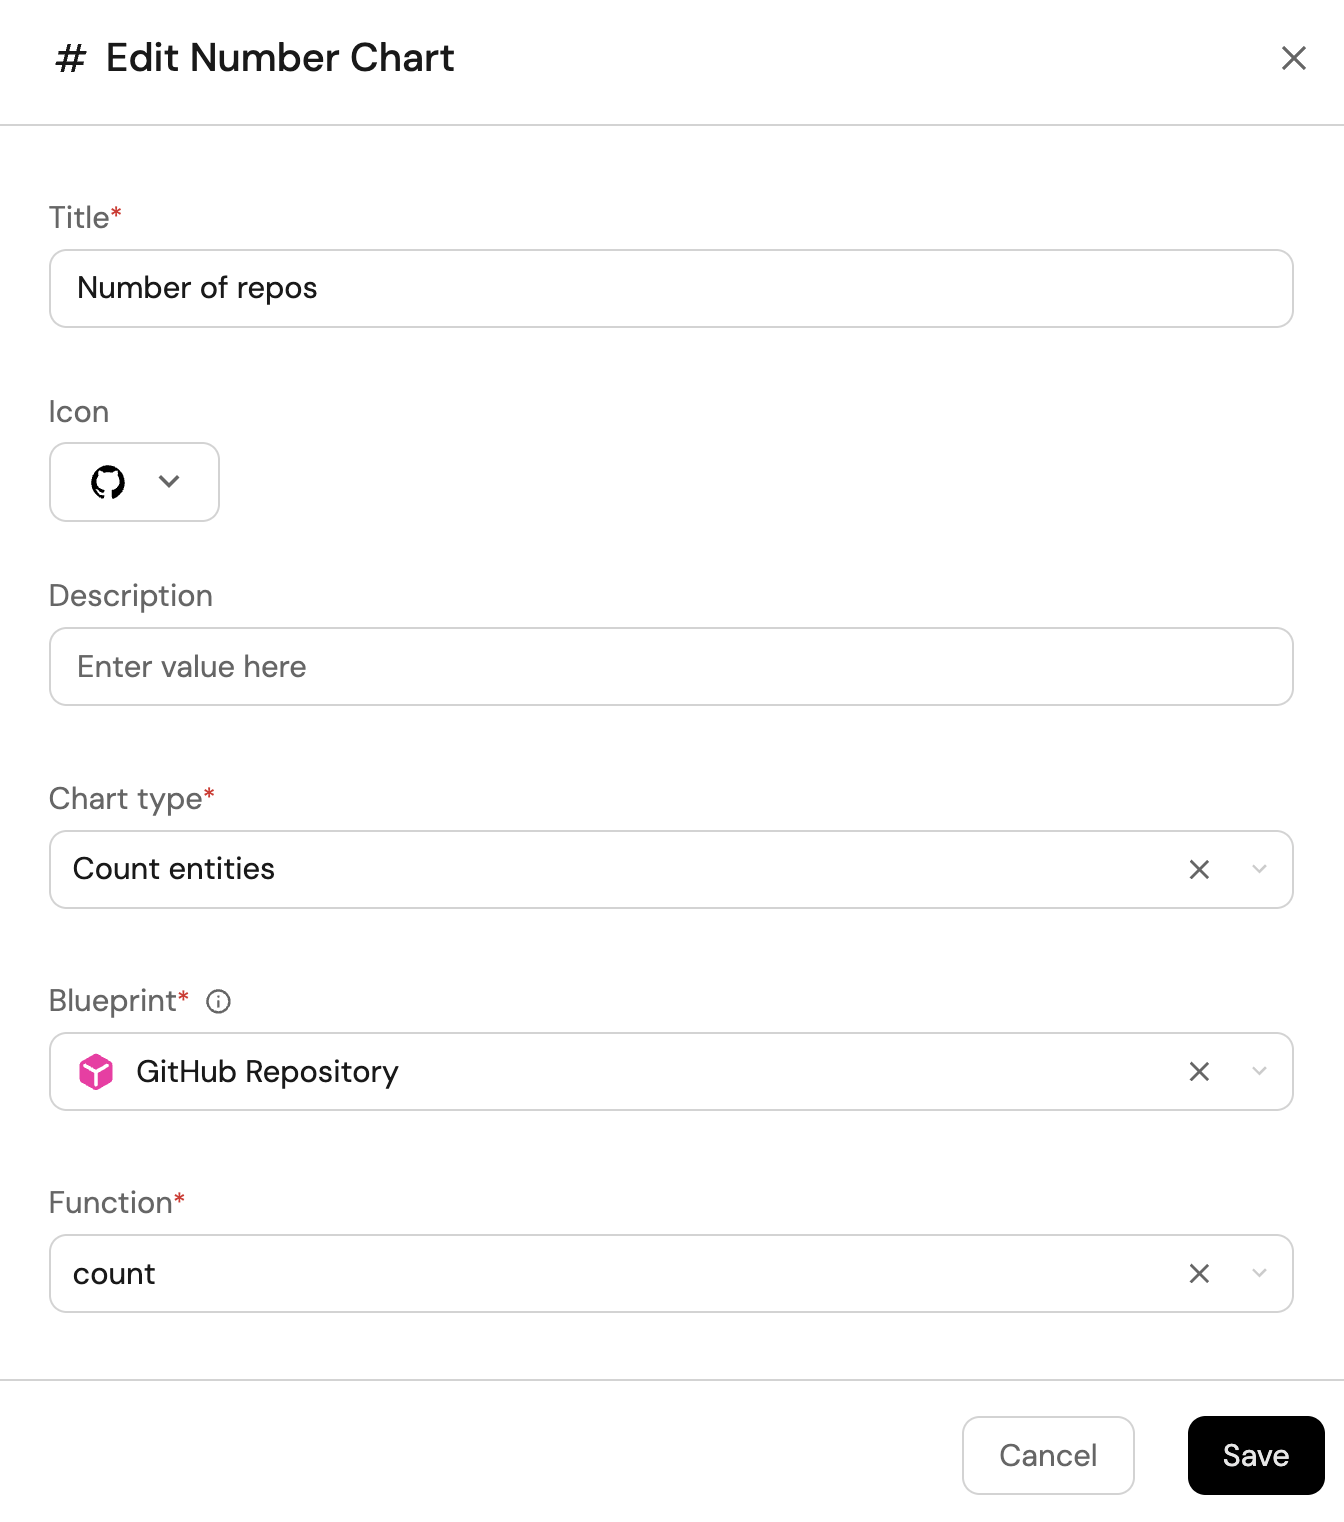
-
Click Save.
Total number of public repositories (Click to expand)
-
Click
+ Widgetand select Number Chart. -
Title:
Public repos(add theUrlicon). -
Select Count entities Chart type and choose Repository as the Blueprint.
-
Select count for the Function.
-
Add this JSON to the Additional filters editor to filter
publicrepositories:[{"combinator":"and","rules":[{"property":"visibility","operator":"=","value":"public"}]}] -
Select custom as the Unit and input
reposas the Custom unit.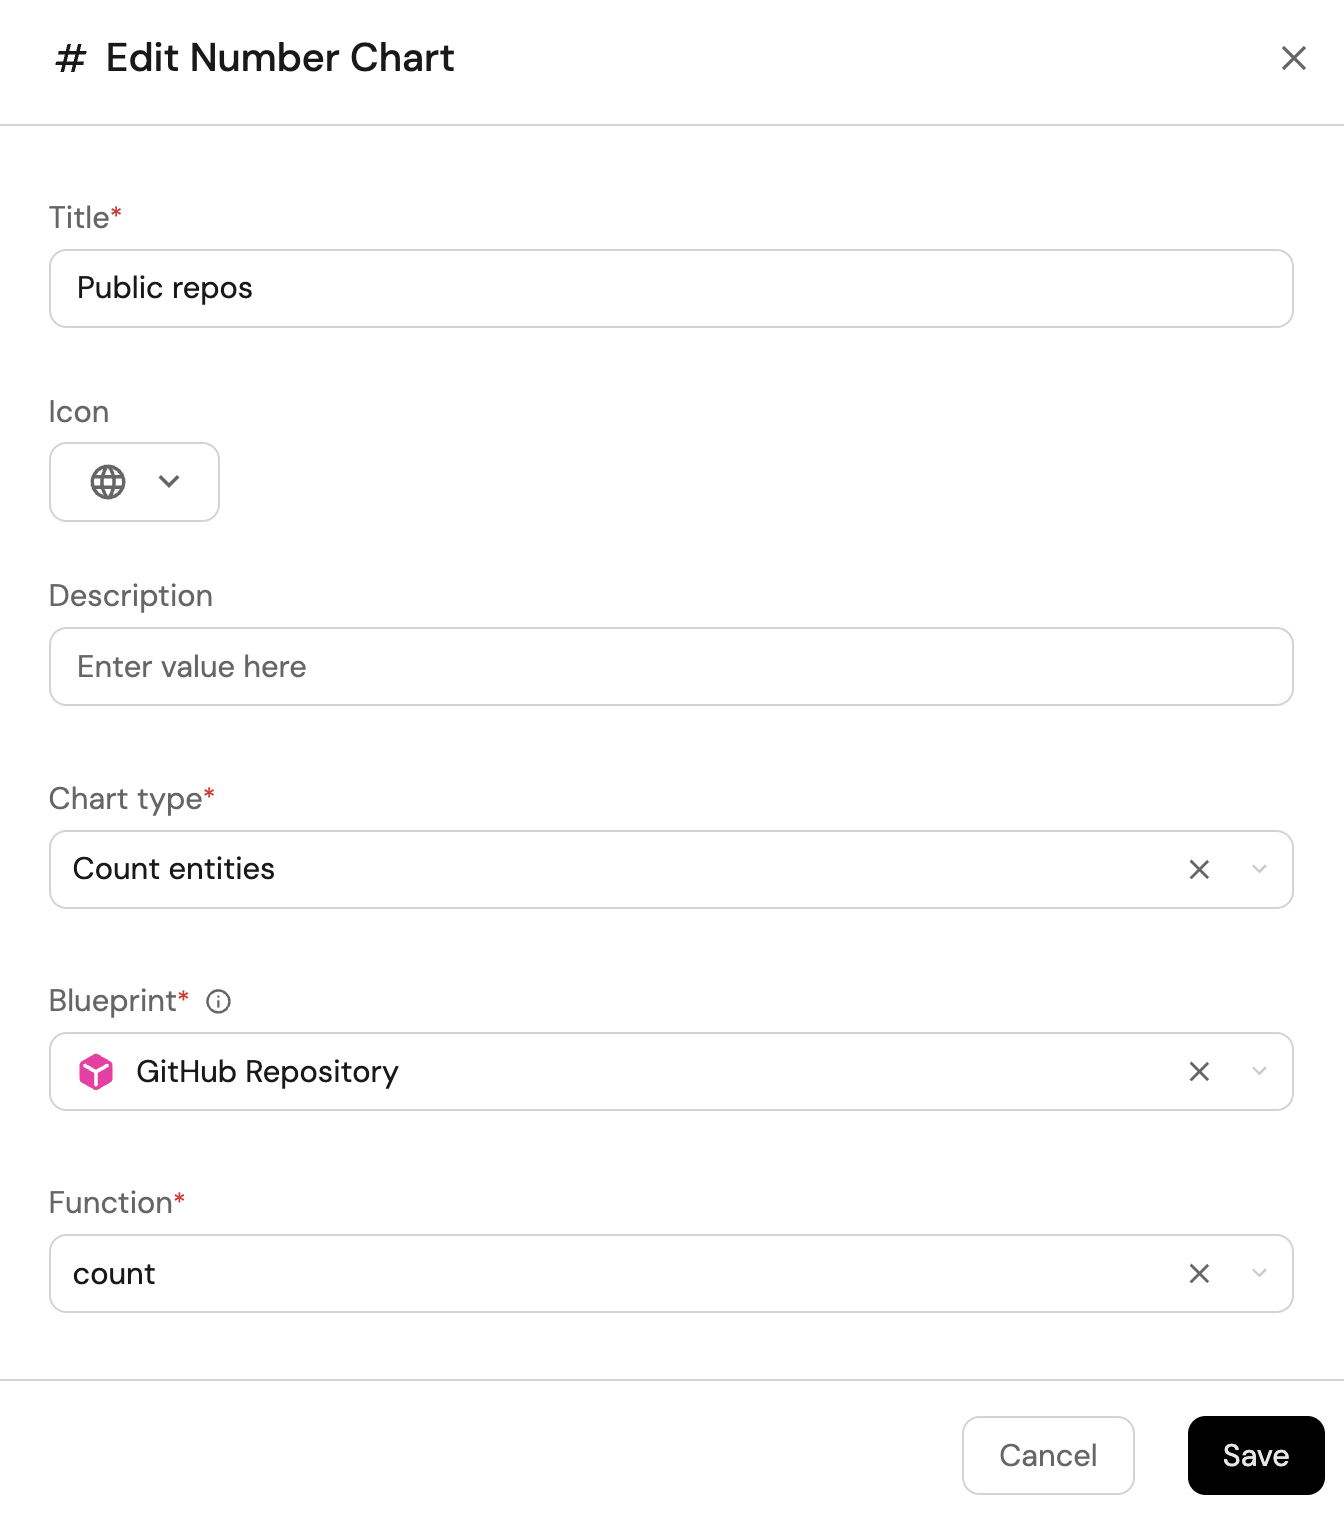
-
Click Save.
Total number of open pull requests (Click to expand)
-
Click
+ Widgetand select Number Chart. -
Title:
Open pull requests(add theGitPullRequesticon). -
Select Count entities Chart type and choose Pull Request as the Blueprint.
-
Select count for the Function.
-
Add this JSON to the Additional filters editor to filter
openpull requests:[{"combinator":"and","rules":[{"property":"status","operator":"=","value":"open"}]}] -
Select custom as the Unit and input
PRsas the Custom unit.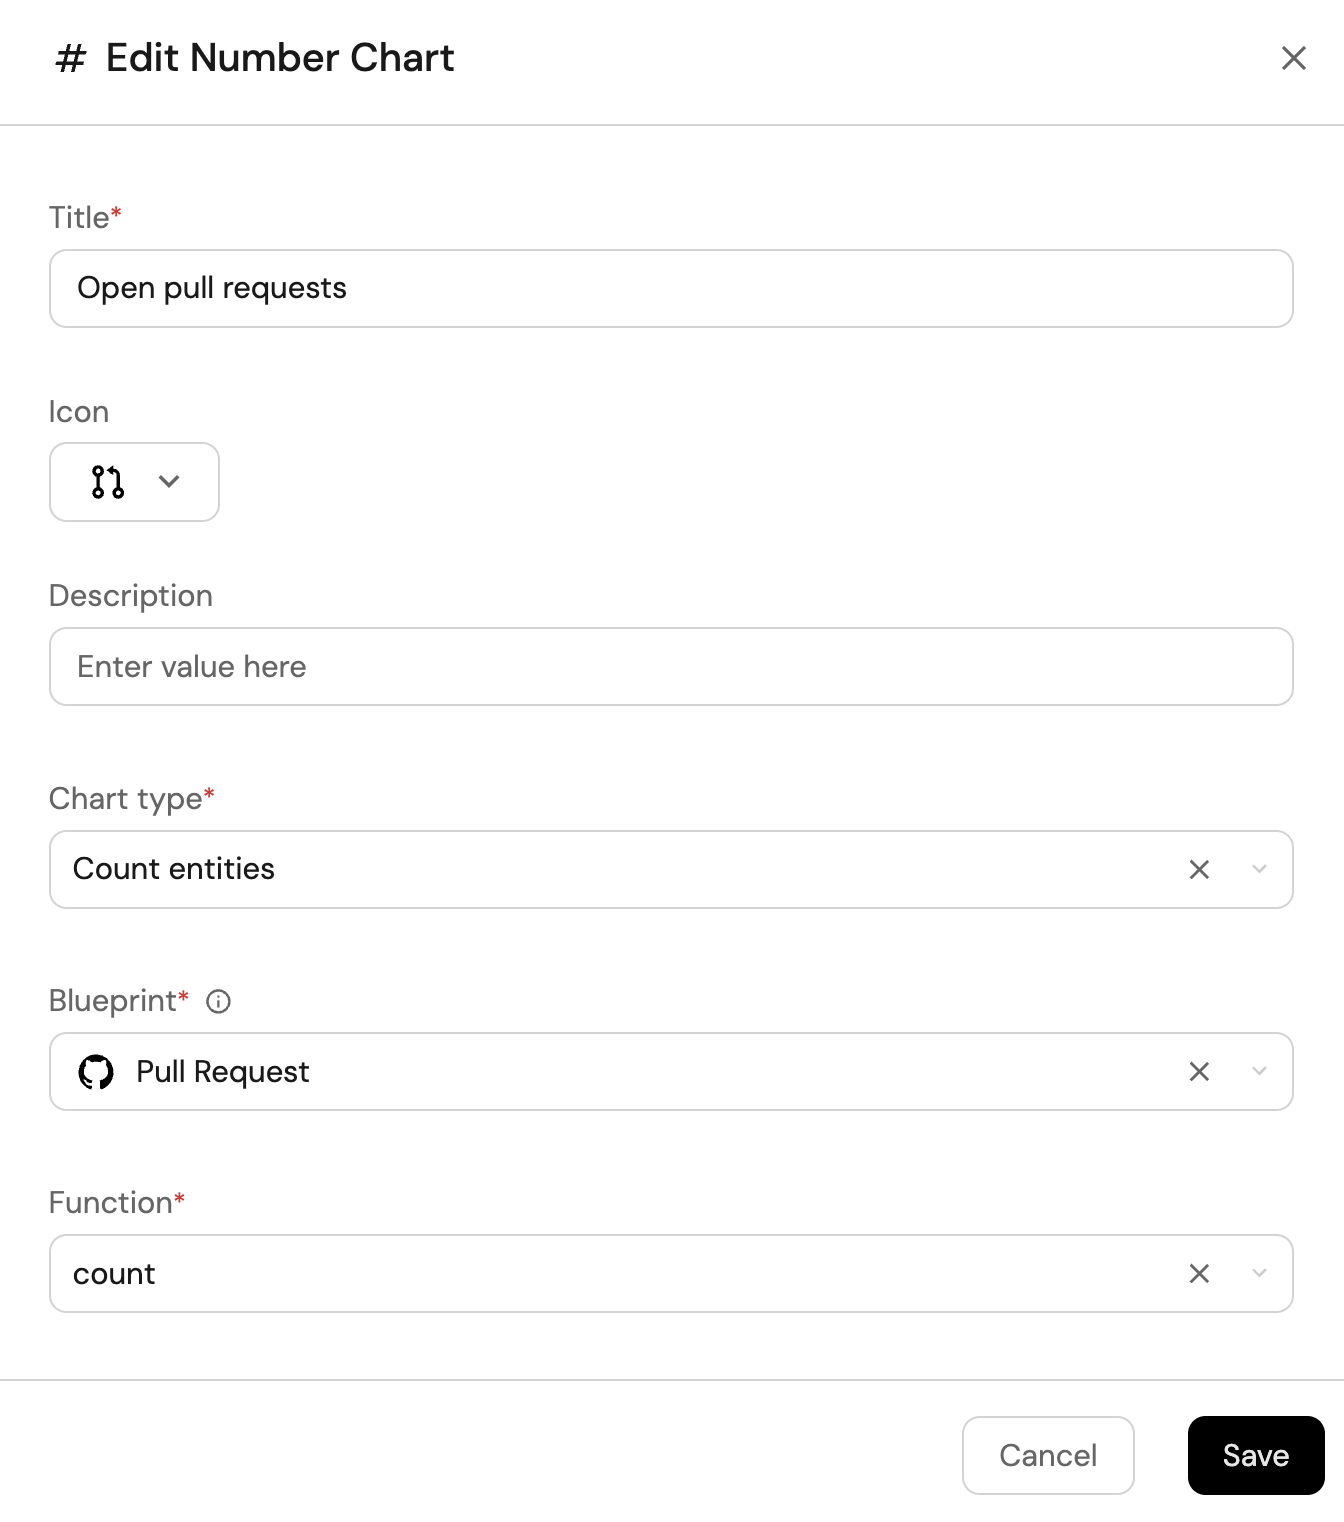
-
Click Save.
Total number of merged pull requests (Click to expand)
-
Click
+ Widgetand select Number Chart. -
Title:
Merged pull requests (30 days)(add theMergeicon). -
Select Count entities Chart type and choose Pull Request as the Blueprint.
-
Select count for the Function.
-
Add this JSON to the Additional filters editor to filter
mergedpull requests updated in the last month:[{"combinator":"and","rules":[{"property":"status","operator":"=","value":"merged"},{"property":"updatedAt","operator":"between","value":{"preset":"lastMonth"}}]}] -
Select custom as the Unit and input
PRsas the Custom unit.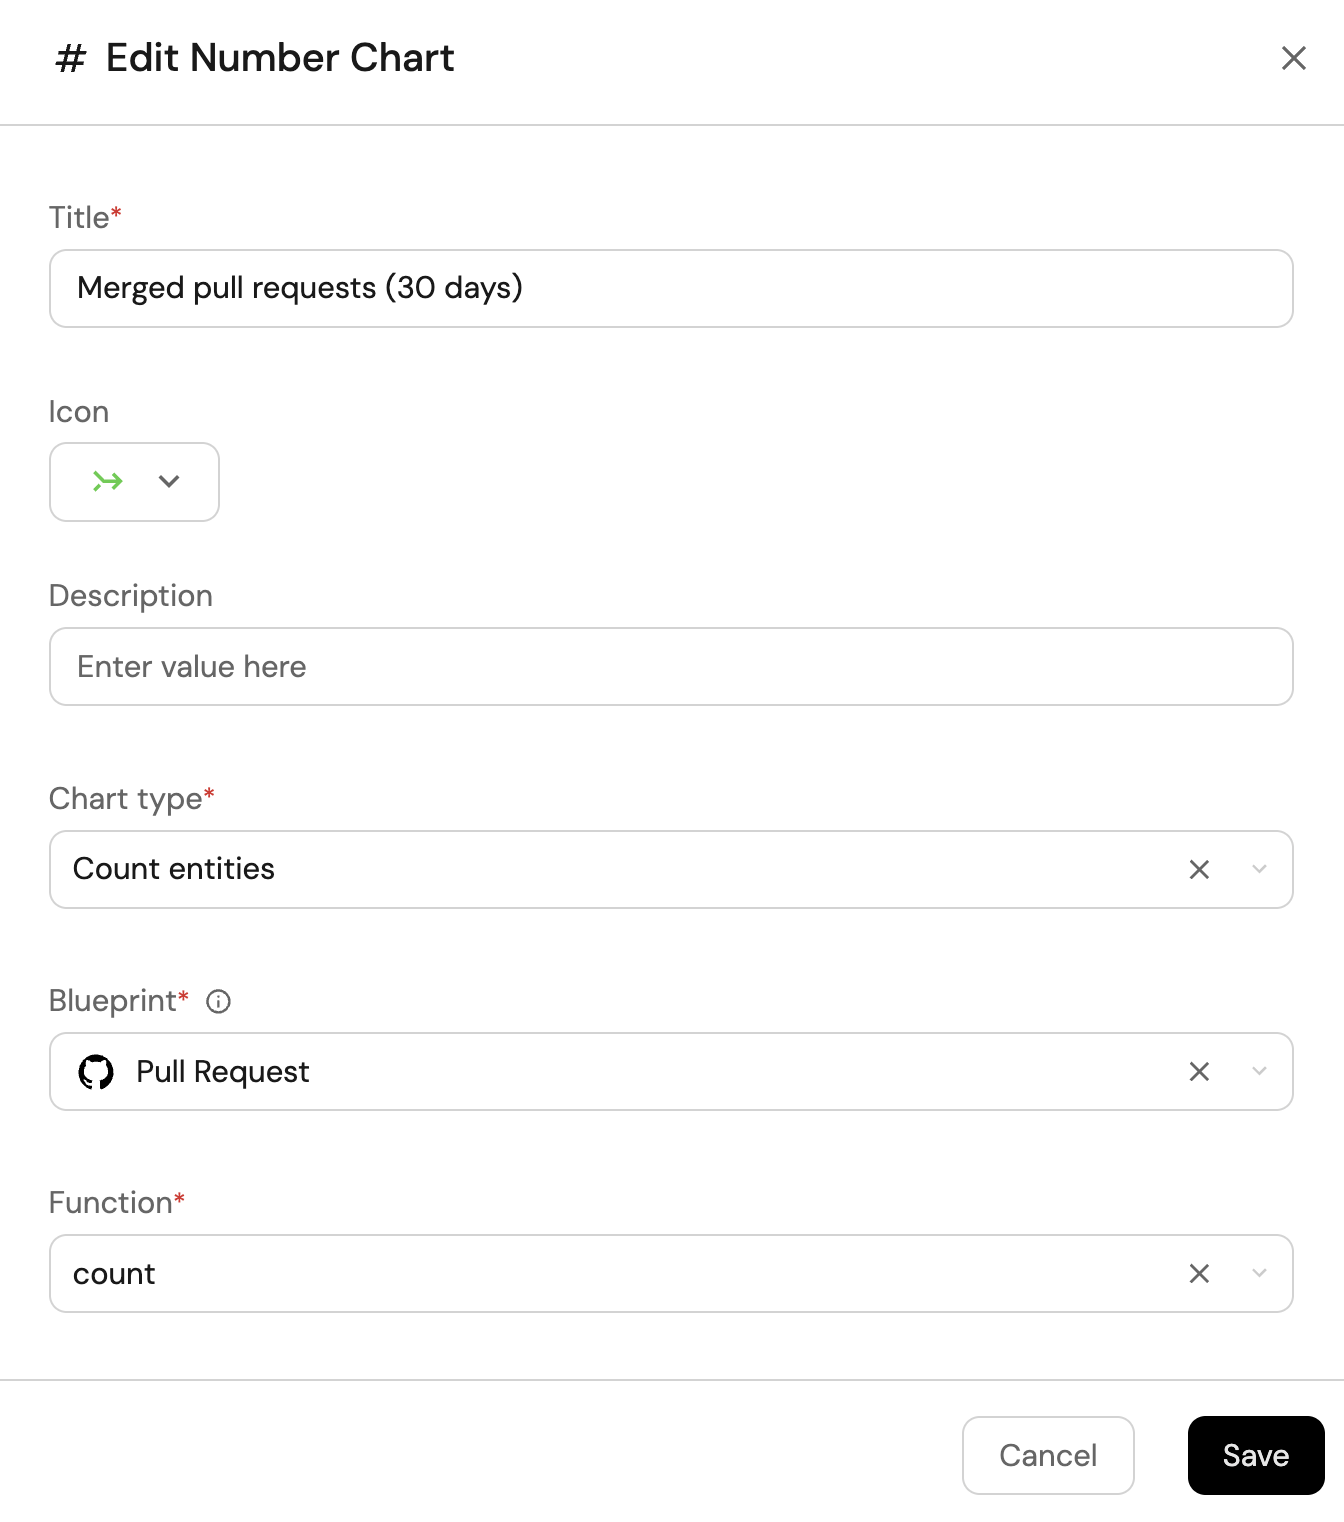
-
Click Save.
Total number of open GitHub issues (Click to expand)
-
Click
+ Widgetand select Number Chart. -
Title:
Open issues(add theAlerticon). -
Select Count entities Chart type and choose Issue as the Blueprint.
-
Select count for the Function.
-
Add this JSON to the Additional filters editor to filter
openissues:[{"combinator":"and","rules":[{"property":"status","operator":"=","value":"open"}]}] -
Select custom as the Unit and input
issuesas the Custom unit.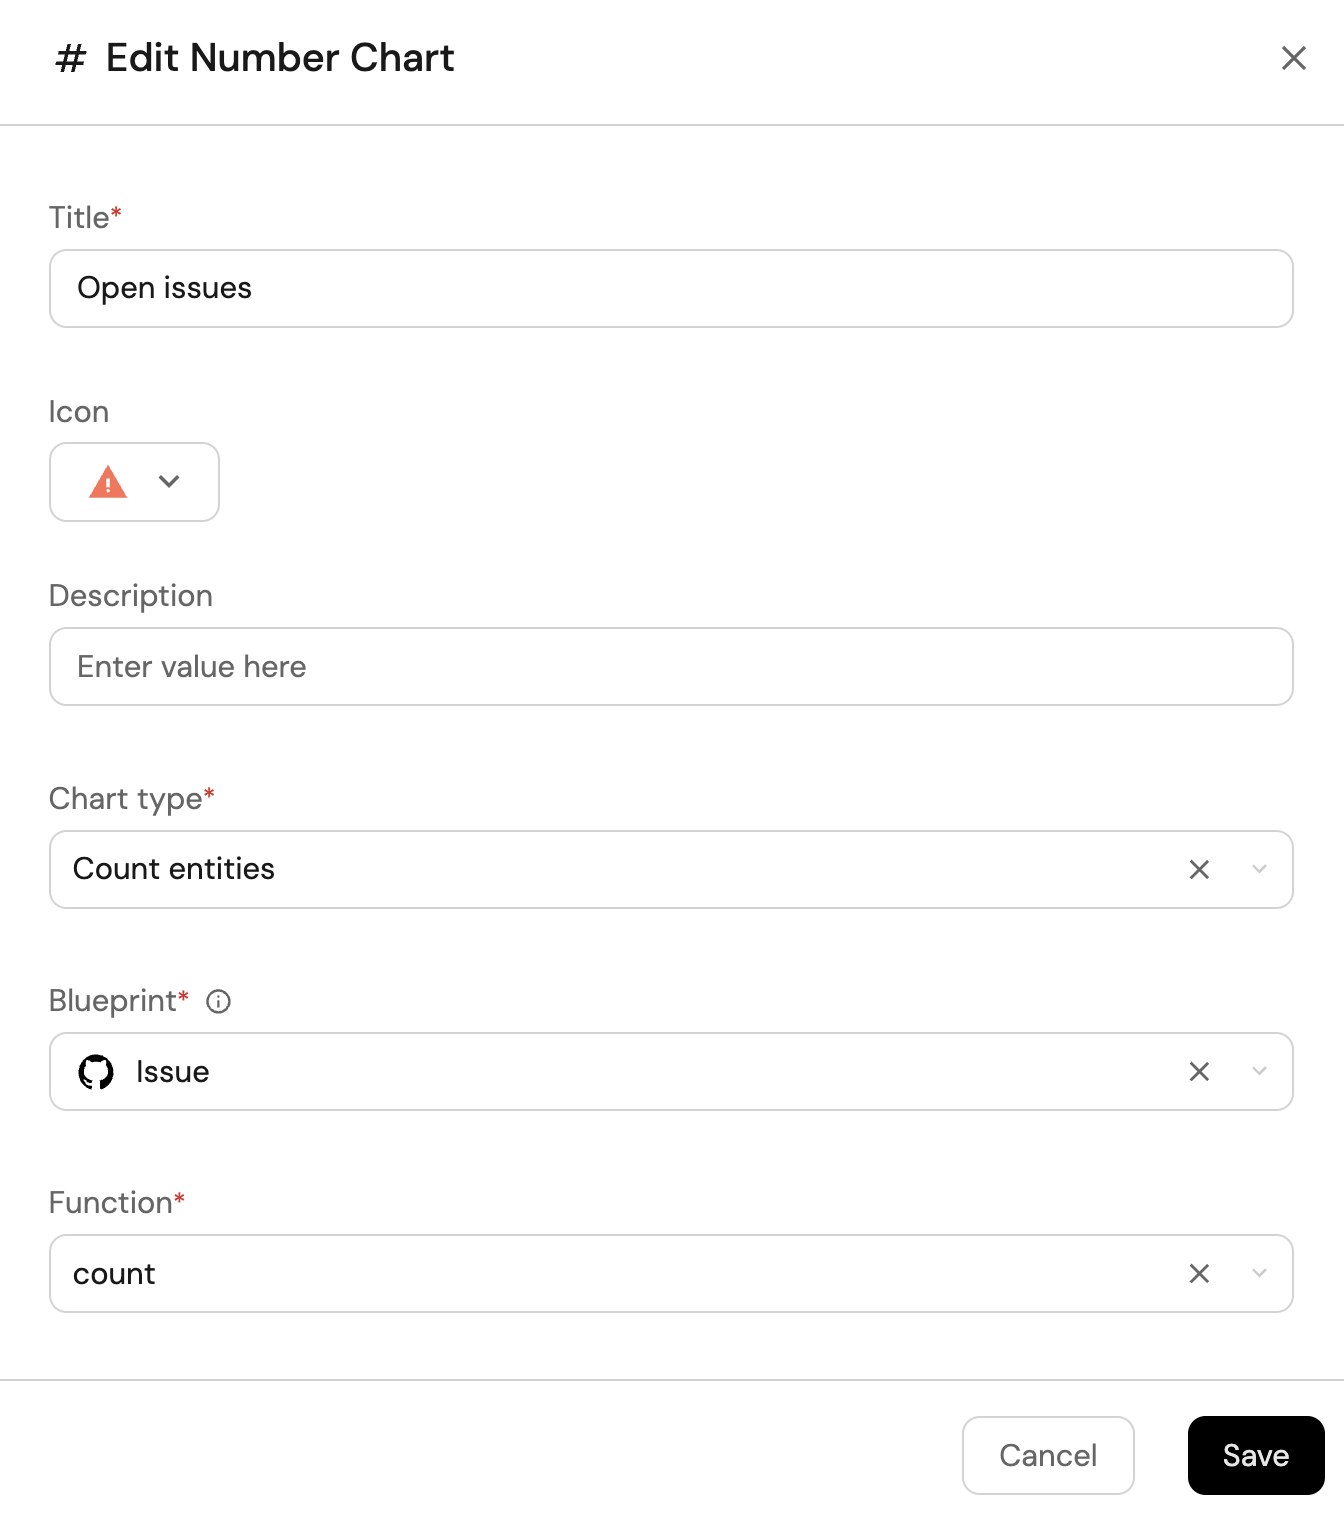
-
Click Save.
Engineering metrics
Use this section to build a dashboard for GitHub engineering performance metrics. You will learn how to:
- Extend the GitHub Pull Request blueprint with PR metrics.
- Create a GitHub Workflow blueprint.
- Set up automated metric collection with GitHub Actions.
- Visualize PR lifetime, PR size, workflow success rate, and workflow duration.
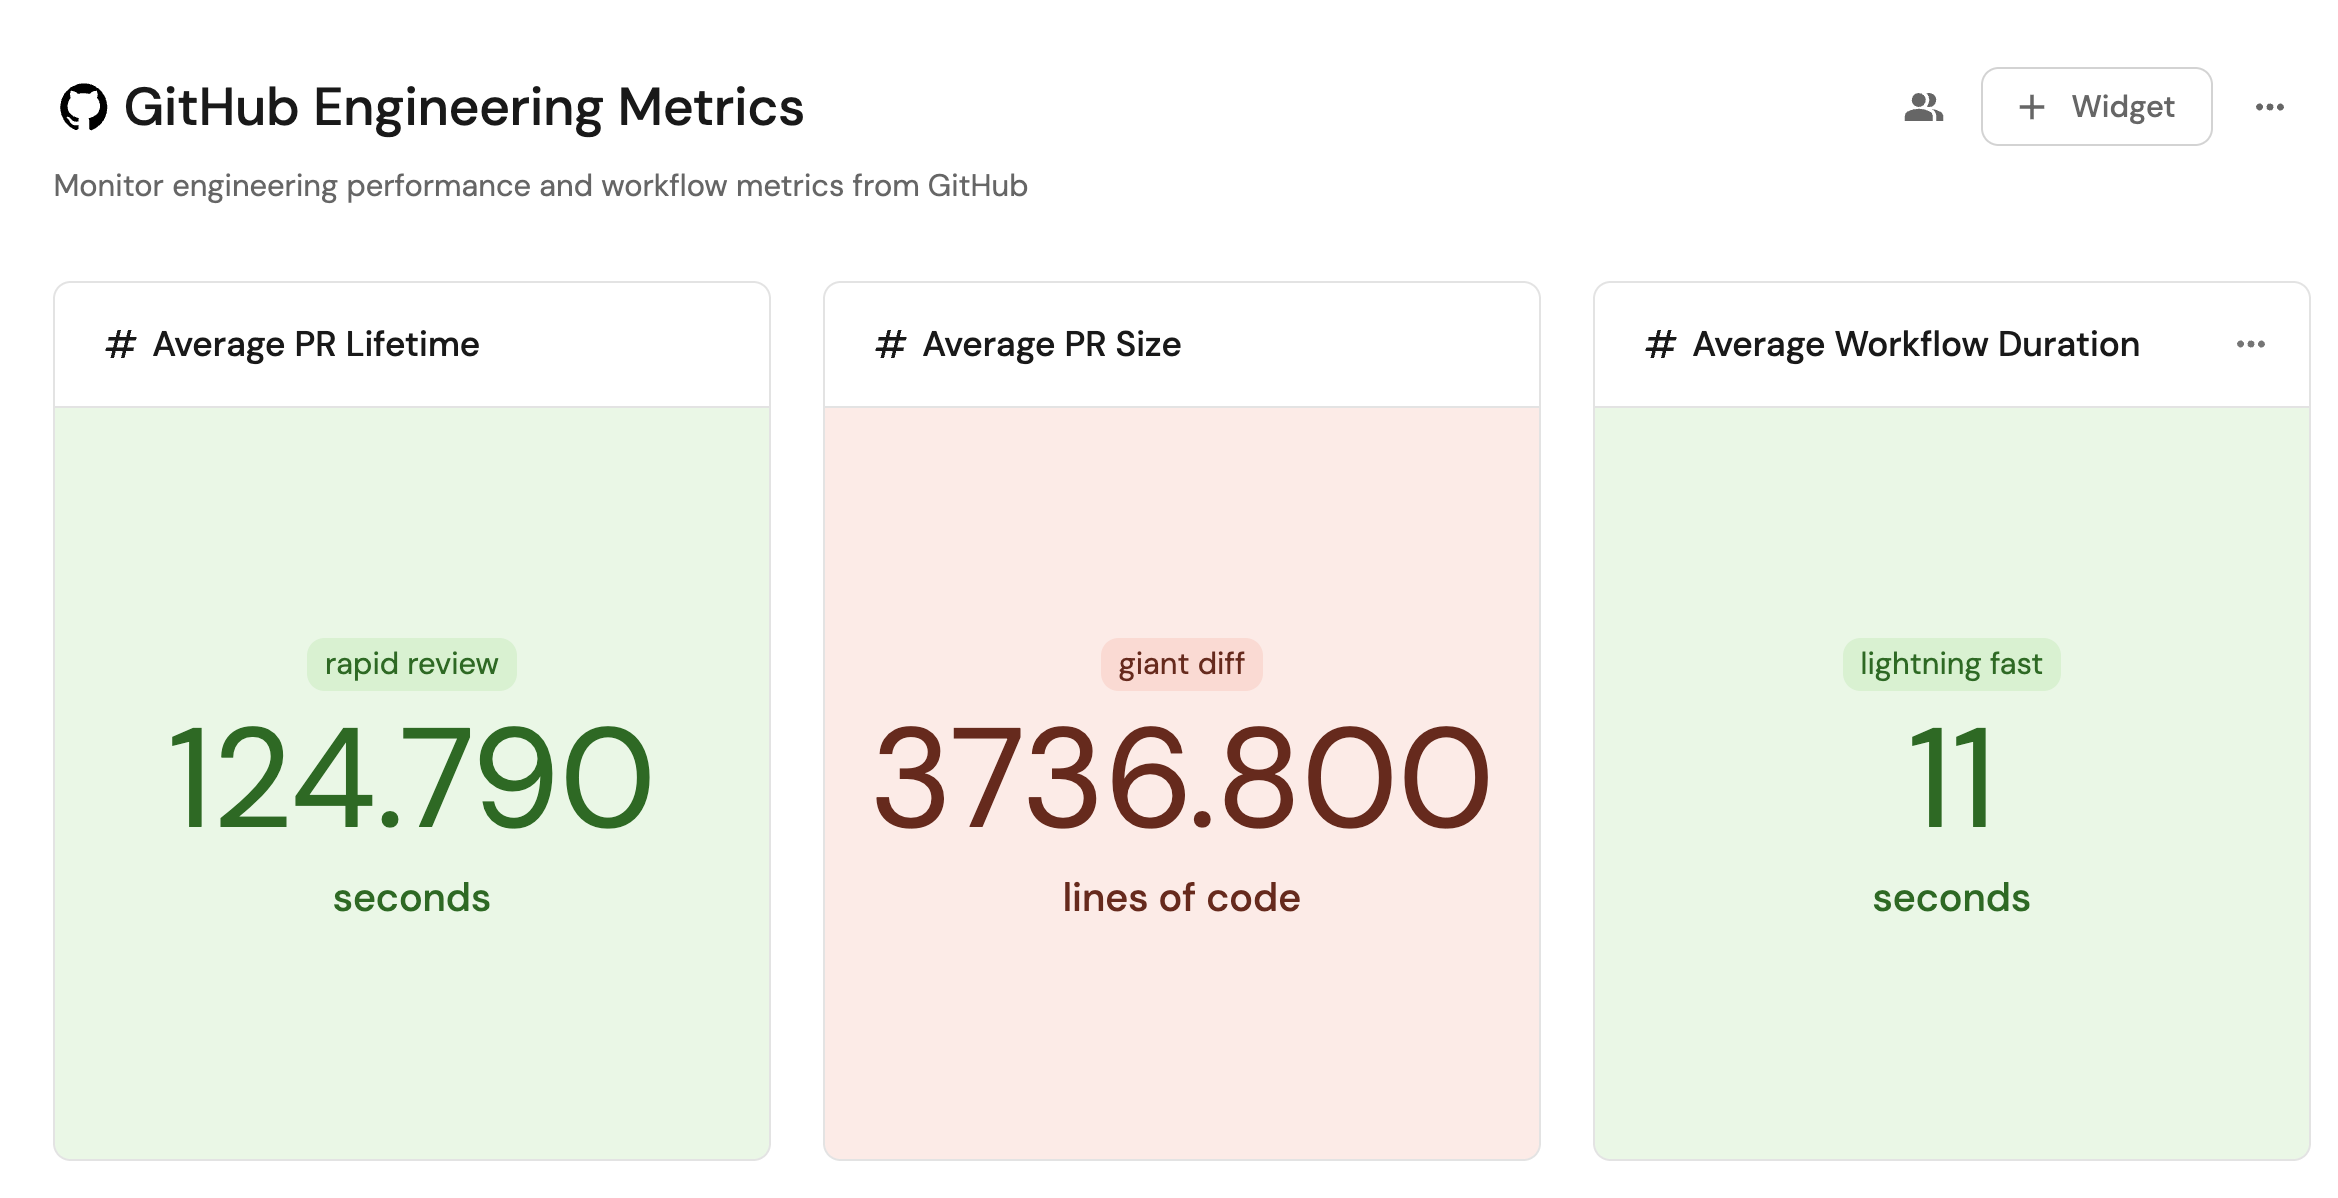
Set up the engineering metrics data model
The Service and User blueprints are created by default during onboarding. The GitHub Pull Request blueprint is created by your GitHub integration. We need to extend the existing Pull Request blueprint to capture the detailed metrics we want to track.
Extend the GitHub Pull Request blueprint with metrics
The Pull Request blueprint is created by default when you install the GitHub integration.
If you're using GitHub Ocean, configure your pull-request selector with states: ["open"], use .__repository for the repository relation, and .state for the status property mapping. See the GitHub Ocean migration guide for details.
-
Go to the Builder page of your portal.
-
Find and click on the
Pull Requestblueprint. -
Click on the
{...}button in the top right corner, and chooseEdit JSON. -
Add these additional properties to the existing schema:
Extended Pull Request properties (Click to expand)
{"pr_size": {"title": "PR Size","type": "number"},"pr_lifetime": {"title": "PR Lifetime (seconds)","type": "number"},"pr_pickup_time": {"title": "PR Pickup Time (seconds)","type": "number"},"pr_success_rate": {"title": "PR Success Rate (%)","type": "number"},"review_participation": {"title": "Review Participation","type": "number"}} -
Click Save to update the blueprint.
Create the GitHub Workflow blueprint
We need to create a new blueprint to track GitHub workflow metrics.
-
Go to the Builder page of your portal.
-
Click on + Blueprint.
-
Click on the
{...}button in the top right corner, and chooseEdit JSON. -
Add this JSON schema:
GitHub Workflow blueprint (Click to expand)
{"identifier": "githubWorkflow","title": "Workflow","icon": "Github","schema": {"properties": {"path": {"title": "Path","type": "string"},"status": {"title": "Status","type": "string","enum": ["active","deleted","disabled_fork","disabled_inactivity","disabled_manually"],"enumColors": {"active": "green","deleted": "red"}},"createdAt": {"title": "Created At","type": "string","format": "date-time"},"updatedAt": {"title": "Updated At","type": "string","format": "date-time"},"deletedAt": {"title": "Deleted At","type": "string","format": "date-time"},"link": {"title": "Link","type": "string","format": "url"},"medianDuration_last_30_days": {"title": "Median Duration Last 30 days","description": "Median Duration of Successful runs in the last 30 days","type": "number"},"maxDuration_last_30_days": {"title": "Max Duration Last 30 days","description": "Max Duration of Successful runs in the last 30 days","type": "number"},"minDuration_last_30_days": {"title": "Min Duration Last 30 days","description": "Min Duration of Successful runs in the last 30 days","type": "number"},"meanDuration_last_30_days": {"title": "Mean Duration Last 30 days","description": "Mean Duration of Successful runs in the last 30 days","type": "number"},"totalRuns_last_30_days": {"title": "Total Runs Last 30 days","description": "Total workflow runs in the last 30 days","type": "number"},"totalFailures_last_30_days": {"title": "Total Failures Last 30 days","description": "Total Workflow Run Failures in the last 30 days","type": "number"},"successRate_last_30_days": {"title": "Success Rate Last 30 days","description": "Success Rate for the workflow in the last 30 days","type": "number"},"medianDuration_last_90_days": {"title": "Median Duration Last 90 days","description": "Median Duration of Successful runs in the last 90 days","type": "number"},"maxDuration_last_90_days": {"title": "Max Duration Last 90 days","description": "Max Duration of Successful runs in the last 90 days","type": "number"},"minDuration_last_90_days": {"title": "Min Duration Last 90 days","description": "Min Duration of Successful runs in the last 90 days","type": "number"},"meanDuration_last_90_days": {"title": "Mean Duration Last 90 days","description": "Mean Duration of Successful runs in the last 90 days","type": "number"},"totalRuns_last_90_days": {"title": "Total Runs Last 90 days","description": "Total workflow runs in the last 90 days","type": "number"},"totalFailures_last_90_days": {"title": "Total Failures Last 90 days","description": "Total Workflow Run Failures in the last 90 days","type": "number"},"successRate_last_90_days": {"title": "Success Rate Last 90 days","description": "Success Rate for the workflow in the last 90 days","type": "number"}},"required": []},"mirrorProperties": {},"calculationProperties": {},"aggregationProperties": {},"relations": {"repository": {"title": "Repository","target": "service","required": false,"many": false}}} -
Click Save to create the blueprint.
Collect GitHub engineering metrics
Now we will set up automated metric collection using the GitHub metrics exporter. This tool will pull data from the GitHub API and calculate the metrics we defined in our blueprints.
Configure a GitHub personal access token
The metric exporter needs access to the GitHub API to pull the relevant data. You will need to configure a classic Personal Access Token (PAT) with the following permissions:
repo- Full control of private repositories.workflow- Update GitHub Action workflows.read:org- Read org and team data.read:user- Read user profile data.user:email- Access user email addresses.read:enterprise- Read enterprise data.read:audit_log- Read audit logs (required for determining join dates).
The GitHub PAT requires enterprise-level permissions to access audit logs for determining user join dates. Make sure your token has the necessary scope.
Set up the metrics exporter
-
Clone the repository from https://github.com/port-experimental/github-metrics.git
-
Copy the example environment file and configure it with your access keys:
cp .env.example .env -
Fill out the
.envfile with the following variables:PORT_CLIENT_ID- Your Port Client ID.PORT_CLIENT_SECRET- Your Port Client Secret.X_GITHUB_ORGS- Comma-separated list of GitHub organizations to monitor.X_GITHUB_ENTERPRISE- Your GitHub Enterprise instance (if applicable).X_GITHUB_TOKEN- Your GitHub personal access token.
-
Install the CLI:
npm installnpm run buildnpm link -
Run the metric collectors:
gh-metrics onboarding-metricsgh-metrics pr-metricsgh-metrics workflow-metrics
Run the metrics exporter as a GitHub Action
For automated metric collection, add the required secrets and workflow file in the repository that will run the exporter.
Add GitHub metrics secrets
In your GitHub repository, go to Settings > Secrets and add the following secrets:
PORT_CLIENT_ID- Port Client ID learn more.PORT_CLIENT_SECRET- Port Client Secret learn more.X_GITHUB_ORGS- Comma-separated list of GitHub organizations to monitor.X_GITHUB_ENTERPRISE- Your GitHub Enterprise instance (if applicable).X_GITHUB_TOKEN- Your GitHub personal access token.
Create the metric collection workflow
Create the file .github/workflows/collect_metrics.yml in your repository:
GitHub metrics collection workflow (Click to expand)
name: collect_metrics
on:
    workflow_dispatch:
    schedule:
      - cron: '0 0 * * *'
jobs:
    onboarding:
      name: onboarding_metrics
      runs-on: ubuntu-latest
      steps:
        - uses: actions/checkout@v6
        - uses: oven-sh/setup-bun@v2
        - run: bun run src/main.ts onboarding-metrics
          env:
            X_GITHUB_ORGS: ${{ secrets.X_GITHUB_ORGS }}
            X_GITHUB_ENTERPRISE: ${{ secrets.X_GITHUB_ENTERPRISE }}
            X_GITHUB_TOKEN: ${{ secrets.X_GITHUB_TOKEN }}
            PORT_CLIENT_ID: ${{ secrets.PORT_CLIENT_ID }}
            PORT_CLIENT_SECRET: ${{ secrets.PORT_CLIENT_SECRET }}
    pr:
      name: pr_metrics
      runs-on: ubuntu-latest
      steps:
        - uses: actions/checkout@v6
        - uses: oven-sh/setup-bun@v2
        - run: bun run src/main.ts pr-metrics
          env:
            X_GITHUB_ORGS: ${{ secrets.X_GITHUB_ORGS }}
            X_GITHUB_ENTERPRISE: ${{ secrets.X_GITHUB_ENTERPRISE }}
            X_GITHUB_TOKEN: ${{ secrets.X_GITHUB_TOKEN }}
            PORT_CLIENT_ID: ${{ secrets.PORT_CLIENT_ID }}
            PORT_CLIENT_SECRET: ${{ secrets.PORT_CLIENT_SECRET }}
    workflow:
      name: workflow_metrics
      runs-on: ubuntu-latest
      steps:
        - uses: actions/checkout@v6
        - uses: oven-sh/setup-bun@v2
        - run: bun run src/main.ts workflow-metrics
          env:
            X_GITHUB_ORGS: ${{ secrets.X_GITHUB_ORGS }}
            X_GITHUB_ENTERPRISE: ${{ secrets.X_GITHUB_ENTERPRISE }}
            X_GITHUB_TOKEN: ${{ secrets.X_GITHUB_TOKEN }}
            PORT_CLIENT_ID: ${{ secrets.PORT_CLIENT_ID }}
            PORT_CLIENT_SECRET: ${{ secrets.PORT_CLIENT_SECRET }}
This workflow will run daily at midnight and collect metrics for:
- Onboarding metrics - Track user join dates and team assignments.
- PR metrics - Calculate PR size, lifetime, pickup time, and success rates.
- Workflow metrics - Track workflow execution times and success rates.
The metrics are collected daily by default. You can adjust the cron schedule in the GitHub Action to collect metrics more or less frequently based on your needs.
For large organizations with many repositories, run the metrics collection during off-peak hours to reduce the chance of GitHub API rate limit issues.
Visualize GitHub engineering metrics
With your data collection in place, we can create a dashboard in Port to visualize all GitHub metrics and track engineering performance.
Create the engineering metrics dashboard
-
Navigate to your software catalog.
-
Click on the
+button in the left sidebar. -
Select New dashboard.
-
Name the dashboard GitHub Engineering Metrics.
-
Input
Monitor engineering performance and workflow metrics from GitHubunder Description. -
Select the
GitHubicon. -
Click Create.
Add engineering metrics widgets
In the new dashboard, create the following widgets to visualize your GitHub metrics:
Average PR Lifetime (Click to expand)
-
Click
+ Widgetand select Number Chart. -
Title:
Average PR Lifetime(add theGitHubicon). -
Select Average entities Chart type and choose GitHub Pull Request as the Blueprint.
-
Select
pr_lifetimefor the Property and choose Average oftotal. -
Select custom as the Unit and input
secondsas the Custom unit. -
Click Save.
Average PR Size (Click to expand)
-
Click
+ Widgetand select Number Chart. -
Title:
Average PR Size(add theGitHubicon). -
Select Average entities Chart type and choose GitHub Pull Request as the Blueprint.
-
Select
pr_sizefor the Property and choose Average oftotal. -
Select custom as the Unit and input
lines of codeas the Custom unit. -
Click Save.
Total Merged PRs (Click to expand)
-
Click
+ Widgetand select Number Chart. -
Title:
Total Merged PRs(add theGitHubicon). -
Select Count entities Chart type and choose GitHub Pull Request as the Blueprint.
-
Select count for the Function.
-
Add this JSON to the Additional filters editor to filter merged PRs:
[{"combinator":"and","rules":[{"property":"pr_success_rate","operator":"=","value": 1}]}] -
Select custom as the Unit and input
PRsas the Custom unit. -
Click Save.
Workflow Success Rates (Click to expand)
-
Click
+ Widgetand select Number Chart. -
Title:
Average Workflow Success Rate (30 days)(add theGitHubicon). -
Select Average entities Chart type and choose Workflow as the Blueprint.
-
Select
successRate_last_30_daysfor the Property and choose Average oftotal. -
Select custom as the Unit and input
%as the Custom unit. -
Click Save.
Average Workflow Duration (Click to expand)
-
Click
+ Widgetand select Number Chart. -
Title:
Average Workflow Duration(add theGitHubicon). -
Select Average entities Chart type and choose Workflow as the Blueprint.
-
Select
meanDuration_last_30_daysfor the Property and choose Average oftotal. -
Select custom as the Unit and input
secondsas the Custom unit. -
Click Save.
PR Metrics Table (Click to expand)
-
Click
+ Widgetand select Table. -
Title:
PR Performance Metrics(add theGitHubicon). -
Choose the GitHub Pull Request blueprint.
-
Click Save to add the widget to the dashboard.
-
Click on the
...button in the top right corner of the table and select Customize table. -
In the top right corner of the table, click on Manage Properties and add the following properties:
- Title: The PR title.
- PR Size: Number of lines changed.
- PR Lifetime (seconds): Time from creation to merge.
- PR Pickup Time (seconds): Time to first review.
- PR Success Rate (%): Percentage of successful PRs.
- Review Participation: Number of reviewers.
- State: Current PR state (open, closed, merged).
-
Click on Group by any Column and select Repository.
-
Click on the save icon in the top right corner of the widget to save the customized table.